
Indian Springs Sports Complex
Indian Springs Sports Complex
USSSA Facility Activity Profile | 2001-2026
Broken Arrow, Oklahoma. Independent research using publicly available USSSA information to examine documented tournament and league activity, direct facility records, multi-facility associations, director concentrations, geographic reach, and calculated team participation activity.

Primary Facility Snapshot
Pages 1-2 represent the conservative direct / stand-alone population: records in which Indian Springs Sports Complex is listed independently as the event facility and multi-facility combinations are excluded.
Page 1 - Direct / Stand-Alone Activity
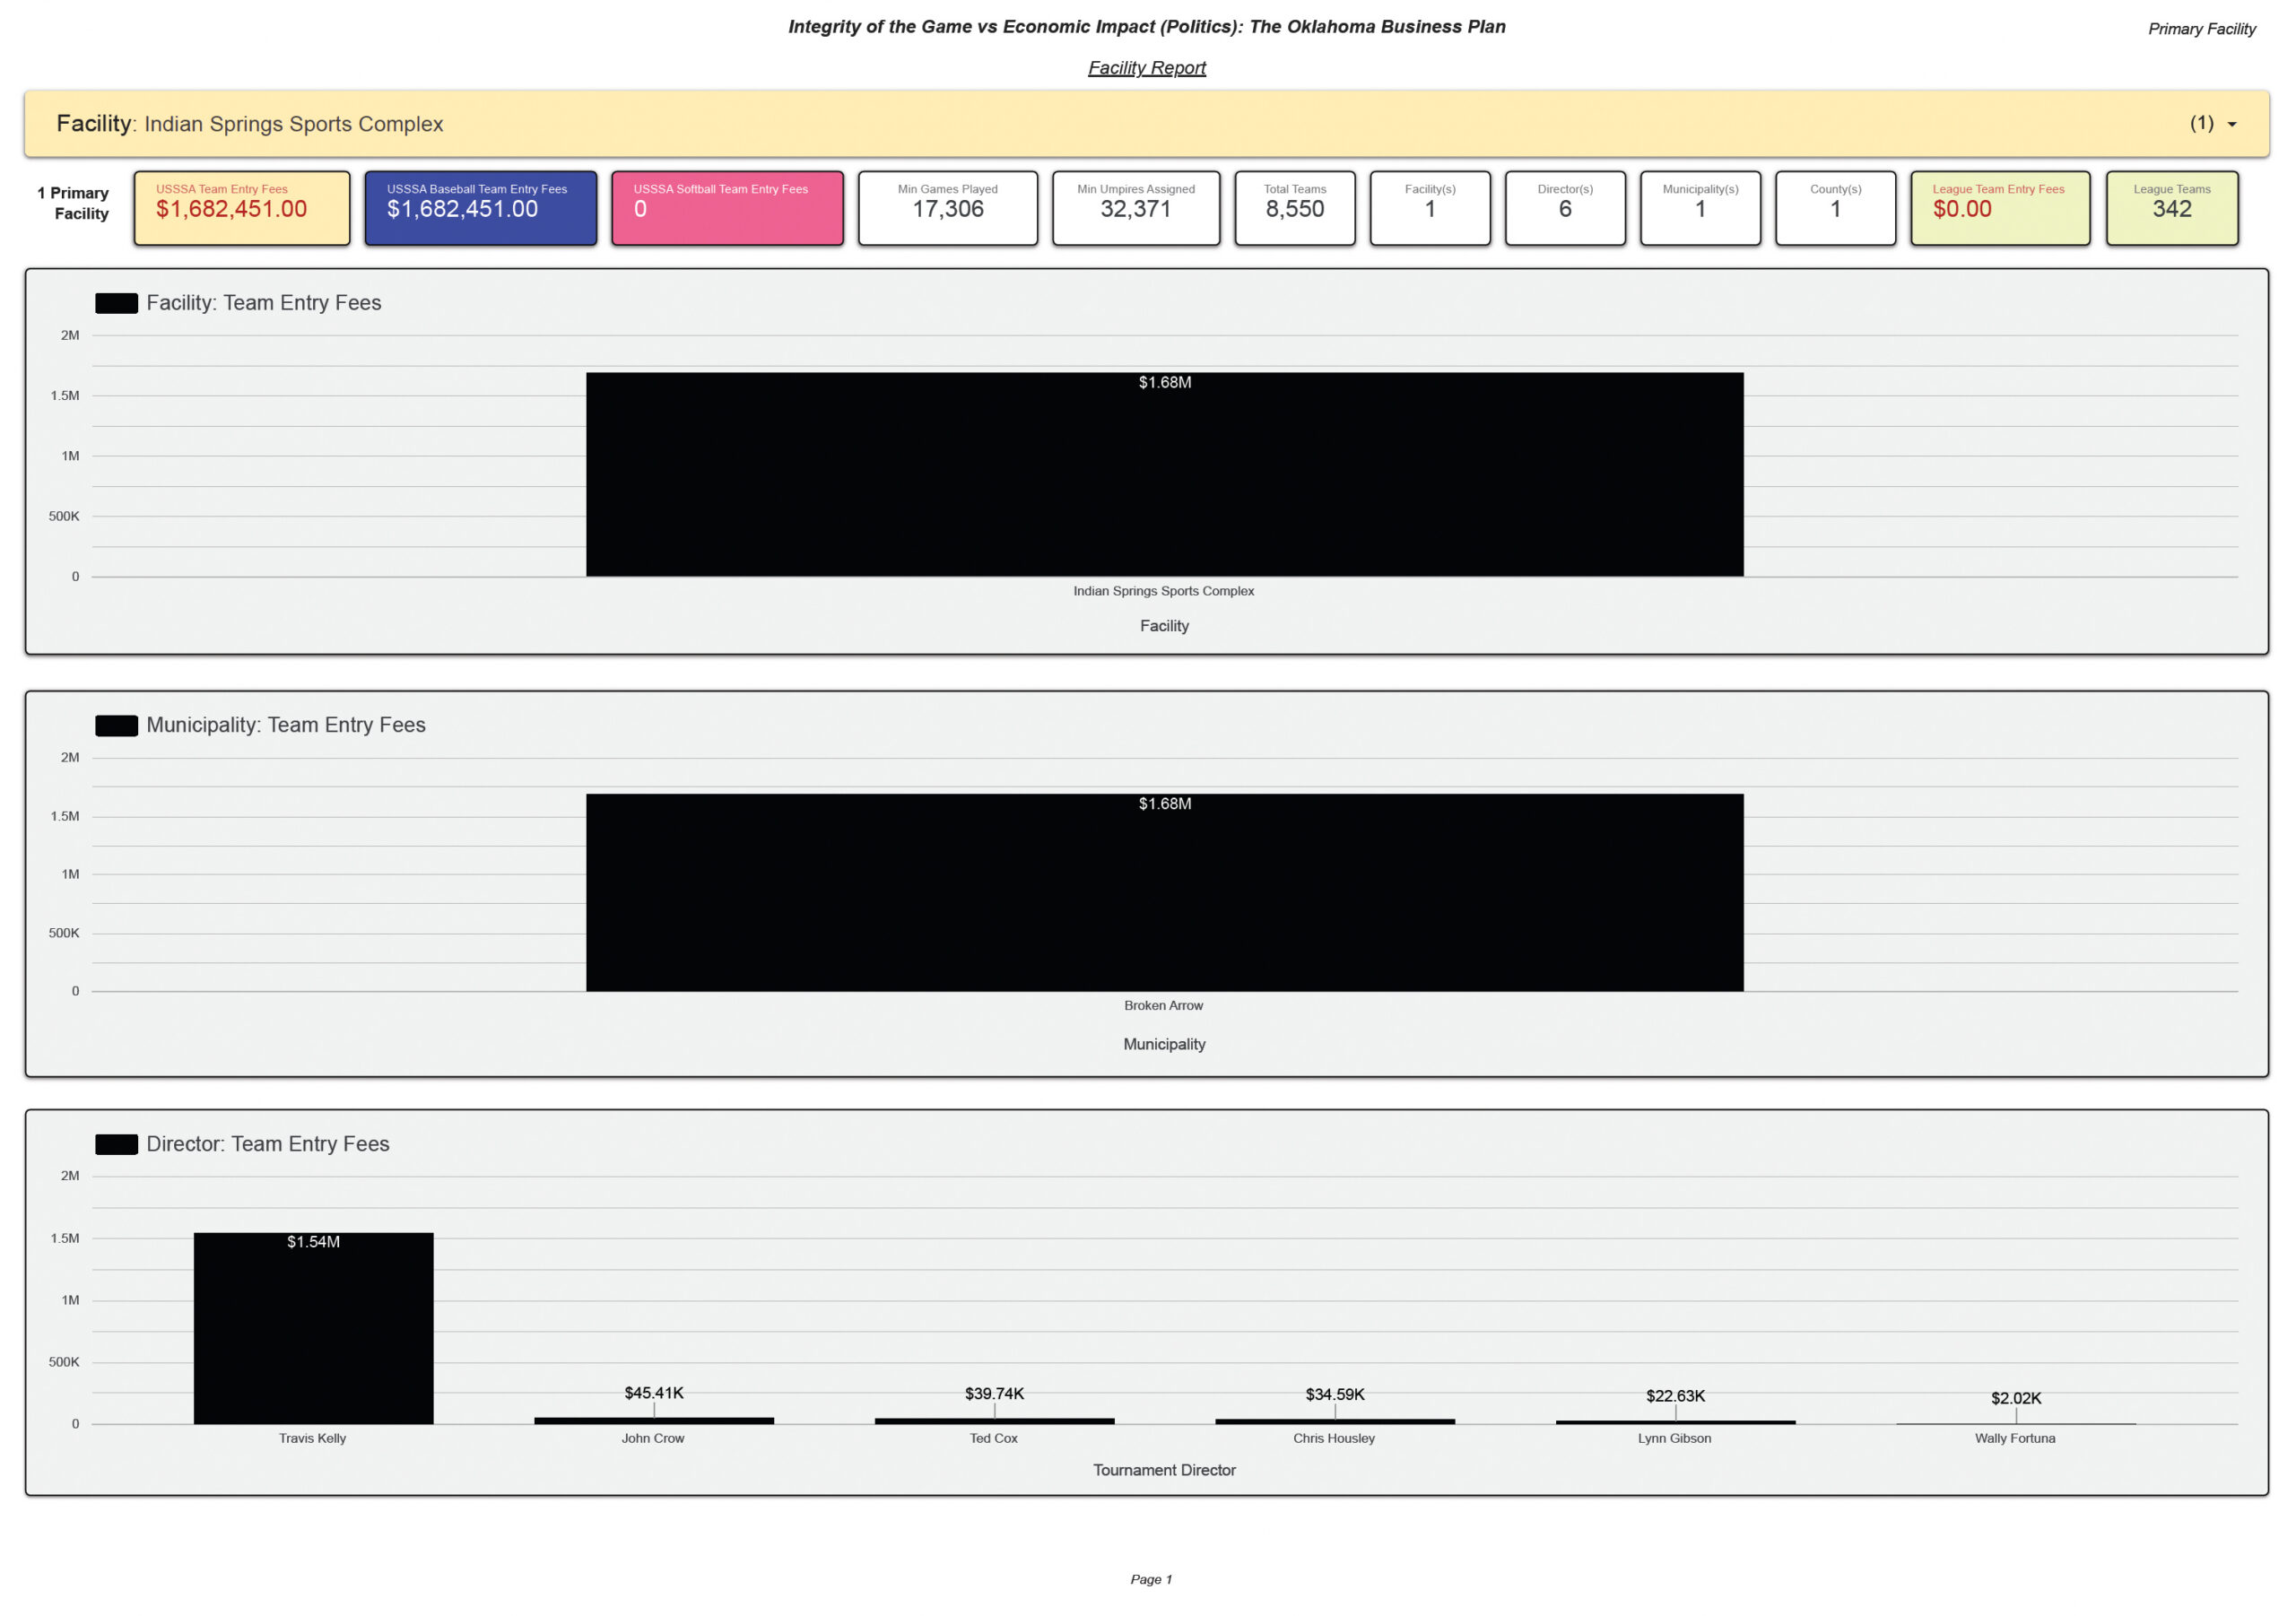
What Page 1 Shows
Indian Springs Sports Complex is the only facility in the direct population, and Broken Arrow is the only municipality displayed. The report associates approximately $1.68 million in direct Calculated Team Entry Fees with this stand-alone facility population.
The director chart is led by Travis Kelly at approximately $1.54 million, followed by John Crow ($45.41K), Ted Cox ($39.74K), Chris Housley ($34.59K), Lynn Gibson ($22.63K), and Wally Fortuna ($2.02K).
These director amounts represent calculated activity associated with event records. They are not evidence of director income, compensation, collections, profit, or receipt of funds.
Page 2 - Annual & Sport Trends
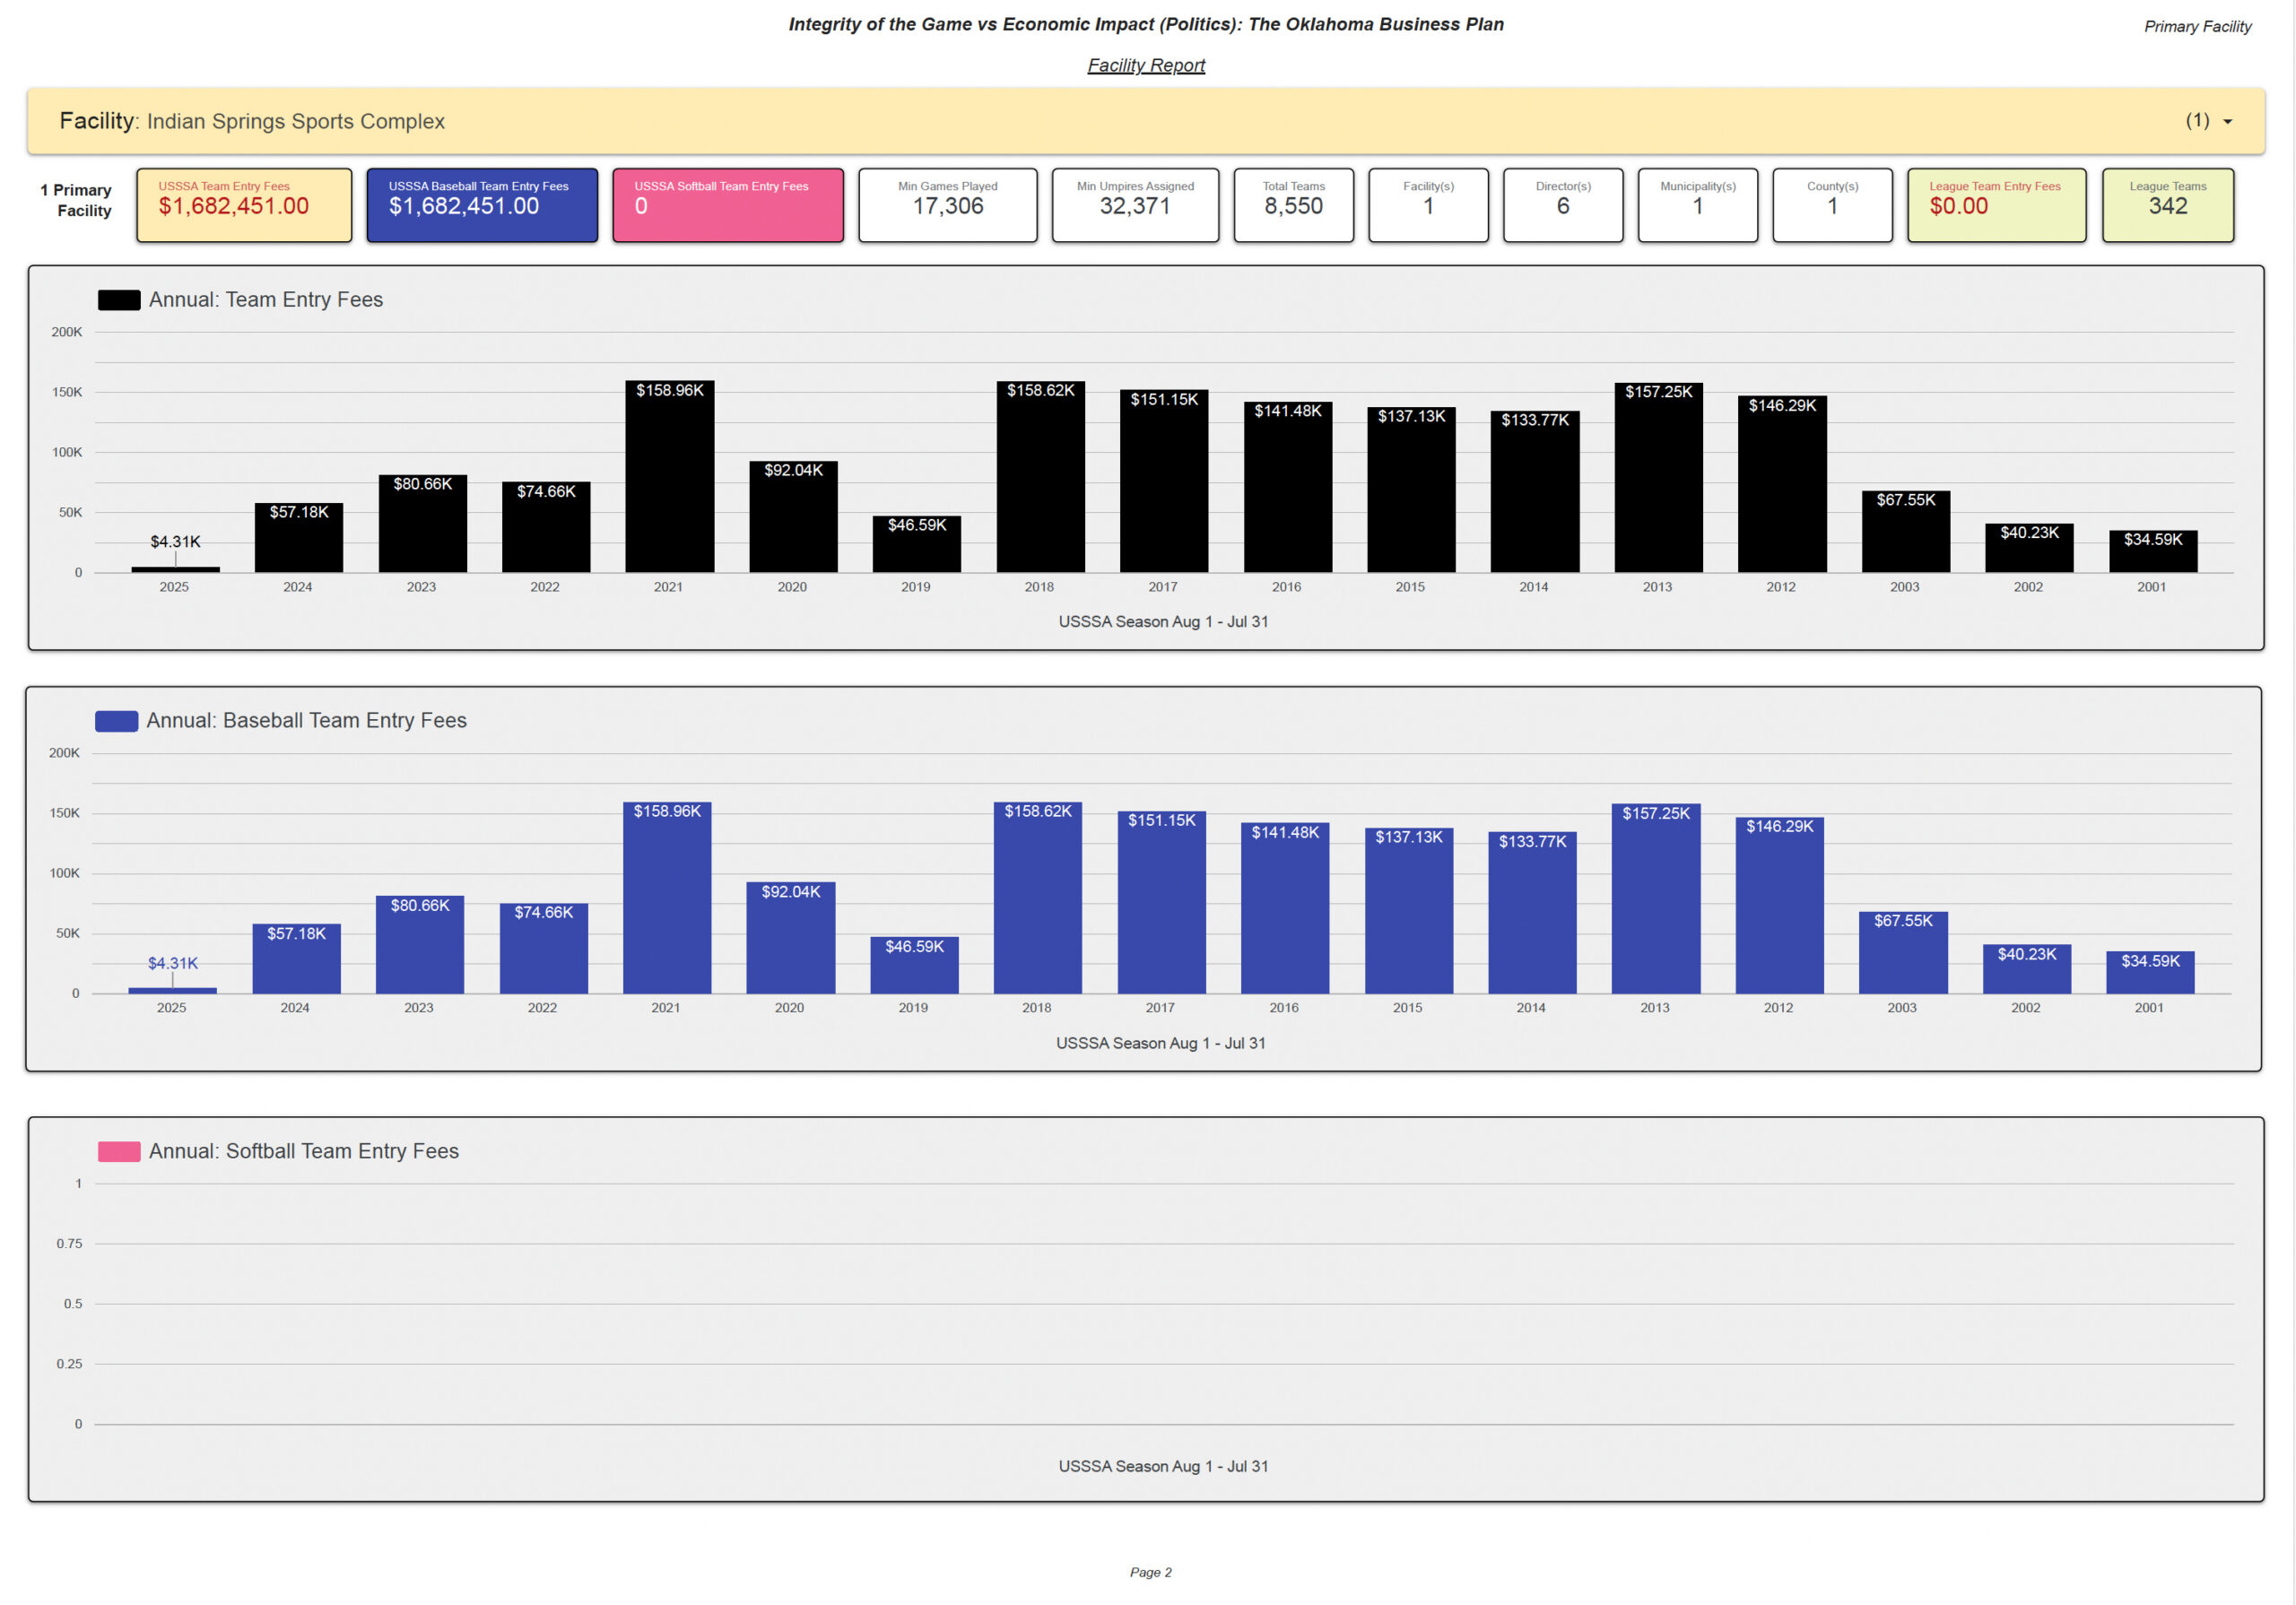
Annual Direct Activity
The direct series is entirely baseball in the displayed report. The highest displayed season is 2021 at $158.96K, narrowly above 2018 ($158.62K) and 2013 ($157.25K). The softball series is zero for the displayed population.
The report displays activity in 2001-2003 and again from 2012-2025. Years not shown should not be treated as zero without supporting records.
Page 3 - Associated Multi-Facility / Satellite Activity
This population excludes the stand-alone Primary Facility records and examines events where Indian Springs Sports Complex appears with one or more additional facilities.

Associated Activity Totals
$459,787 in Calculated Team Entry Fees, all baseball, associated with 1,235 teams, 3,242 minimum games, and 6,277 minimum umpire assignments.
The report identifies 14 facility/facility combinations, 3 directors, 9 municipalities, and 3 counties.
Rick Glasser leads the associated director population at $358.64K, followed by Travis Kelly ($64.52K) and Wally Fortuna ($36.62K).
Largest Displayed Facility Combinations
- $86.59K - Indian Springs Sports Complex, OBrien Park, Owasso Park South
- $64.52K - Indian Springs Sports Complex, Tulsa Hilti Park
- $53.54K - Bentley Sports Complex, Indian Springs Sports Complex, OBrien Park, Owasso Park South
- $31.94K - Berryhill High School, Indian Springs Sports Complex, OBrien Park, Owasso Park South, Sperry High School, Tulsa Edison High School, Whittenberg Park
- $30.27K - Indian Springs Sports Complex, Owasso Park South, Tulsa Hilti Park, Victory Christian High School
Page 4 - Combined Documented Facility Activity Footprint
Pages 1-2 Direct Activity + Page 3 Associated Multi-Facility Activity = Page 4 Combined Documented Facility Activity Footprint. This is the broadest documented activity footprint involving Indian Springs Sports Complex; it is not proof that every dollar, team, game, or official represented occurred exclusively at the Primary Facility.

Combined Totals
$2,142,238 in Calculated Team Entry Fees, all baseball.
9,785 teams | 20,548 minimum games | 38,648 minimum umpire assignments
15 facility/facility combinations | 7 directors | 9 municipalities | 3 counties
The combined director chart is led by Travis Kelly at approximately $1.6M, followed by Rick Glasser ($358.64K), John Crow ($45.41K), Ted Cox ($39.74K), Wally Fortuna ($38.65K), Chris Housley ($34.59K), and Lynn Gibson ($22.63K).
Direct, Associated & Combined - How to Read the Report
DIRECT
Primary Facility alone.
$1,682,451 in Calculated Team Entry Fees, 8,550 teams, 17,306 minimum games, 32,371 minimum umpire assignments.
ASSOCIATED
Primary Facility within multi-site configurations.
$459,787 in Calculated Team Entry Fees across 14 facility combinations, 9 municipalities, and 3 counties.
COMBINED
Both analytical populations together.
$2,142,238 in the combined documented facility activity footprint, 9,785 teams, 20,548 minimum games, and 38,648 minimum umpire assignments.
Calculated Team Entry Fee Methodology
Calculated Team Entry Fees are a research measure derived from publicly available USSSA information. Unless separately established by independent financial records, they are not verified collections, gross receipts, facility revenue, municipal revenue, director compensation, profit, taxable income, bank deposits, net proceeds, gate revenue, concession revenue, or audited financial statements.
Tournament, League & $0.00-Fee Activity
The report identifies 342 league teams with a publicly displayed League Team Entry Fee of $0.00. A $0.00 public fee field does not, by itself, establish that no operational or economic activity occurred. It may reflect a free event, league structure, missing historical information, or another circumstance that cannot be determined from the public dataset alone. Unsupported local fees are not imputed.
Geographic & Director Network
Geographic Reach
The direct stand-alone population is centered in Broken Arrow. The associated and combined populations extend across 9 municipalities and 3 counties. The largest municipality combinations displayed include Broken Arrow, Owasso, Tulsa ($116.87K) and Broken Arrow, Owasso, Sperry, Stillwater, Tulsa ($86.66K).
Director Concentration
The direct population is led by Travis Kelly. The associated multi-facility population is led by Rick Glasser. These are record-level concentrations of calculated activity and do not establish ownership, employment, revenue sharing, compensation, or contractual relationships.
Facility Images
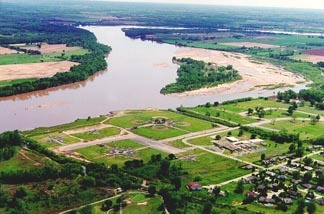

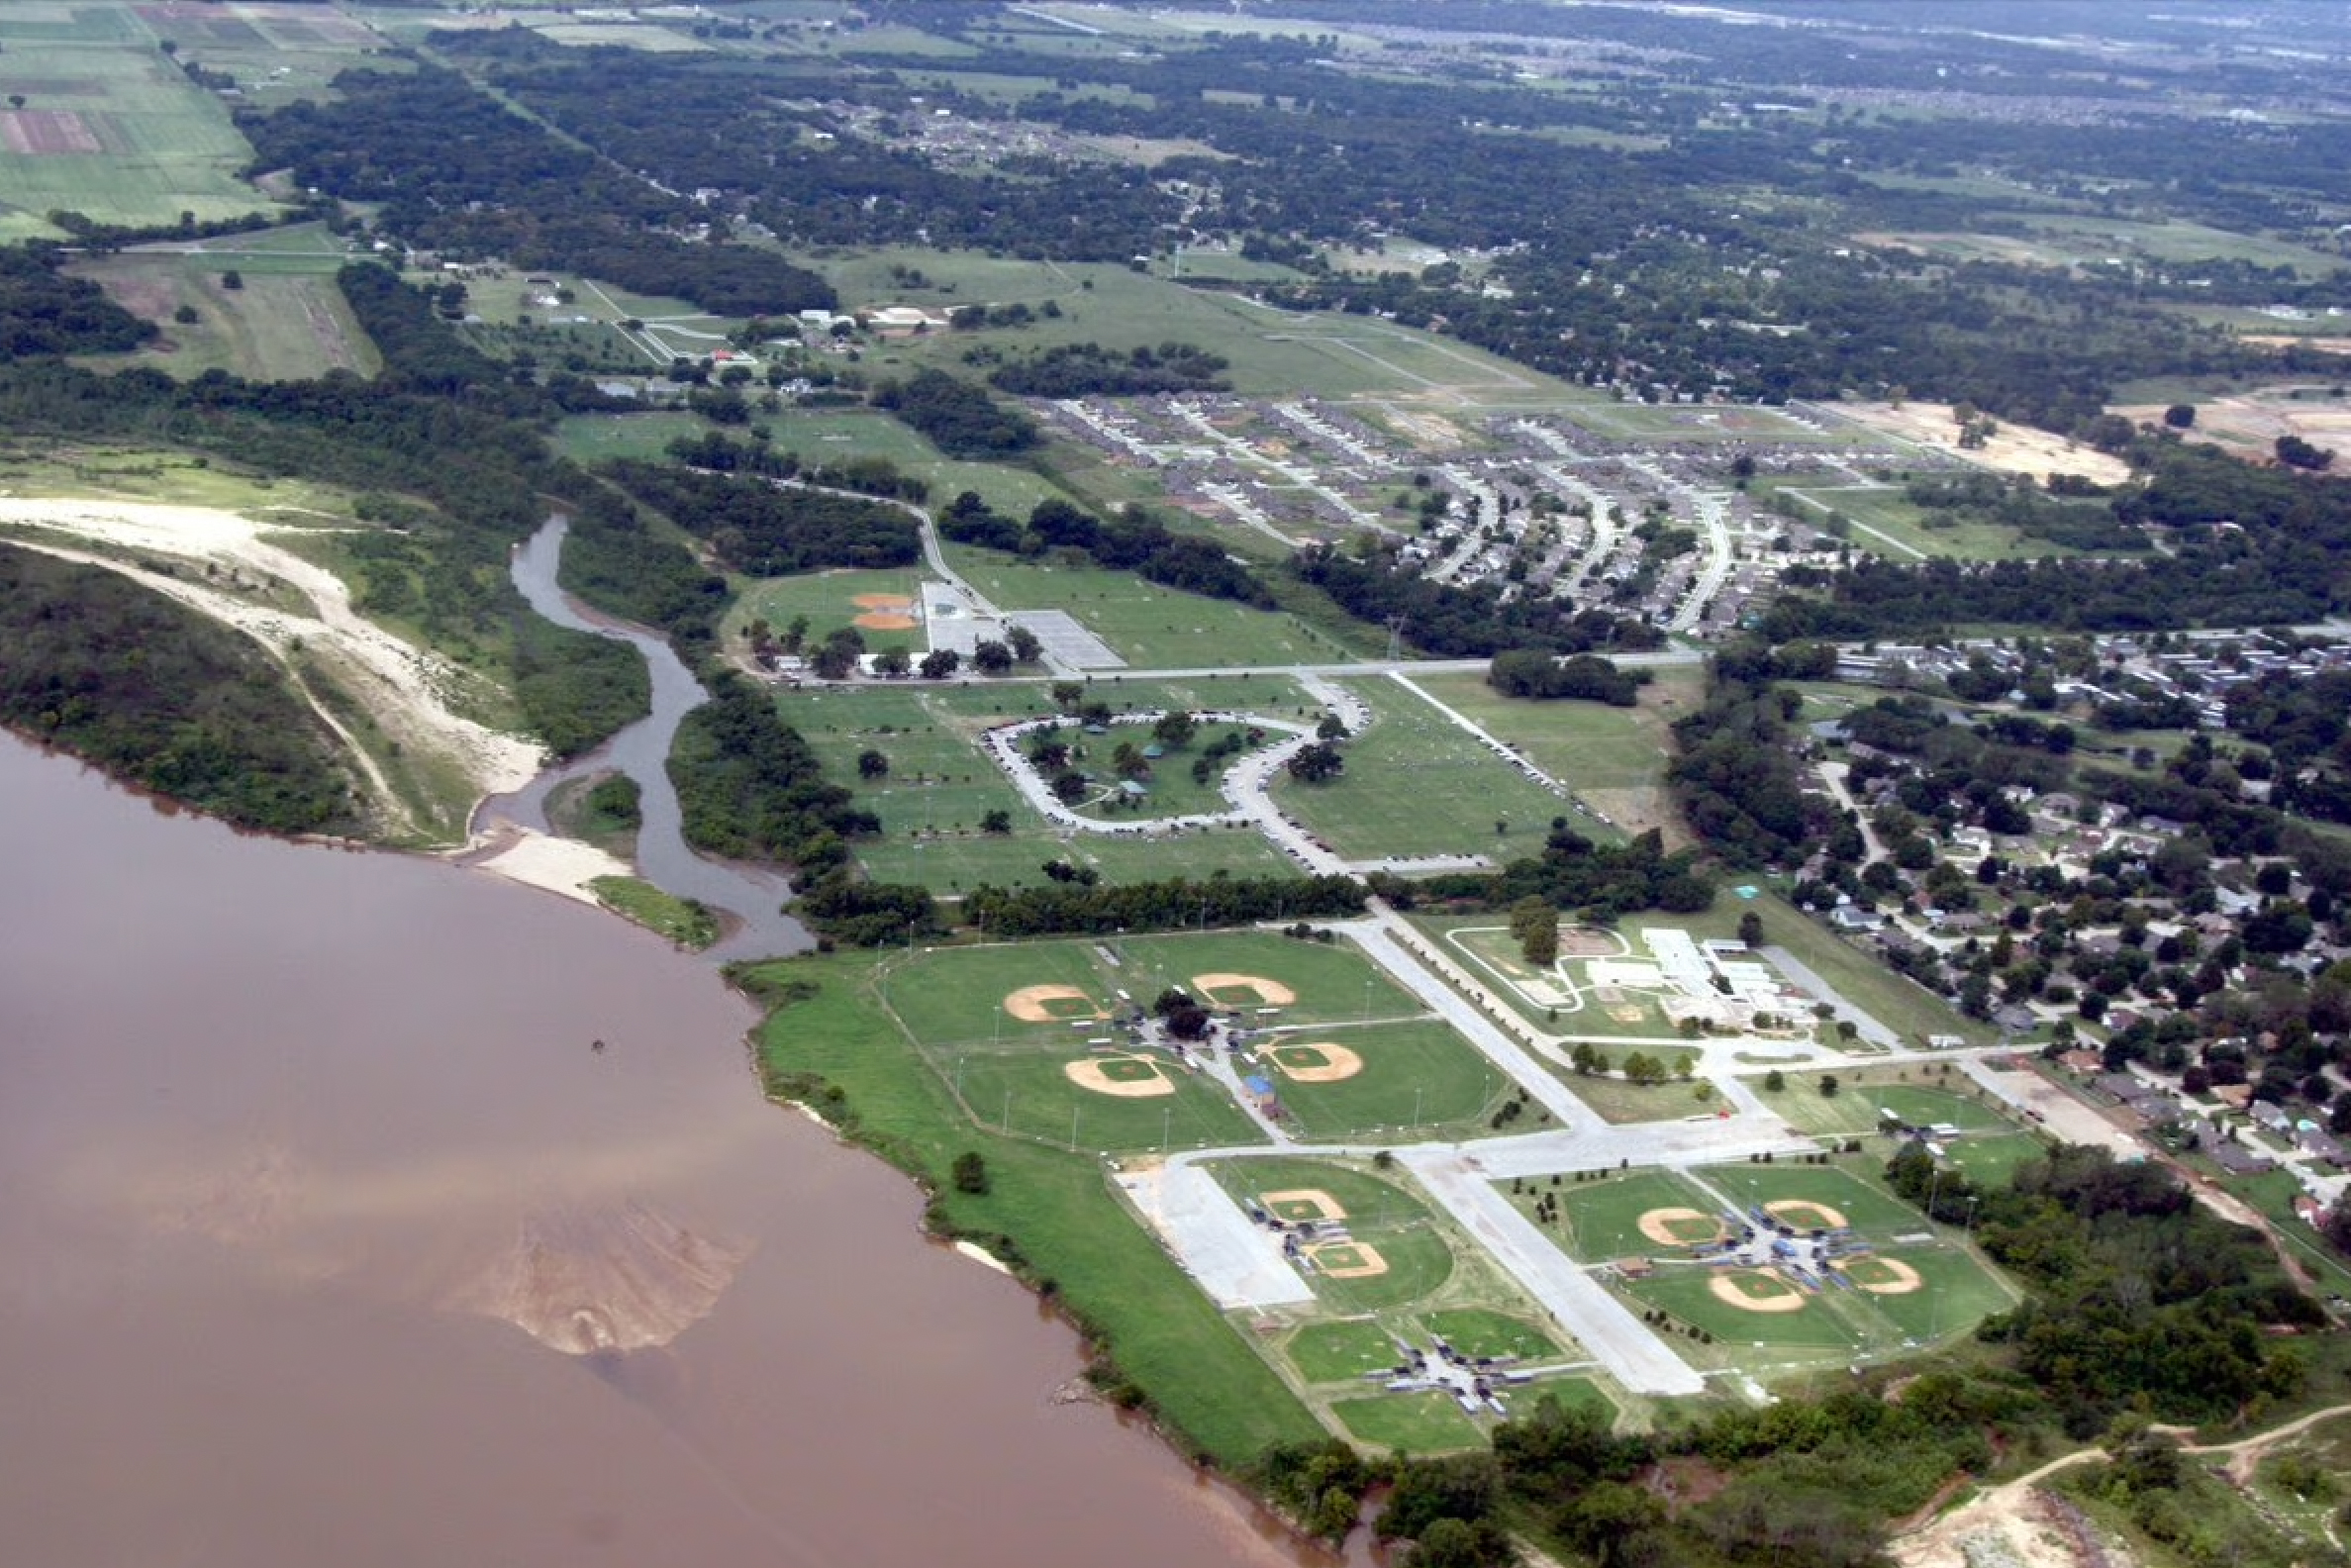
Report Image Gallery & Document Access
What This Profile Establishes - and What It Does Not
Established / Calculated by the Research Dataset
- Facility associations and facility combinations
- Teams, sports, displayed seasons and tournament / league classification
- Minimum games and minimum officials
- Tournament directors, municipalities and counties
- Publicly posted Team Entry Fees and Calculated Team Entry Fees
- Direct stand-alone, associated multi-facility and combined analytical populations
Not Established by the Dataset Alone
- Actual receipts, collections or bank deposits
- Facility or municipal revenue
- Director compensation, profit or taxable income
- Rental payments or revenue sharing
- Allocation of multi-facility proceeds
- Locally collected fees not shown in the public source
- Ultimate disposition of funds
Facility-Specific Research Summary
The Indian Springs Sports Complex report documents a substantial long-term baseball activity footprint. In the direct stand-alone population, the dataset identifies $1,682,451 in Calculated Team Entry Fees, all baseball, with 8,550 teams, 17,306 minimum games, 32,371 minimum umpire assignments, six directors, one municipality, and one county. The strongest direct director concentration is associated with Travis Kelly. The highest displayed season is 2021 at $158.96K.
Separately, associated multi-facility records add $459,787 in calculated activity across 14 facility combinations, 1,235 teams, 3,242 minimum games, 6,277 minimum umpire assignments, three directors, nine municipalities, and three counties. The broadest combined documented activity footprint totals $2,142,238 across 9,785 teams, 20,548 minimum games, 38,648 minimum umpire assignments, 15 facility/facility combinations, seven directors, nine municipalities, and three counties.
These figures should be read as analytical measures of publicly documented event participation and posted pricing. The report does not establish the allocation or ultimate disposition of event funds, and the multi-facility amounts should not be assigned in full to any individual location.
Research & Methodology Disclaimer
This page is an independent research and analytical publication prepared for research, education, transparency, and public-interest purposes. It is not an official USSSA report and is not represented as sponsored, endorsed, verified, or approved by USSSA, its directors, any governmental entity, municipality, tribe, school district, facility owner, director, or other organization appearing in the research.
Calculated financial figures are research estimates derived from publicly available information and the stated methodology. They are not audits, tax determinations, forensic-accounting conclusions, legal findings, or allegations that any person or organization received, retained, concealed, misreported, or improperly used the calculated amounts. Identification in the dataset does not itself imply wrongdoing, misconduct, tax noncompliance, criminal activity, or civil liability.
Historical source records may contain incomplete information, naming variations, reused or inconsistent identifiers, facility-name changes, zero-dollar listings, missing fields, or records later modified or removed. Separate facility reports should not simply be added together for statewide totals because multi-facility event records may appear in more than one facility profile; event-level deduplication is required.