
CVBA Mustang Baseball-Softball League 2022
Canadian Valley Baseball Association / Mustang Youth Sports
2022 Multi-Municipality Youth Baseball & Softball League Activity Profile — an original handwritten research analysis documenting the early methodology that later developed into the Hidden Valley — Integrity of the Game research architecture.
The preserved research identifies a regional operating footprint and an aggregate field-capacity model, but it does not establish a defensible game-by-game allocation among individual facilities.
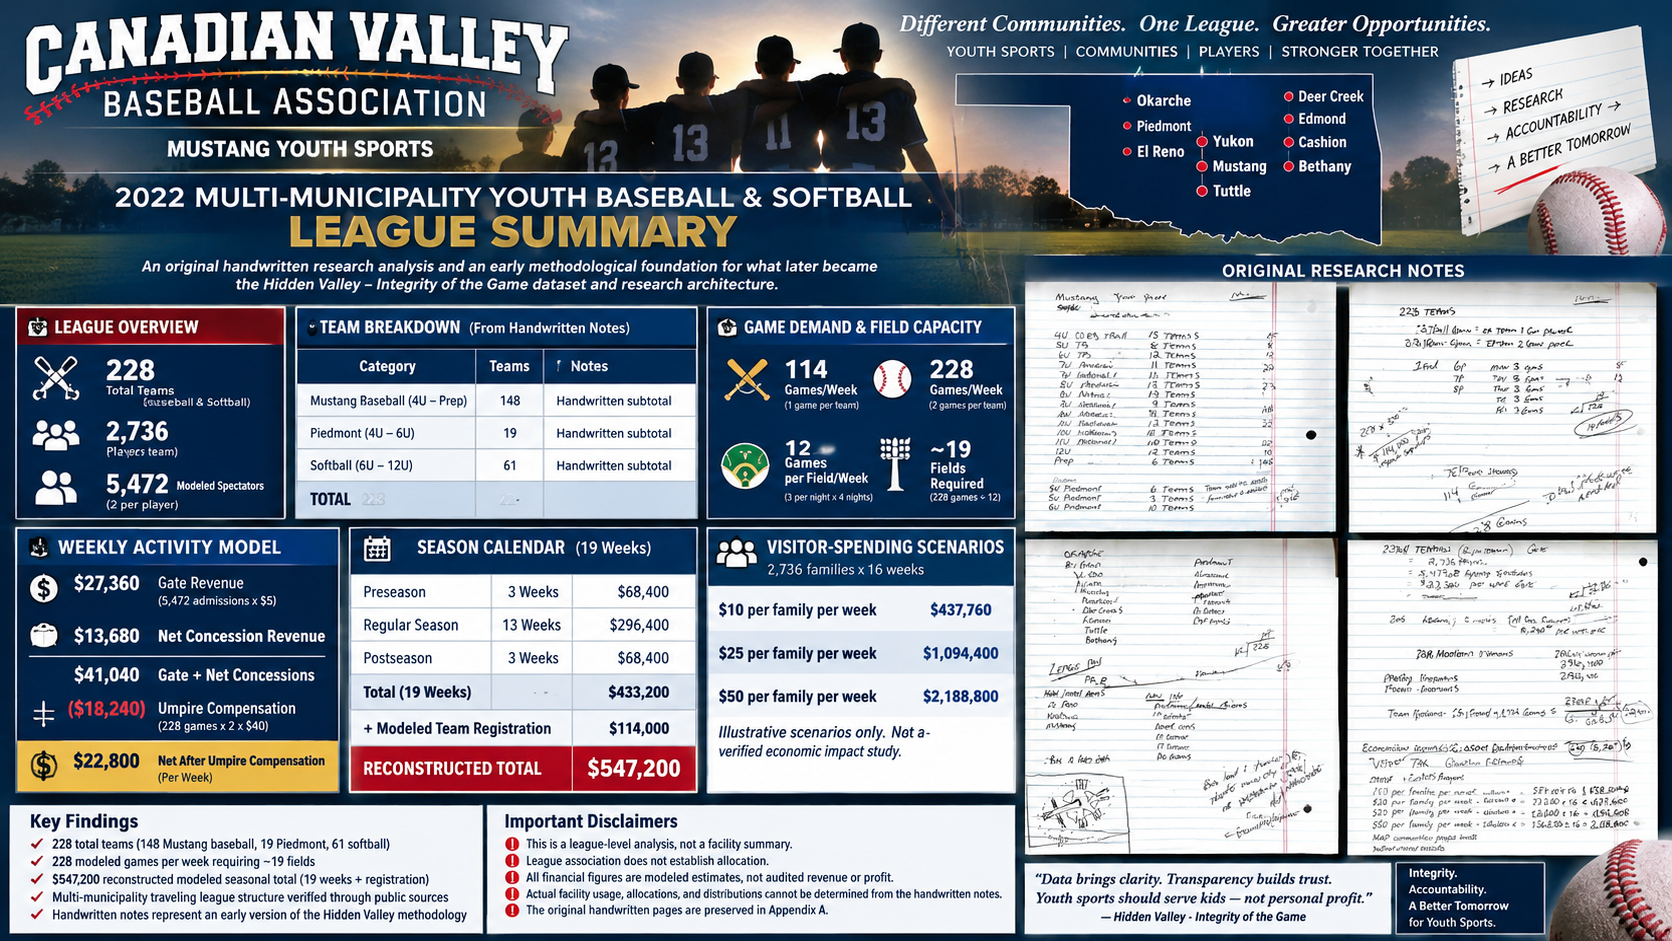
The handwritten beginning of the Hidden Valley methodology
The 2022 notebook predates the structured Hidden Valley — Integrity of the Game dataset. It begins with age-division team counts and manually converts participation into games, field demand, umpire assignments, registration activity, gate activity, net concession revenue, travel geography, and visitor-spending scenarios. The preserved notes are therefore part of the methodological history of the larger research project.
Why this is a league profile
The source material supports an aggregate league analysis. It identifies team counts, modeled games, field demand, officials, financial scenarios, and a regional geography.
League association is not facility allocation
Nothing in the preserved handwritten record establishes which exact games, gate receipts, concession activity, umpire assignments, or modeled financial amounts belong to any one park or municipality.
Aggregate research measures from the handwritten analysis
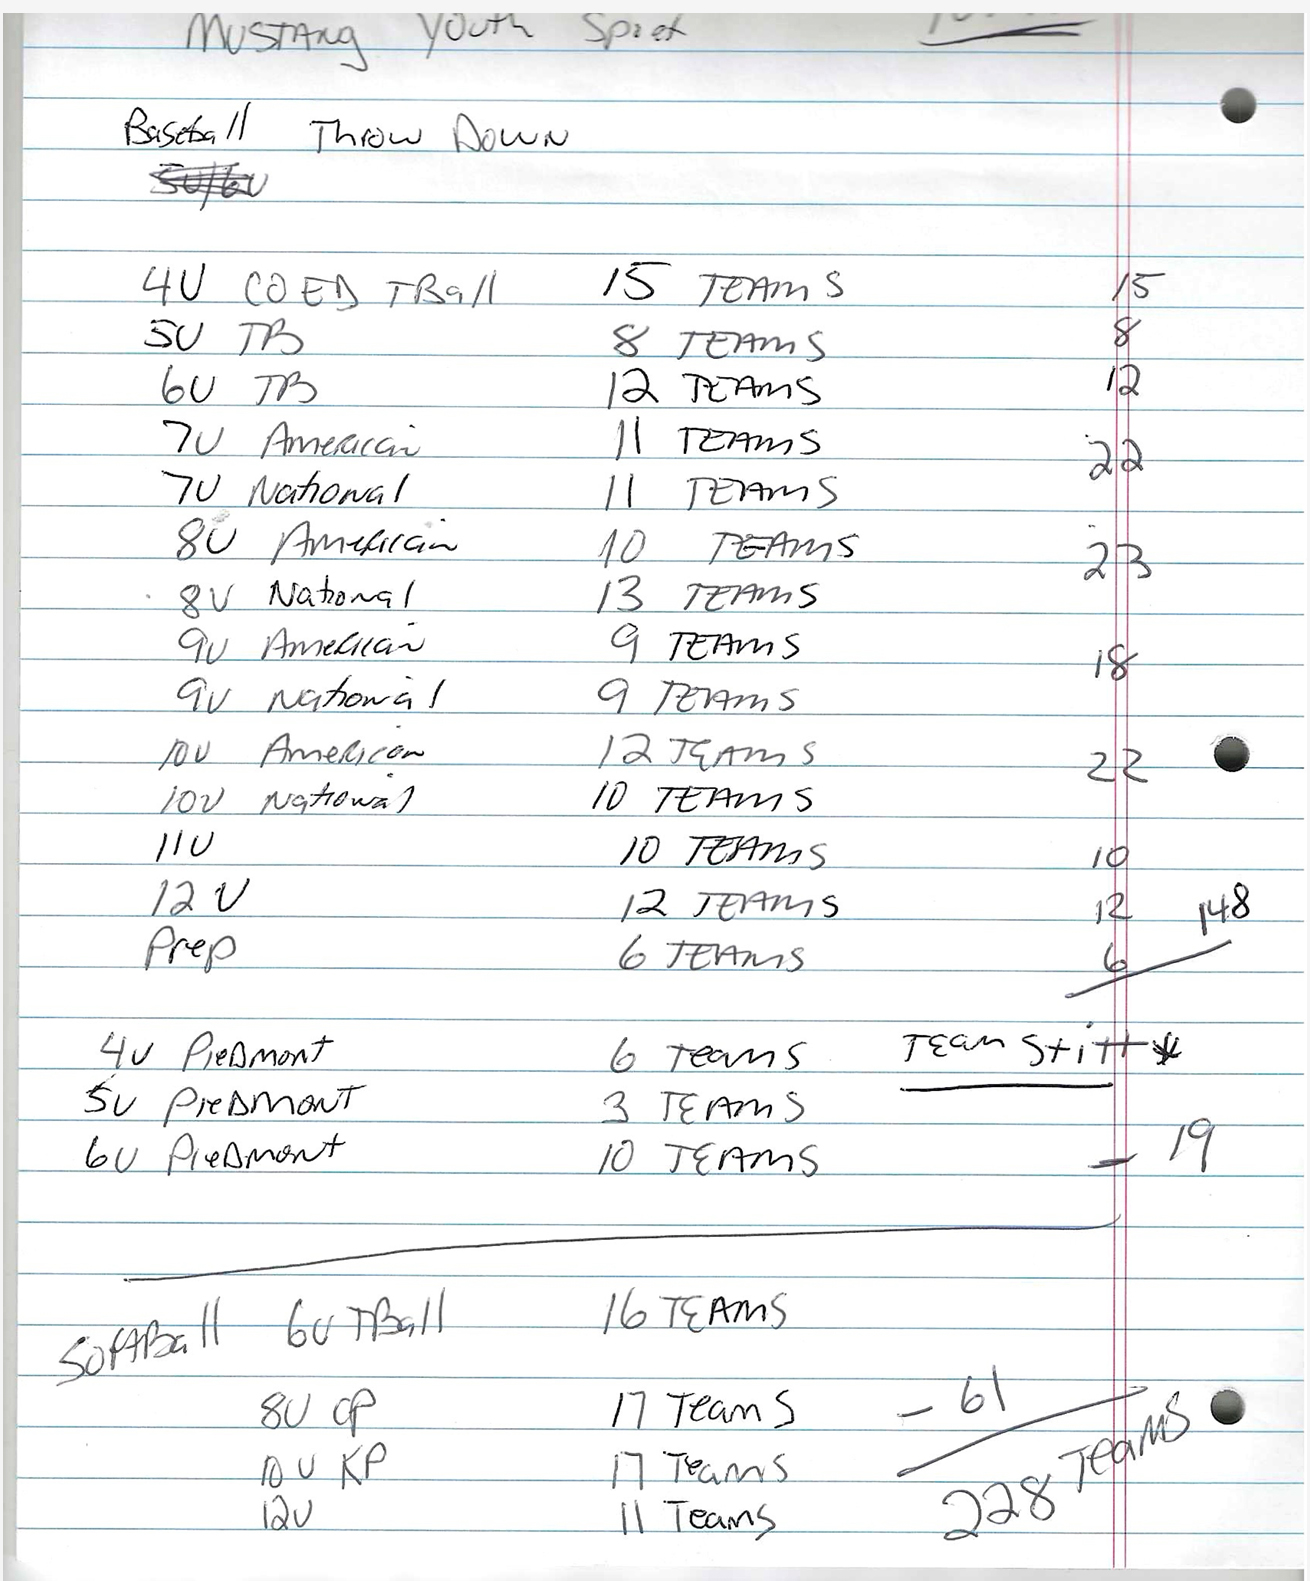
Division-level handwritten research reconciles to 228 teams
The preserved first page contains the original age-division team inventory. The later league summary classifies these as contemporaneous handwritten research rather than audited registration records.
| Research Component | Teams | Evidence Treatment |
|---|---|---|
| Mustang baseball — 4U through Prep | 148 | Original handwritten subtotal |
| Piedmont — 4U through 6U | 19 | Original handwritten subtotal |
| Softball — 6U through 12U | 61 | Original handwritten subtotal |
| Total research universe | 228 | 148 + 19 + 61 |
Game demand, field capacity and umpire workforce
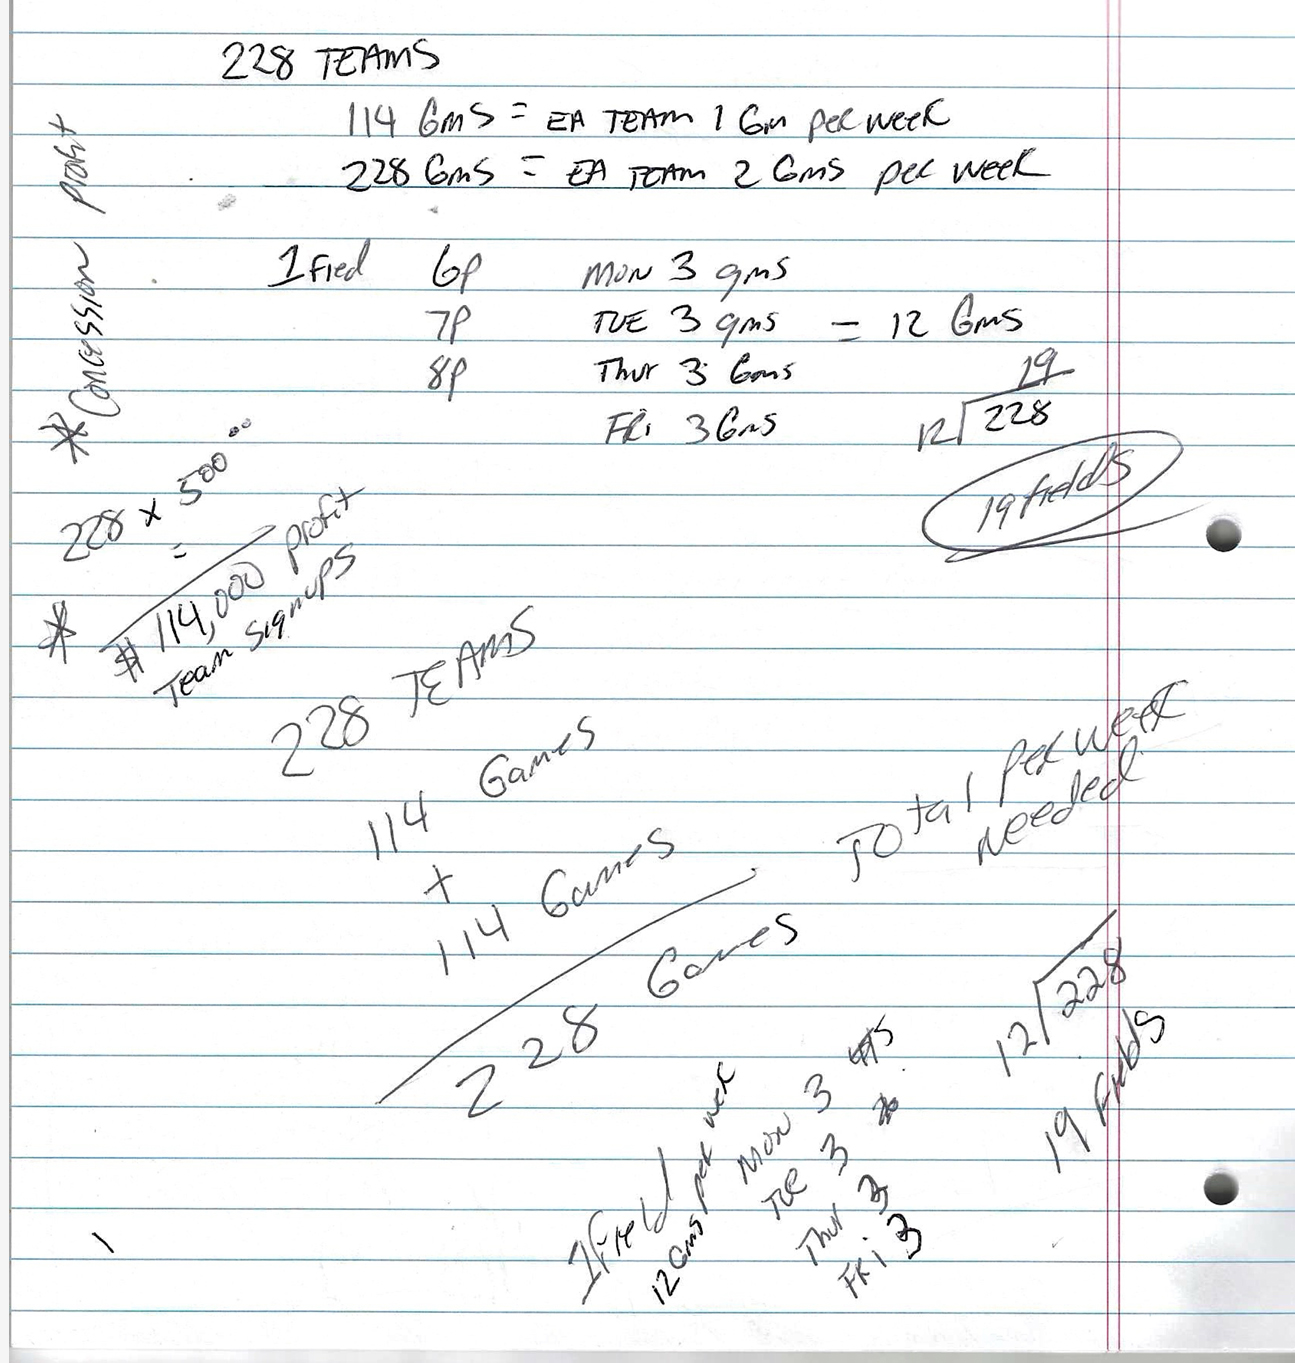
The second handwritten page converts teams into games and then into field capacity. One game per team produces 114 actual games. Two games per team produces 228 actual games per week. The working schedule assumes three games per field on four evenings, or 12 games per field per week, yielding an aggregate requirement of approximately 19 fields.
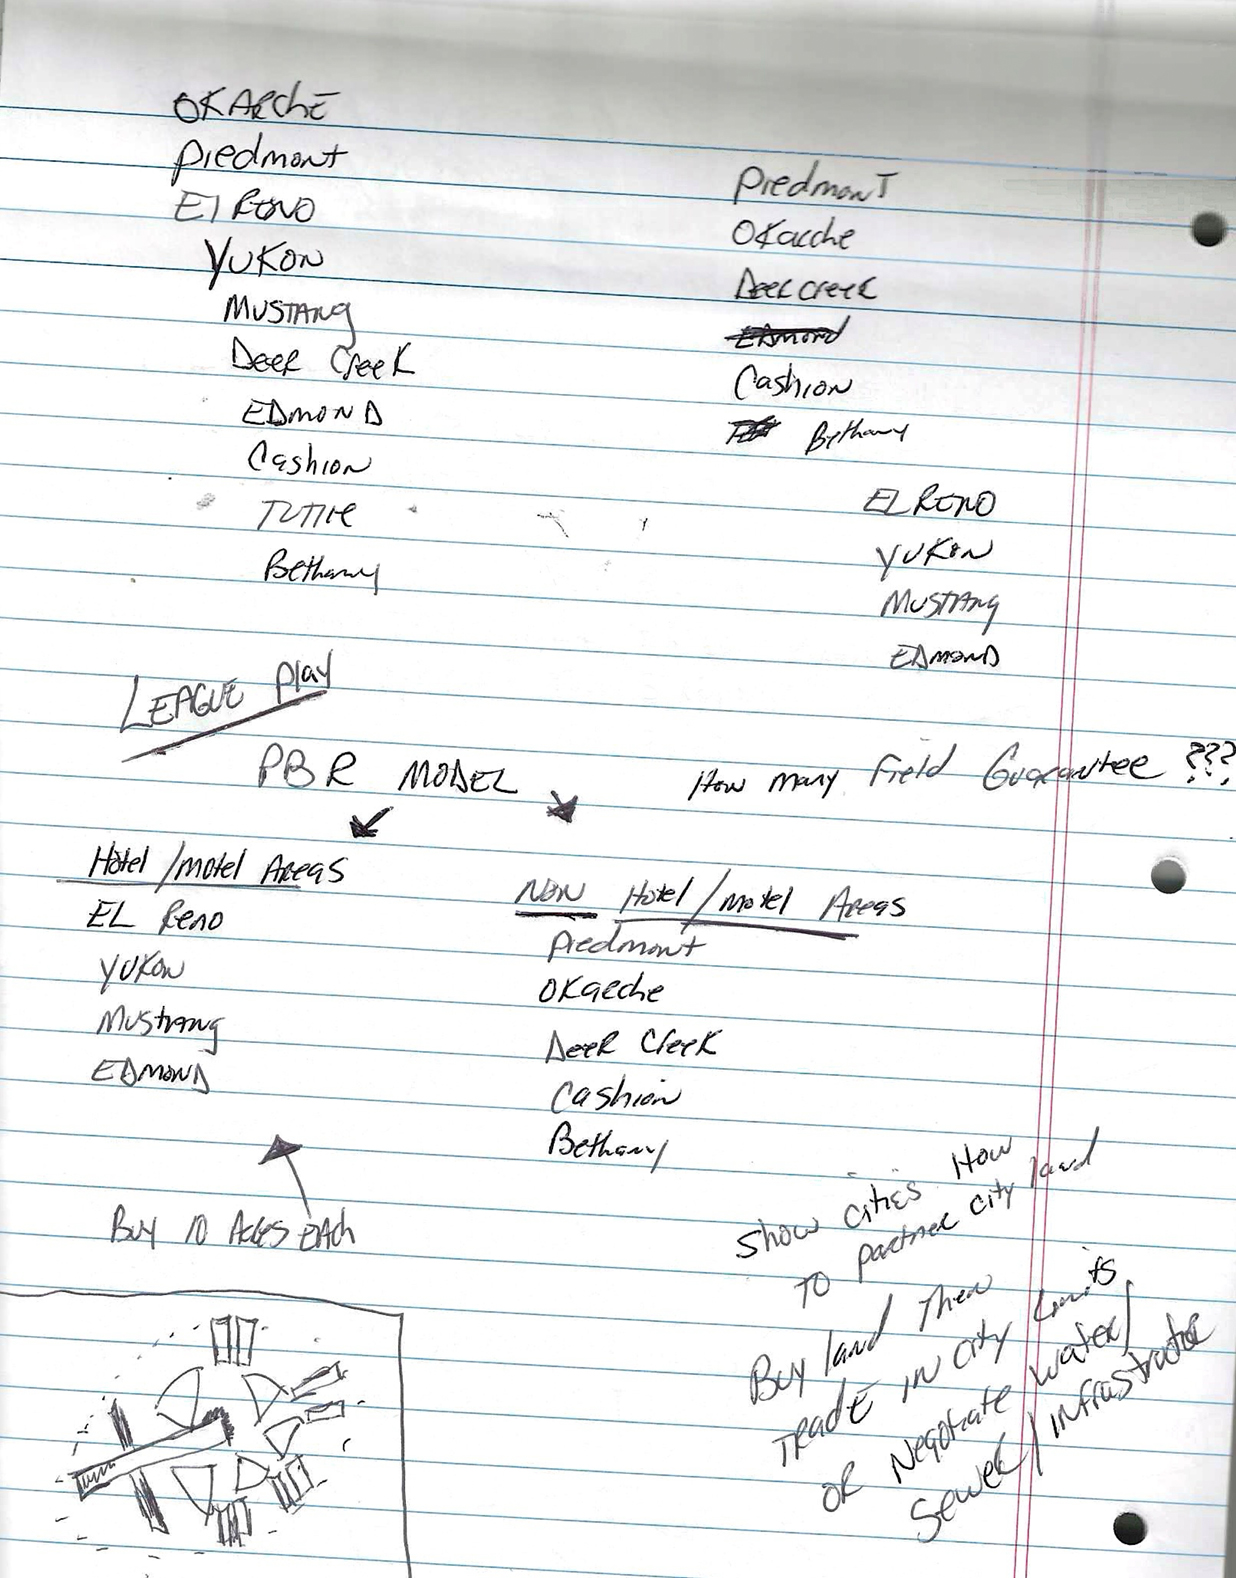
Multi-municipality travel geography
The handwritten geographic analysis lists a broad set of communities and separately considers hotel/motel markets. These places are presented here as locations associated with the research universe and travel model — not as a verified allocation of league games.
The accompanying executive summary notes later public corroboration of a multi-community Canadian Valley baseball structure. This landing page does not use that later corroboration to retroactively assign the 2022 league totals among individual facilities.
Weekly operating model
The handwritten calculations are presented as a reconstructed league-level model. They are not, by themselves, proof of actual collections, deposits, municipal revenue, user-group income, audited profit, or facility-specific receipts.
| Weekly Component | Calculation | Amount | Evidence Treatment |
|---|---|---|---|
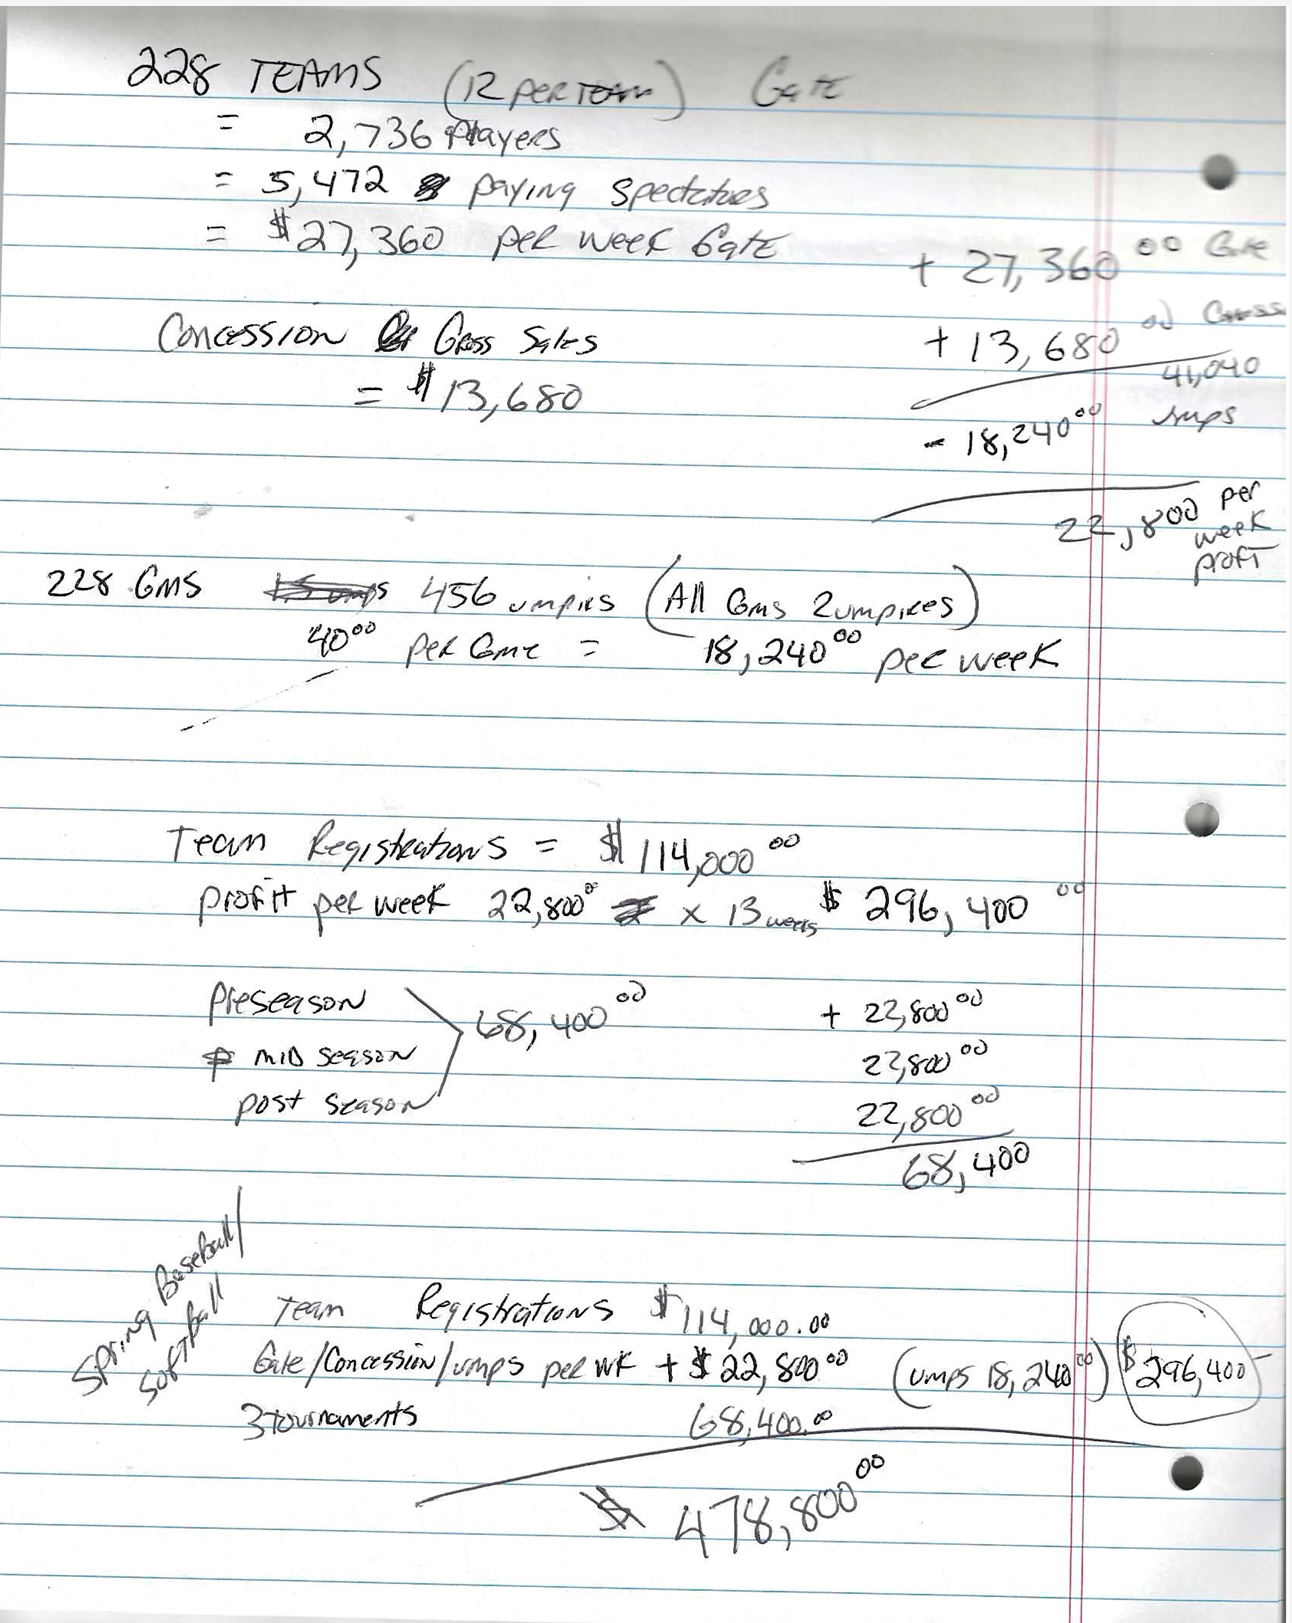
| Gate activity | 5,472 modeled admissions × $5 | $27,360 | Modeled |
| Net concession revenue | Original figure; later clarified as net | $13,680 | Original + researcher clarification |
| Gate + net concessions | $27,360 + $13,680 | $41,040 | Derived |
| Umpire compensation | 228 games × 2 umpires × $40 | ($18,240) | Derived |
| Net after umpire compensation | $41,040 − $18,240 | $22,800 | Derived operating model; not audited profit |
3-week preseason + 13-week regular season + 3-week postseason
The historical operating calendar has been clarified as three distinct competition periods, producing a 19-week league cycle.
| Competition Period | Weeks | Modeled Amount at $22,800 / Week |
|---|---|---|
| Preseason | 3 | $68,400 |
| Regular season | 13 | $296,400 |
| Postseason | 3 | $68,400 |
| Complete competition cycle | 19 | $433,200 |
| Plus modeled team registration | — | $114,000 |
| Reconstructed league model | — | $547,200 |
$547,200 is a reconstructed historical league model, not audited net income. The handwritten source does not establish every possible operating expense or the actual disposition of funds.
Visitor-spending scenarios from the original notebook
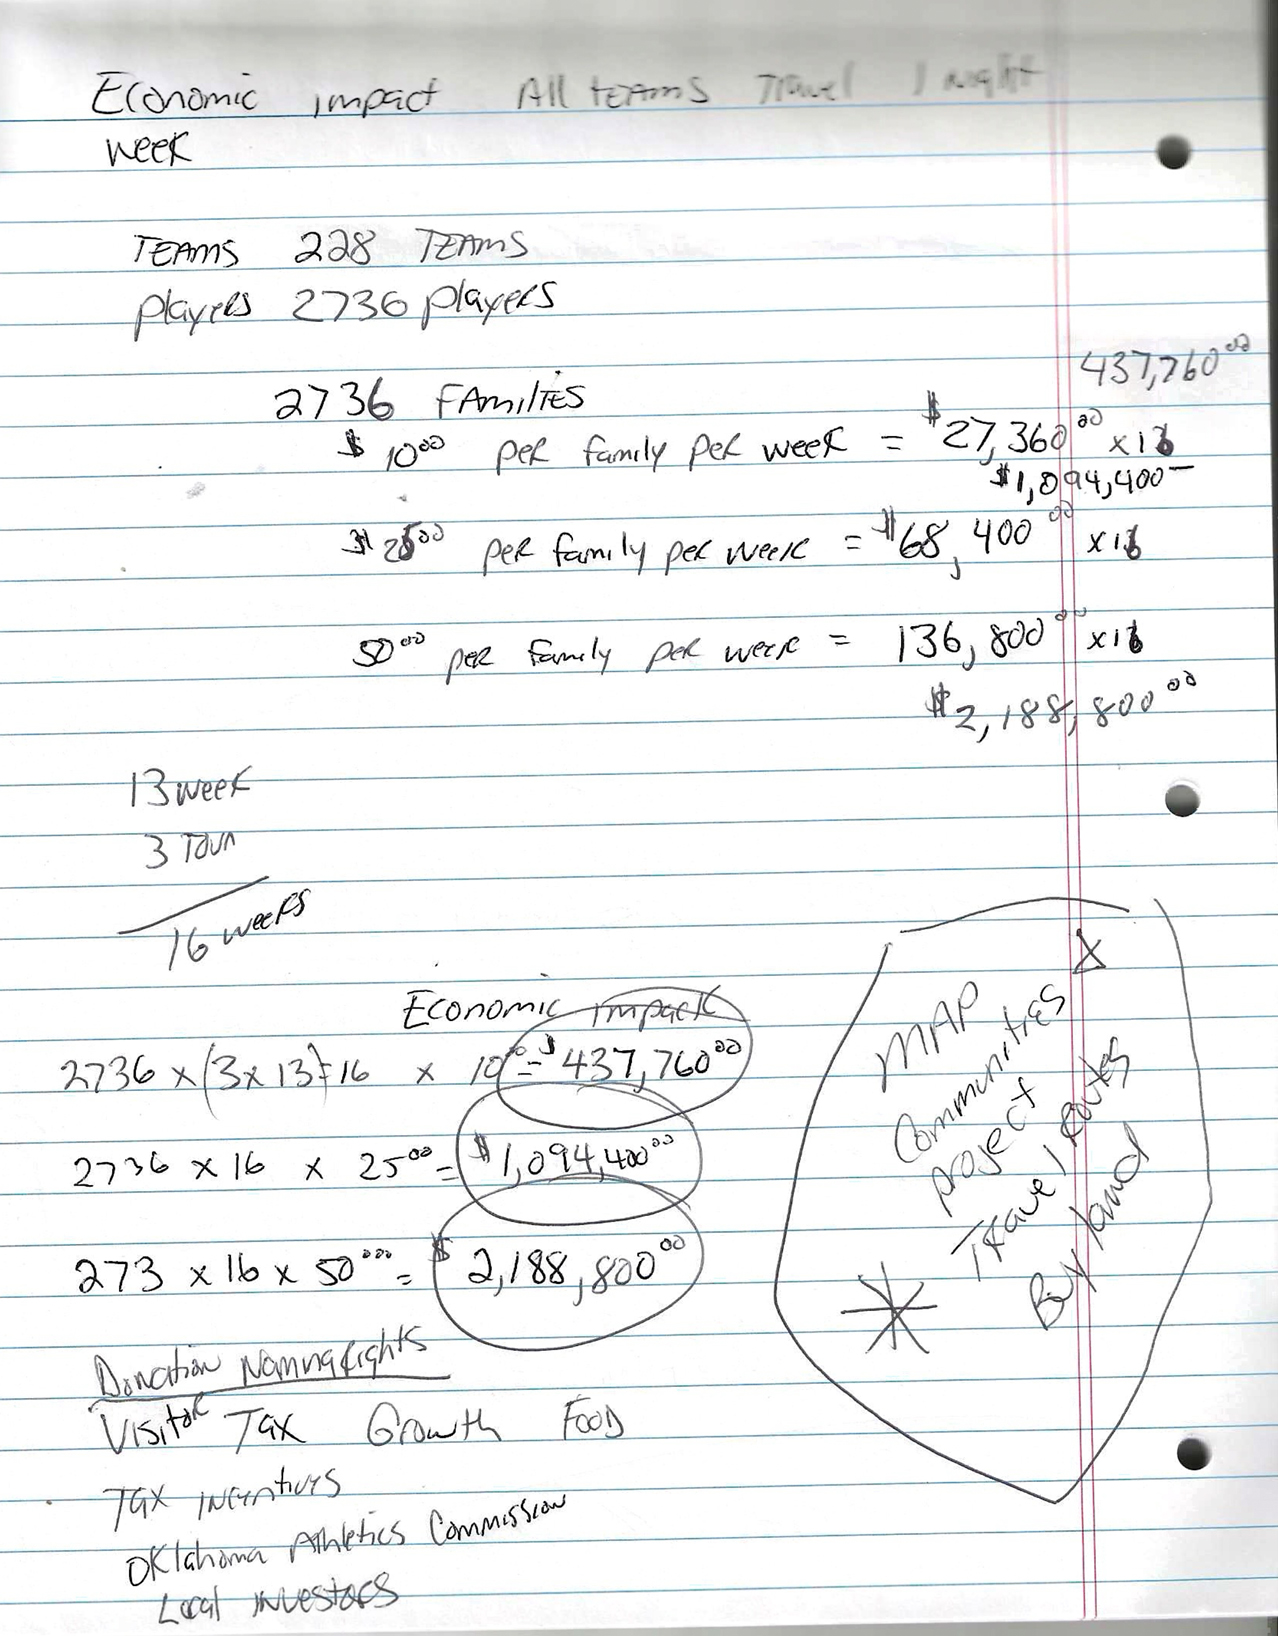
The fifth handwritten page tests regional spending assumptions using the modeled participant population. Under the modern Hidden Valley methodology, these are best described as illustrative visitor-spending scenarios — not a verified economic-impact study.
Economic-impact limitation
The preserved notes do not establish unique traveling households, hotel-night counts, taxable sales, displacement effects, visitor surveys, or a formal multiplier methodology. These values therefore remain illustrative scenarios rather than verified economic impact.
Original handwritten 2022 research notes
The five handwritten pages are preserved as historical source material. They are presented without rewriting or replacing the original notation.
What the league profile establishes — and what it does not
Supported by the preserved research
- A contemporaneous handwritten 228-team research census.
- Division-level handwritten subtotals for Mustang baseball, Piedmont youth divisions and softball.
- Modeled game demand based on one- and two-game-per-team assumptions.
- An aggregate field-capacity model of approximately 19 fields.
- Modeled umpire assignments and compensation.
- Modeled registration, gate and net-concession activity.
- A clarified 19-week competition cycle.
- A multi-community travel geography and visitor-spending inquiry.
Not established by the preserved research alone
- Exact 2022 game-by-game facility assignments.
- The percentage of games played in Mustang, Yukon, Piedmont, El Reno or another city.
- Facility-specific gate, concession or umpire allocations.
- Actual receipts, deposits, bank ownership or final disposition of funds.
- Audited profit, taxable income, municipal revenue or user-group income.
- Verified economic impact using hotel-night, tax, survey or multiplier data.
- Wrongdoing, liability or noncompliance by any organization or person.
Open the underlying research and analytical summaries
CVBA Mustang 2022 League Summary
A concise league-focused analytical report that deliberately avoids unsupported facility allocation and applies the Hidden Valley principle that league association is not facility allocation.
Open PDFCVBA Mustang 2022 Hidden Valley Executive Summary
An in-depth reconstruction of the handwritten methodology, financial and operating model, evidentiary classifications, and its relationship to the later Hidden Valley research architecture.
Open PDFYukon-Mustang League 2022 Handwritten Research
The original five-page handwritten working document preserved as the historical source record.
Open PDFFrom manual notebook to structured Hidden Valley research
The 2022 notes show the early form of variables that later became formalized in the Hidden Valley — Integrity of the Game research architecture. The major methodological evolution is evidentiary discipline: documenting source provenance and separating observed facts from derived calculations, modeled assumptions and unknown allocation.
| 2022 Handwritten Approach | Later Hidden Valley Development |
|---|---|
| Division team counts | Structured division-level datasets |
| Teams converted to games | Modeled minimum-game demand |
| Games converted to fields | Facility and multi-site activity analysis |
| Umpire slots × rate | Modeled assignment volume and compensation |
| Registration estimate | Structured fee and participation research |
| Gate estimate | Event-gate modeling |
| Net concession estimate | Ancillary-revenue and public-facility questions |
| City / hotel lists | Multi-jurisdiction sports-tourism analysis |
| Manual spending scenarios | Separation of modeled activity from verified economic evidence |
| Hand calculations | Auditable formulas, source classifications, reports, dashboards and preserved exhibits |
League-level conclusion
The defensible unit of analysis for this 2022 material is the league, not a single facility. The preserved research supports describing a 228-team, multi-municipality youth baseball and softball league model with substantial weekly game demand, aggregate field-capacity requirements, officiating labor, modeled registration and spectator activity, and regional travel implications. It does not support assigning those league totals to Mustang, Yukon, Piedmont, El Reno, or a particular park without additional primary records.
Records needed for future facility-level allocation
2022 schedules with field assignments, game calendars, tournament brackets, municipal field-use schedules, user-group agreements, umpire assignment sheets, gate/concession settlement records, invoices, or other documents connecting specific league activity to specific locations.
Research, education, transparency and public-interest analysis
This page is an independent research and analytical publication. It is not an official report of the Canadian Valley Baseball Association, Mustang Youth Sports, USSSA, any municipality, school district, facility owner, league participant, director, governmental entity, or other organization referenced in the research.
Handwritten and reconstructed financial figures are research estimates and analytical models unless a primary record independently establishes otherwise. They are not audits, tax determinations, forensic-accounting conclusions, legal findings, allegations, or proof of actual collections, income, profits, compensation, taxable income, bank deposits, municipal revenue, facility revenue, or the ultimate disposition of funds.
The identification of an organization, municipality, facility, league, user group, official, or other party does not itself imply wrongdoing, misconduct, tax noncompliance, civil liability, or criminal activity. The historical handwritten notes are preserved as part of the research archive and should be interpreted with the evidentiary distinctions explained in the accompanying summaries.