
Sand Springs Sports Facilities
Oklahoma USSSA Facility Activity Profile | 2001–2026
Independent research organizing publicly available USSSA baseball and softball information into direct, associated multi-facility, and combined documented activity.
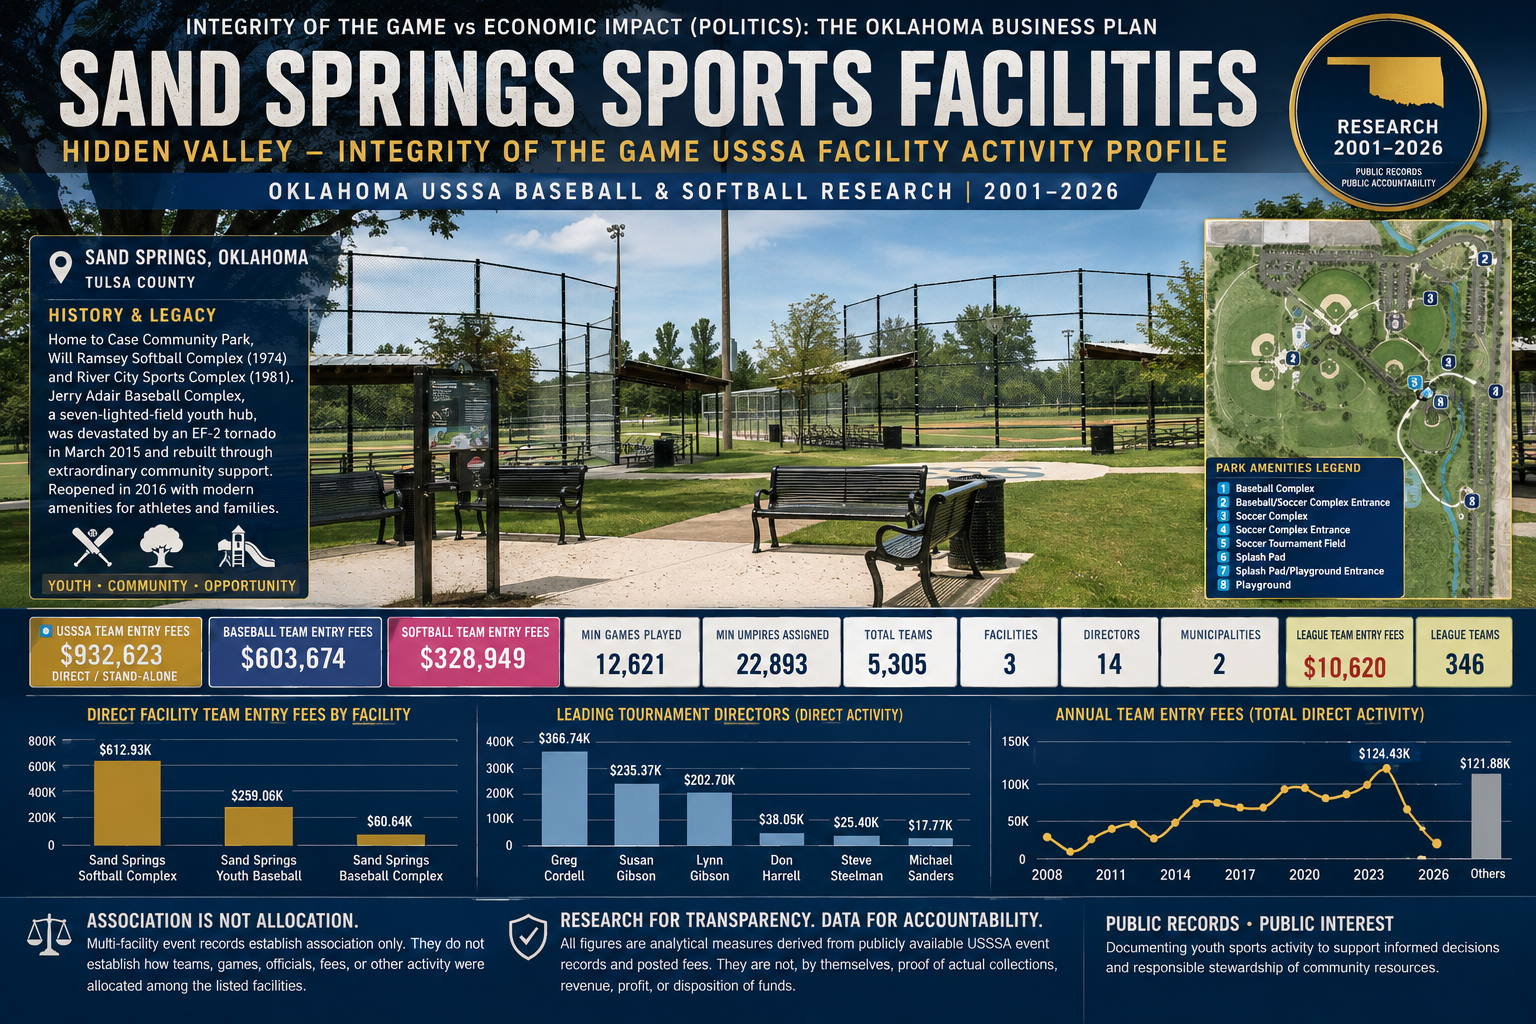
Direct / Stand-Alone Activity
Pages 1–2 represent records listing the Sand Springs primary-facility group independently and exclude multi-facility combinations. Calculated Team Entry Fees are analytical measurements, not verified revenue or income.
Direct Facility, Municipality & Director Activity
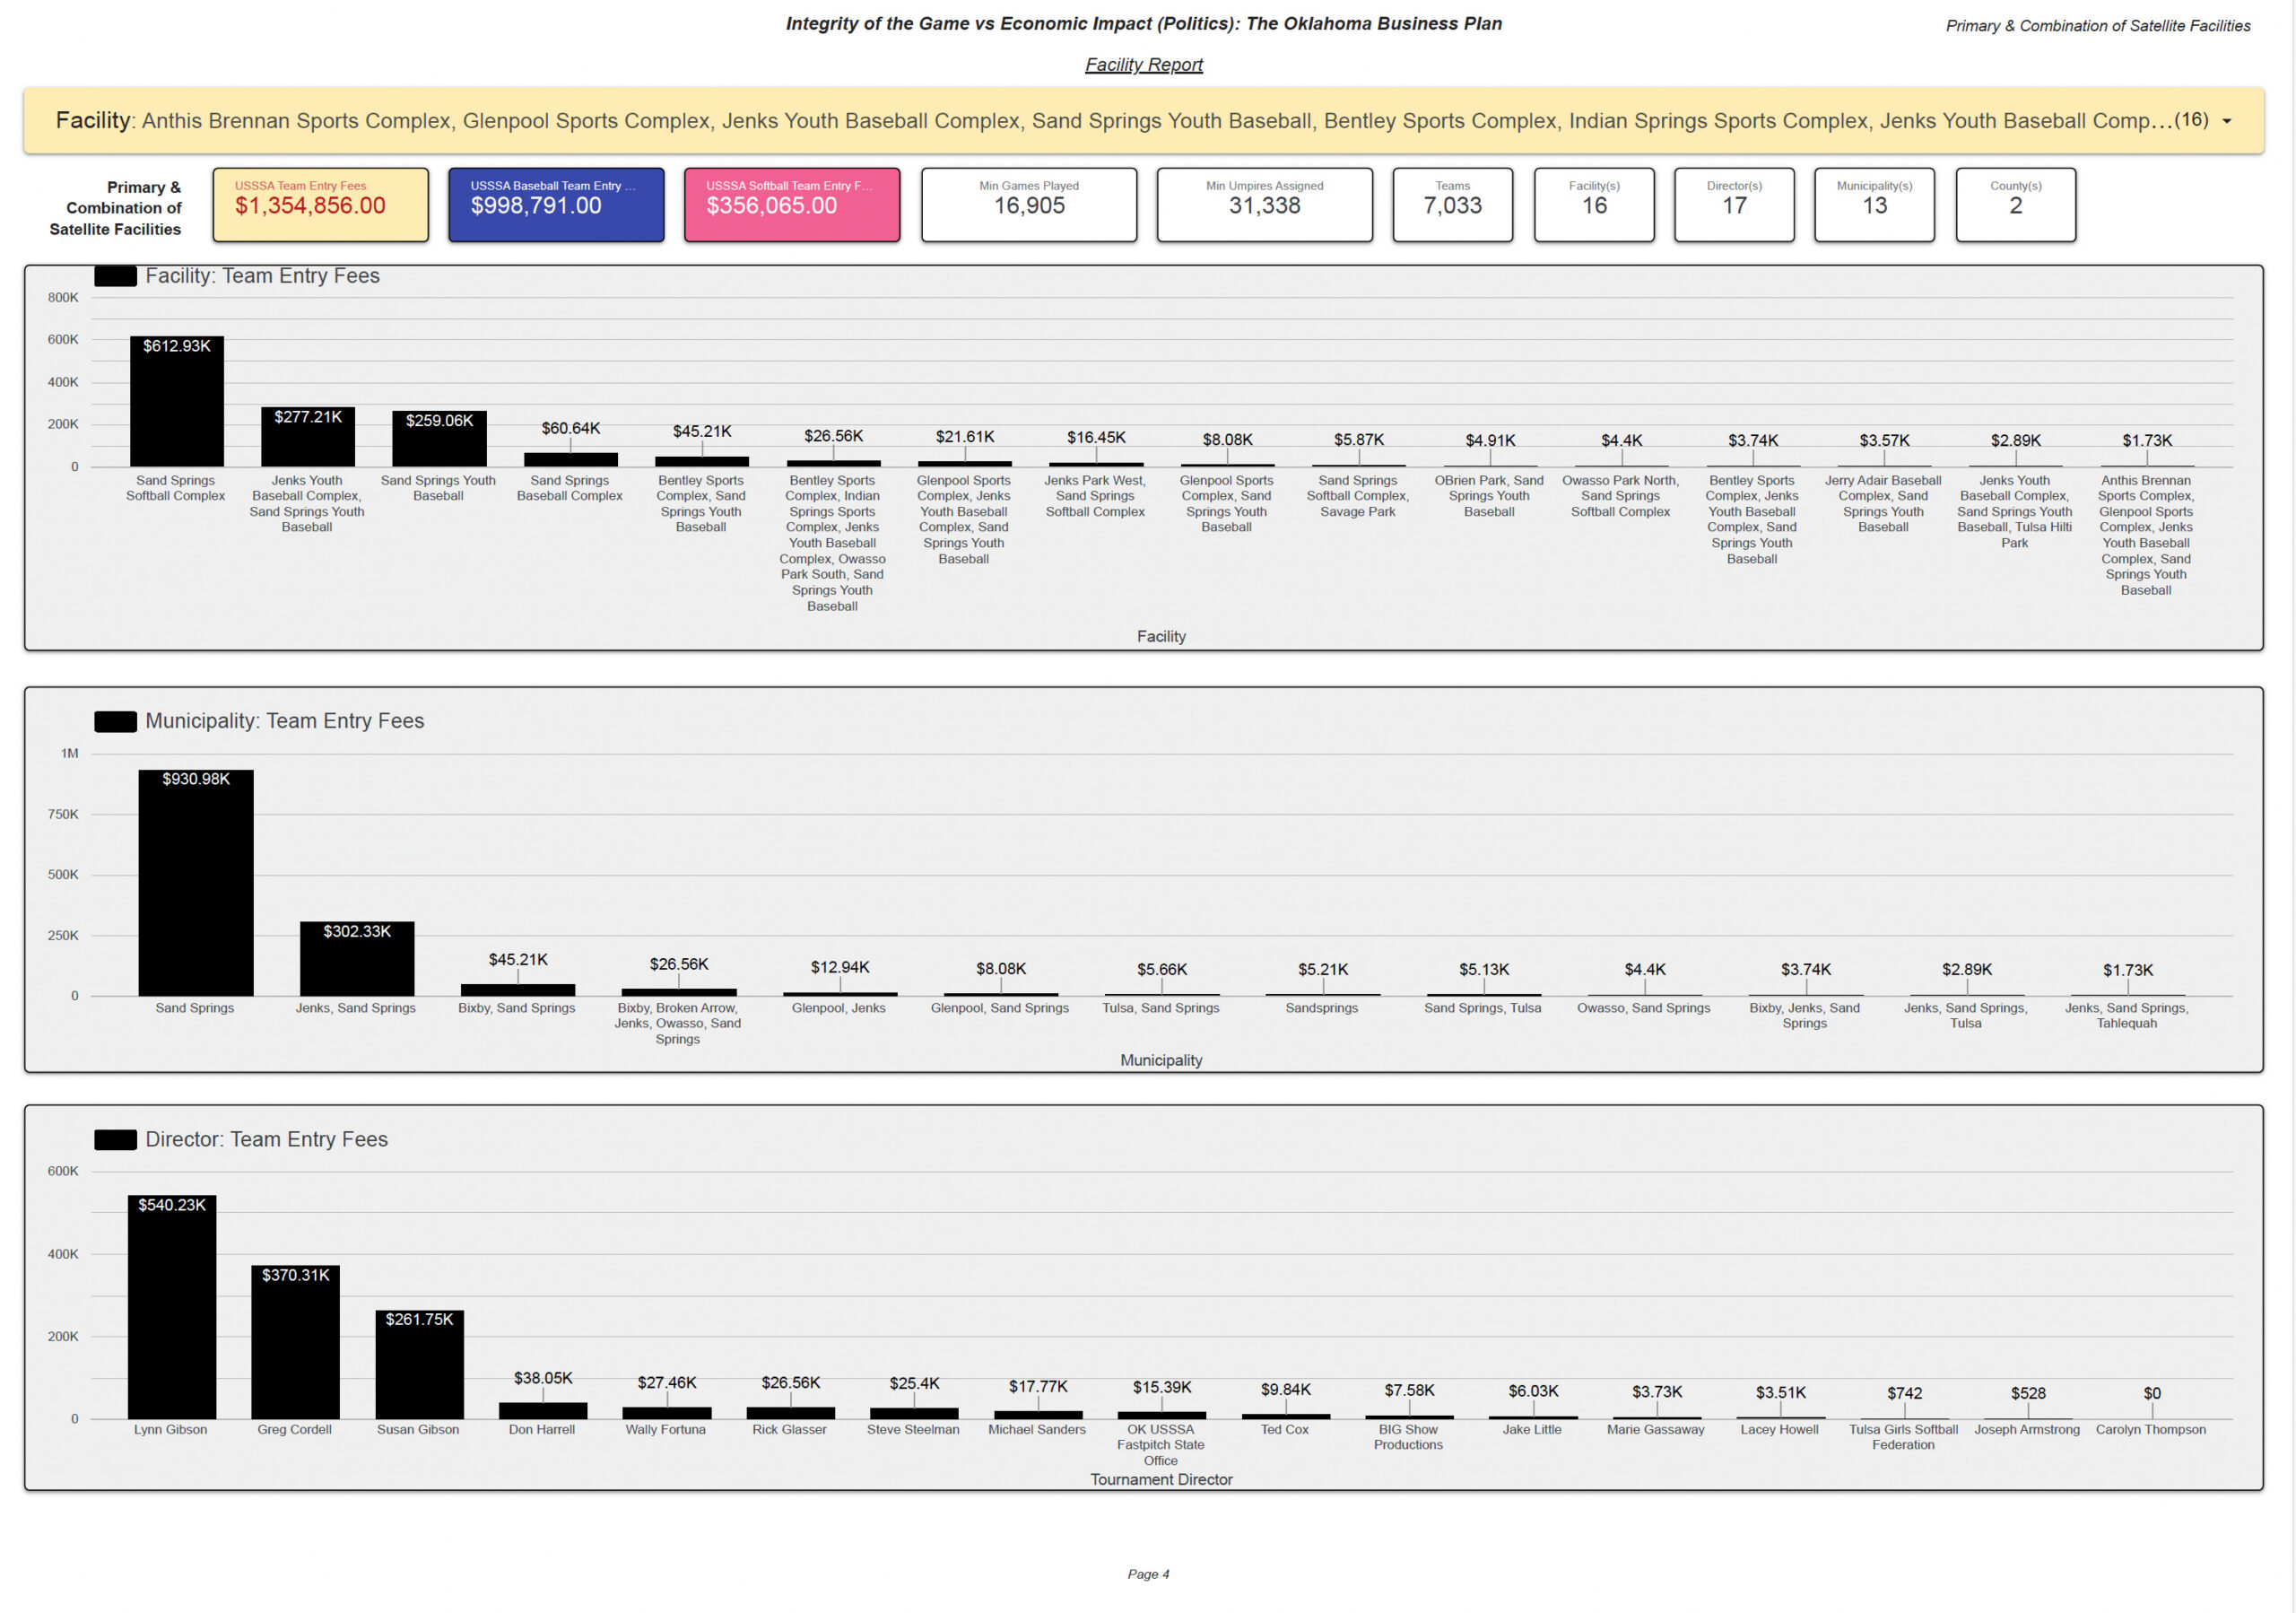
The report identifies Sand Springs Softball Complex — $612.93K, Sand Springs Youth Baseball — $259.06K, and Sand Springs Baseball Complex — $60.64K. Municipality activity is Sand Springs — $927.41K plus a separate “Sandsprings” — $5.21K naming variation.
Leading direct director concentrations are Greg Cordell — $366.74K, Susan Gibson — $235.37K, and Lynn Gibson — $202.70K.
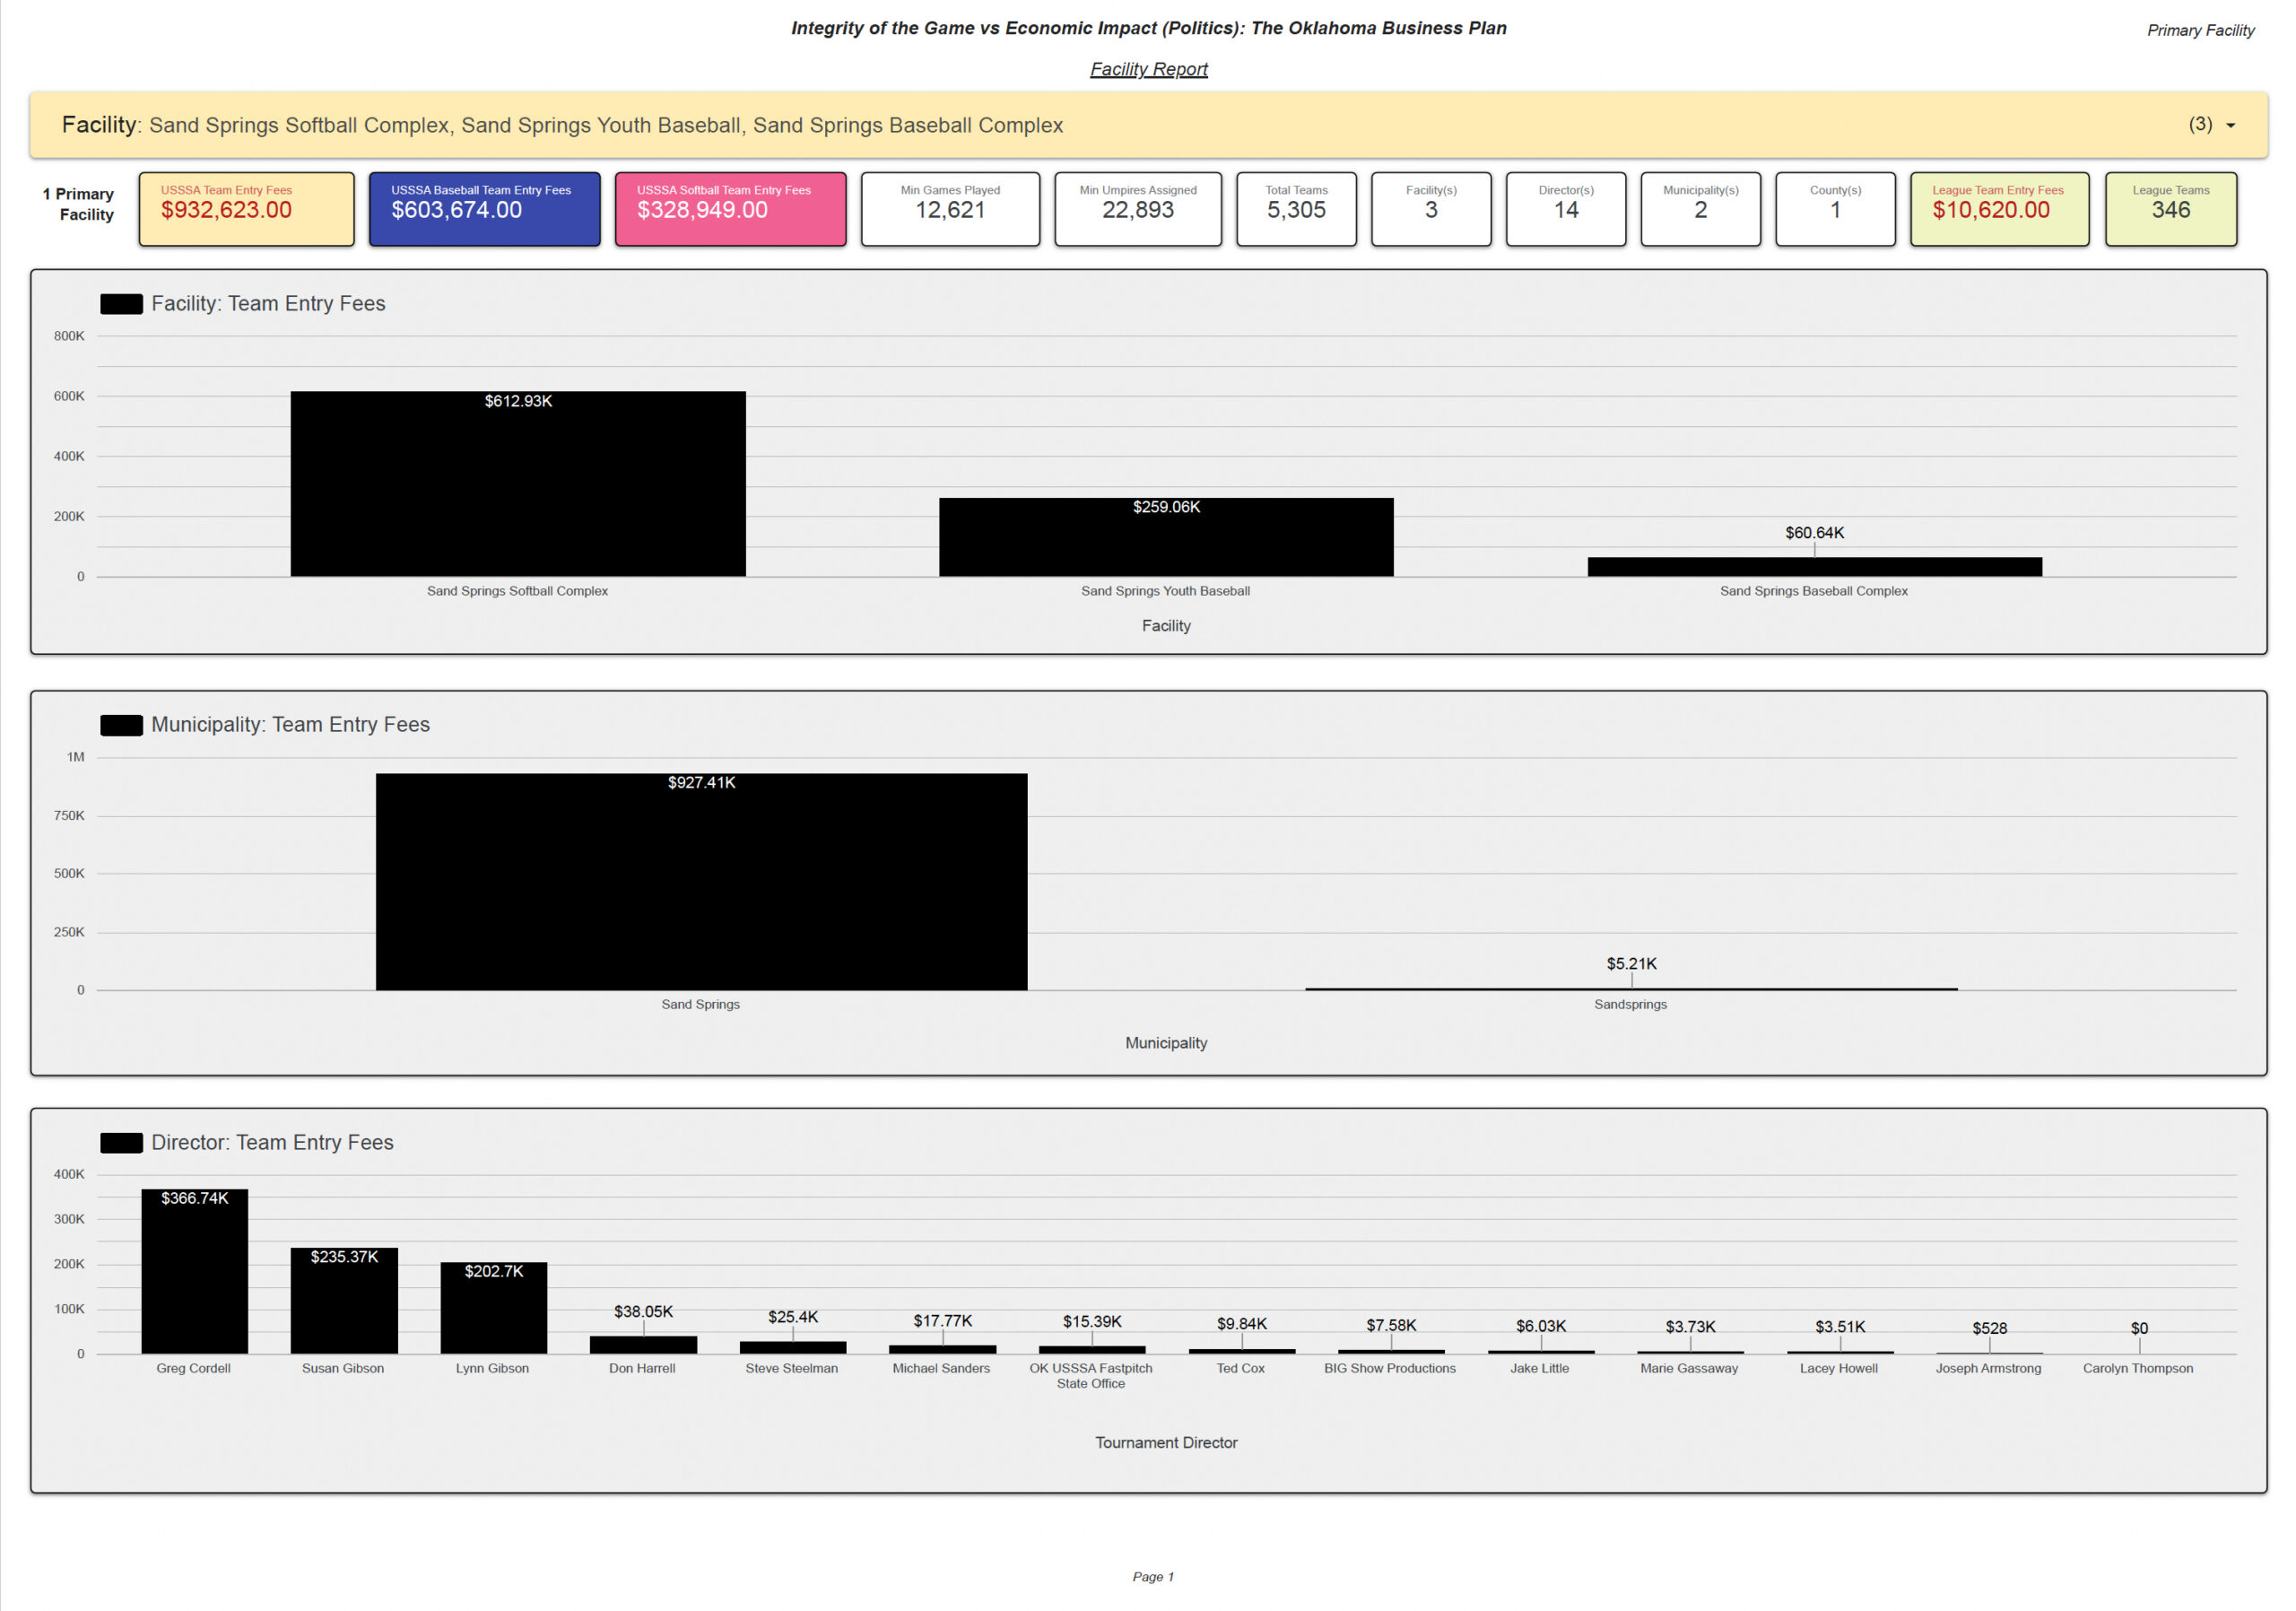
Annual & Sport Trends
The highest displayed annual total is 2023 — $124.43K. Baseball peaks in 2024 — $66.39K; softball peaks in 2022 — $79.70K. The report preserves an “Others” — $121.88K category in total/baseball activity.
Displayed annual totals: 2026 $6.38K; 2025 $63.50K; 2024 $90.30K; 2023 $124.43K; 2022 $97.20K; 2021 $69.48K; 2020 $23.12K; 2019 $8.93K; 2018 $33.50K; 2017 $29.10K; 2016 $35.92K; 2015 $11.66K; 2014 $49.31K; 2013 $44.37K; 2012 $24.41K; 2011 $16.76K; 2010 $25.18K; 2009 $19.40K; 2008 $37.79K; Others $121.88K.
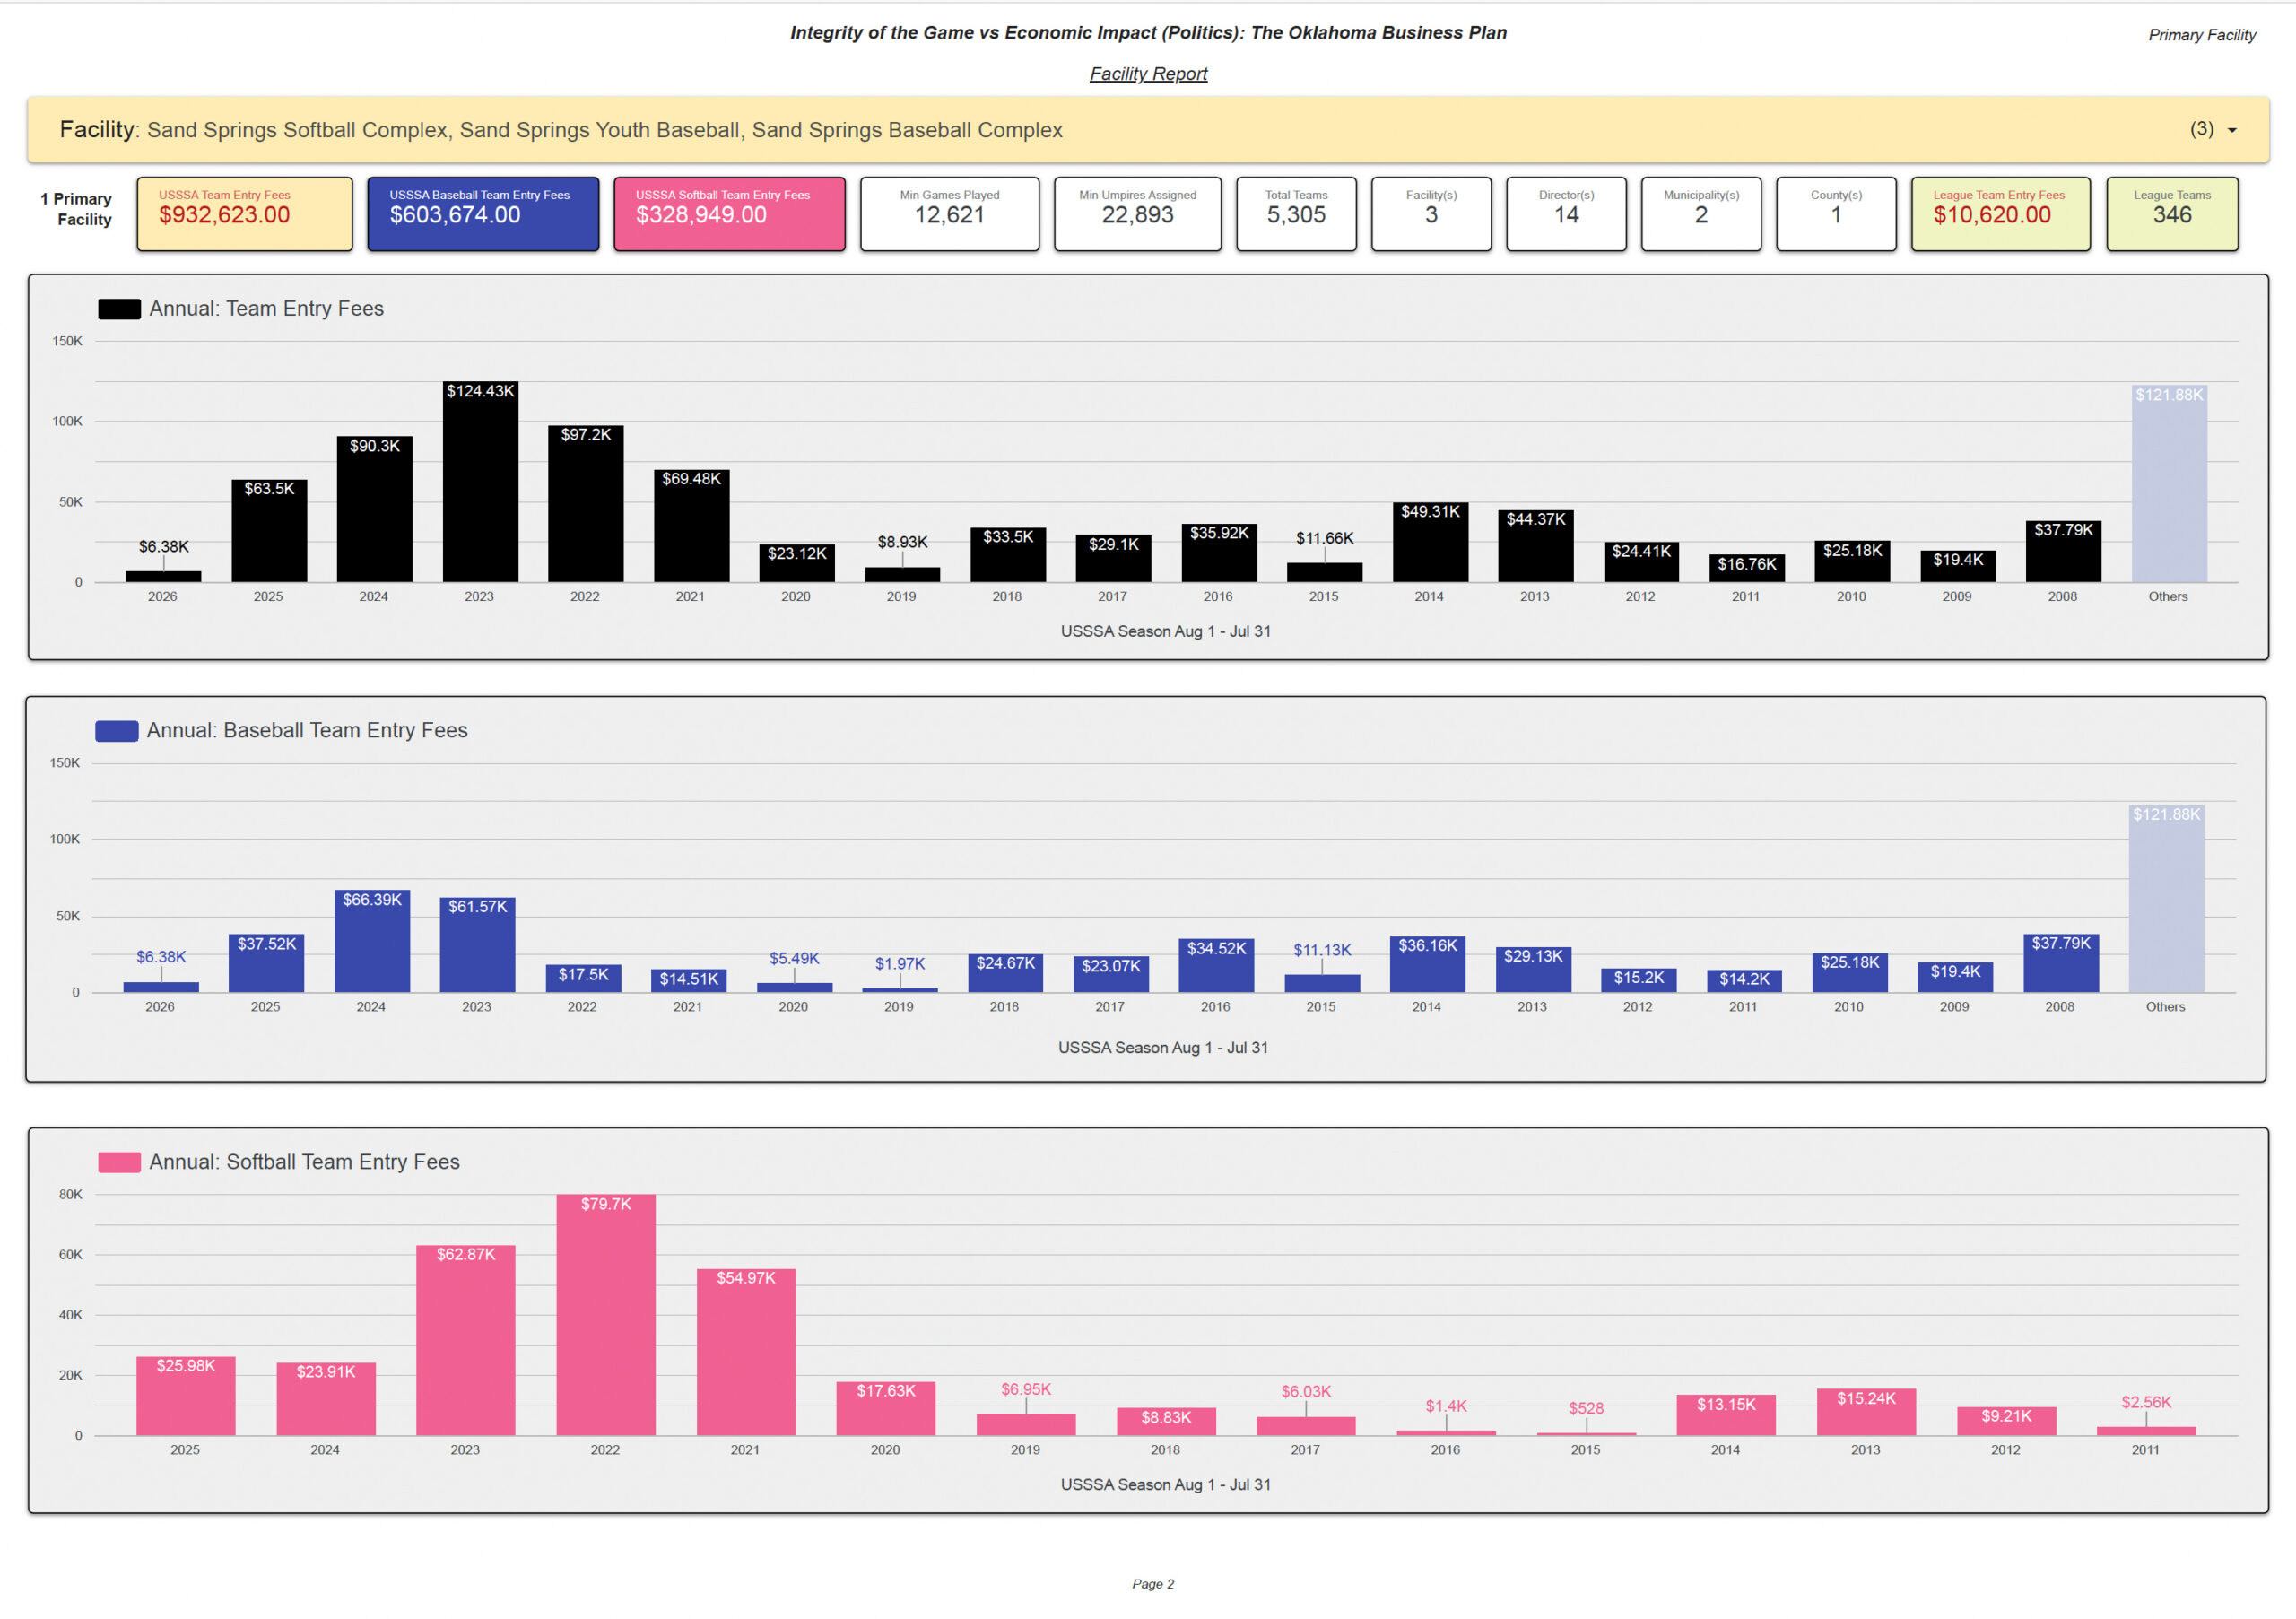
Associated Multi-Facility / Satellite Activity
This population excludes stand-alone primary-facility records. It totals $422,233 in Calculated Team Entry Fees: $395,117 baseball and $27,116 softball, with 1,728 teams, 4,284 minimum games, 8,445 minimum officials, 13 facilities/facility combinations, 6 directors, 12 municipalities, and 2 counties.
Multi-facility event records establish documented association; they do not establish how teams, games, fees, officials, or other activity were allocated among individual facilities.
Jenks Youth Baseball Complex + Sand Springs Youth Baseball
$277.21K
Bentley Sports Complex + Sand Springs Youth Baseball
$45.21K
Lynn Gibson
$337.53K
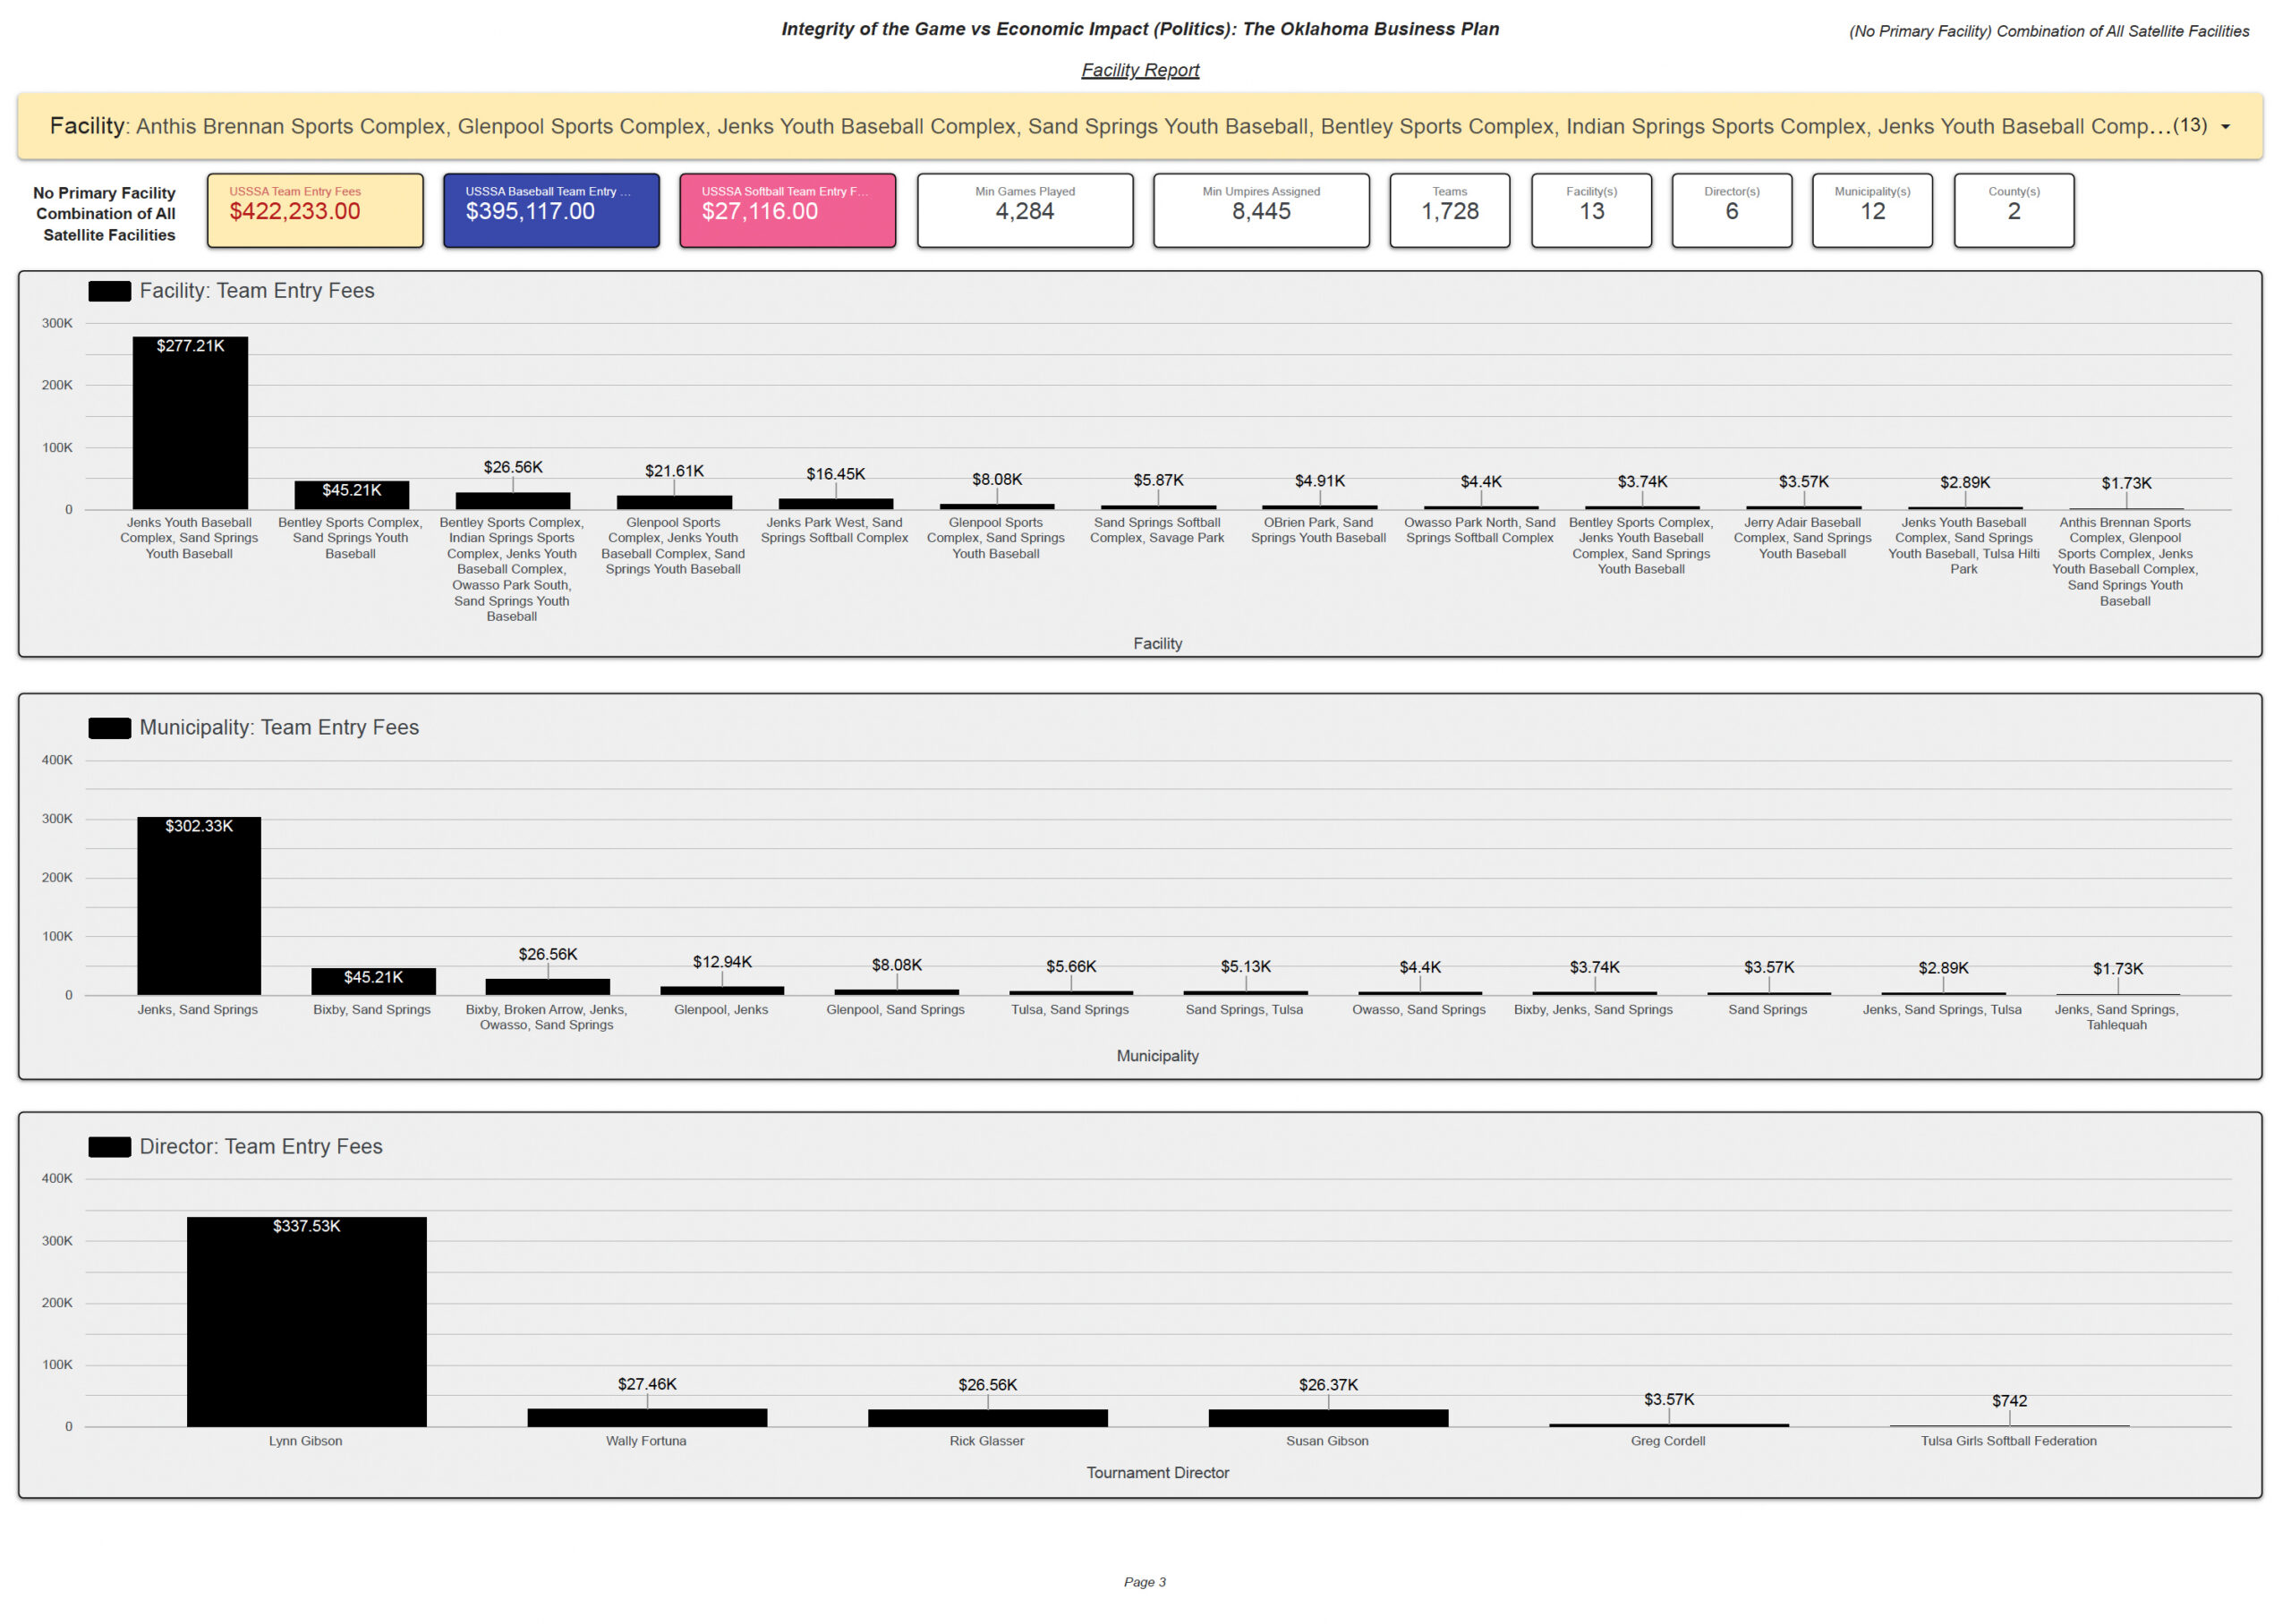
Combined Documented Facility Activity Footprint
Pages 1–2 Direct Activity + Page 3 Associated Activity = Page 4 Combined Footprint. The combined population totals $1,354,856: $998,791 baseball and $356,065 softball, with 7,033 teams, 16,905 minimum games, 31,338 minimum officials, 16 facilities/facility combinations, 17 directors, 13 municipalities, and 2 counties.
Leading combined director concentrations are Lynn Gibson — $540.23K, Greg Cordell — $370.31K, and Susan Gibson — $261.75K. The largest combined municipality concentration is Sand Springs — $930.98K.
Direct / Associated / Combined Explainer
DIRECT
Records listing the Primary Facility independently. Multi-facility combinations are excluded.
ASSOCIATED
Records identifying a Sand Springs facility within a multi-site configuration. Association does not establish allocation.
COMBINED
The broadest documented footprint across both populations; not proof all activity occurred exclusively at one location.
Calculated Team Entry Fee Methodology
These calculations do not independently establish actual payments collected, gross receipts, net income, profit, director compensation, facility or municipal revenue, bank deposits, taxable income, gate/concession revenue, umpire compensation, or tax liability. A publicly reported $0.00 Team Entry Fee does not necessarily establish $0.00 operational activity; unsupported local fees are not imputed.
Facility History & Community Context
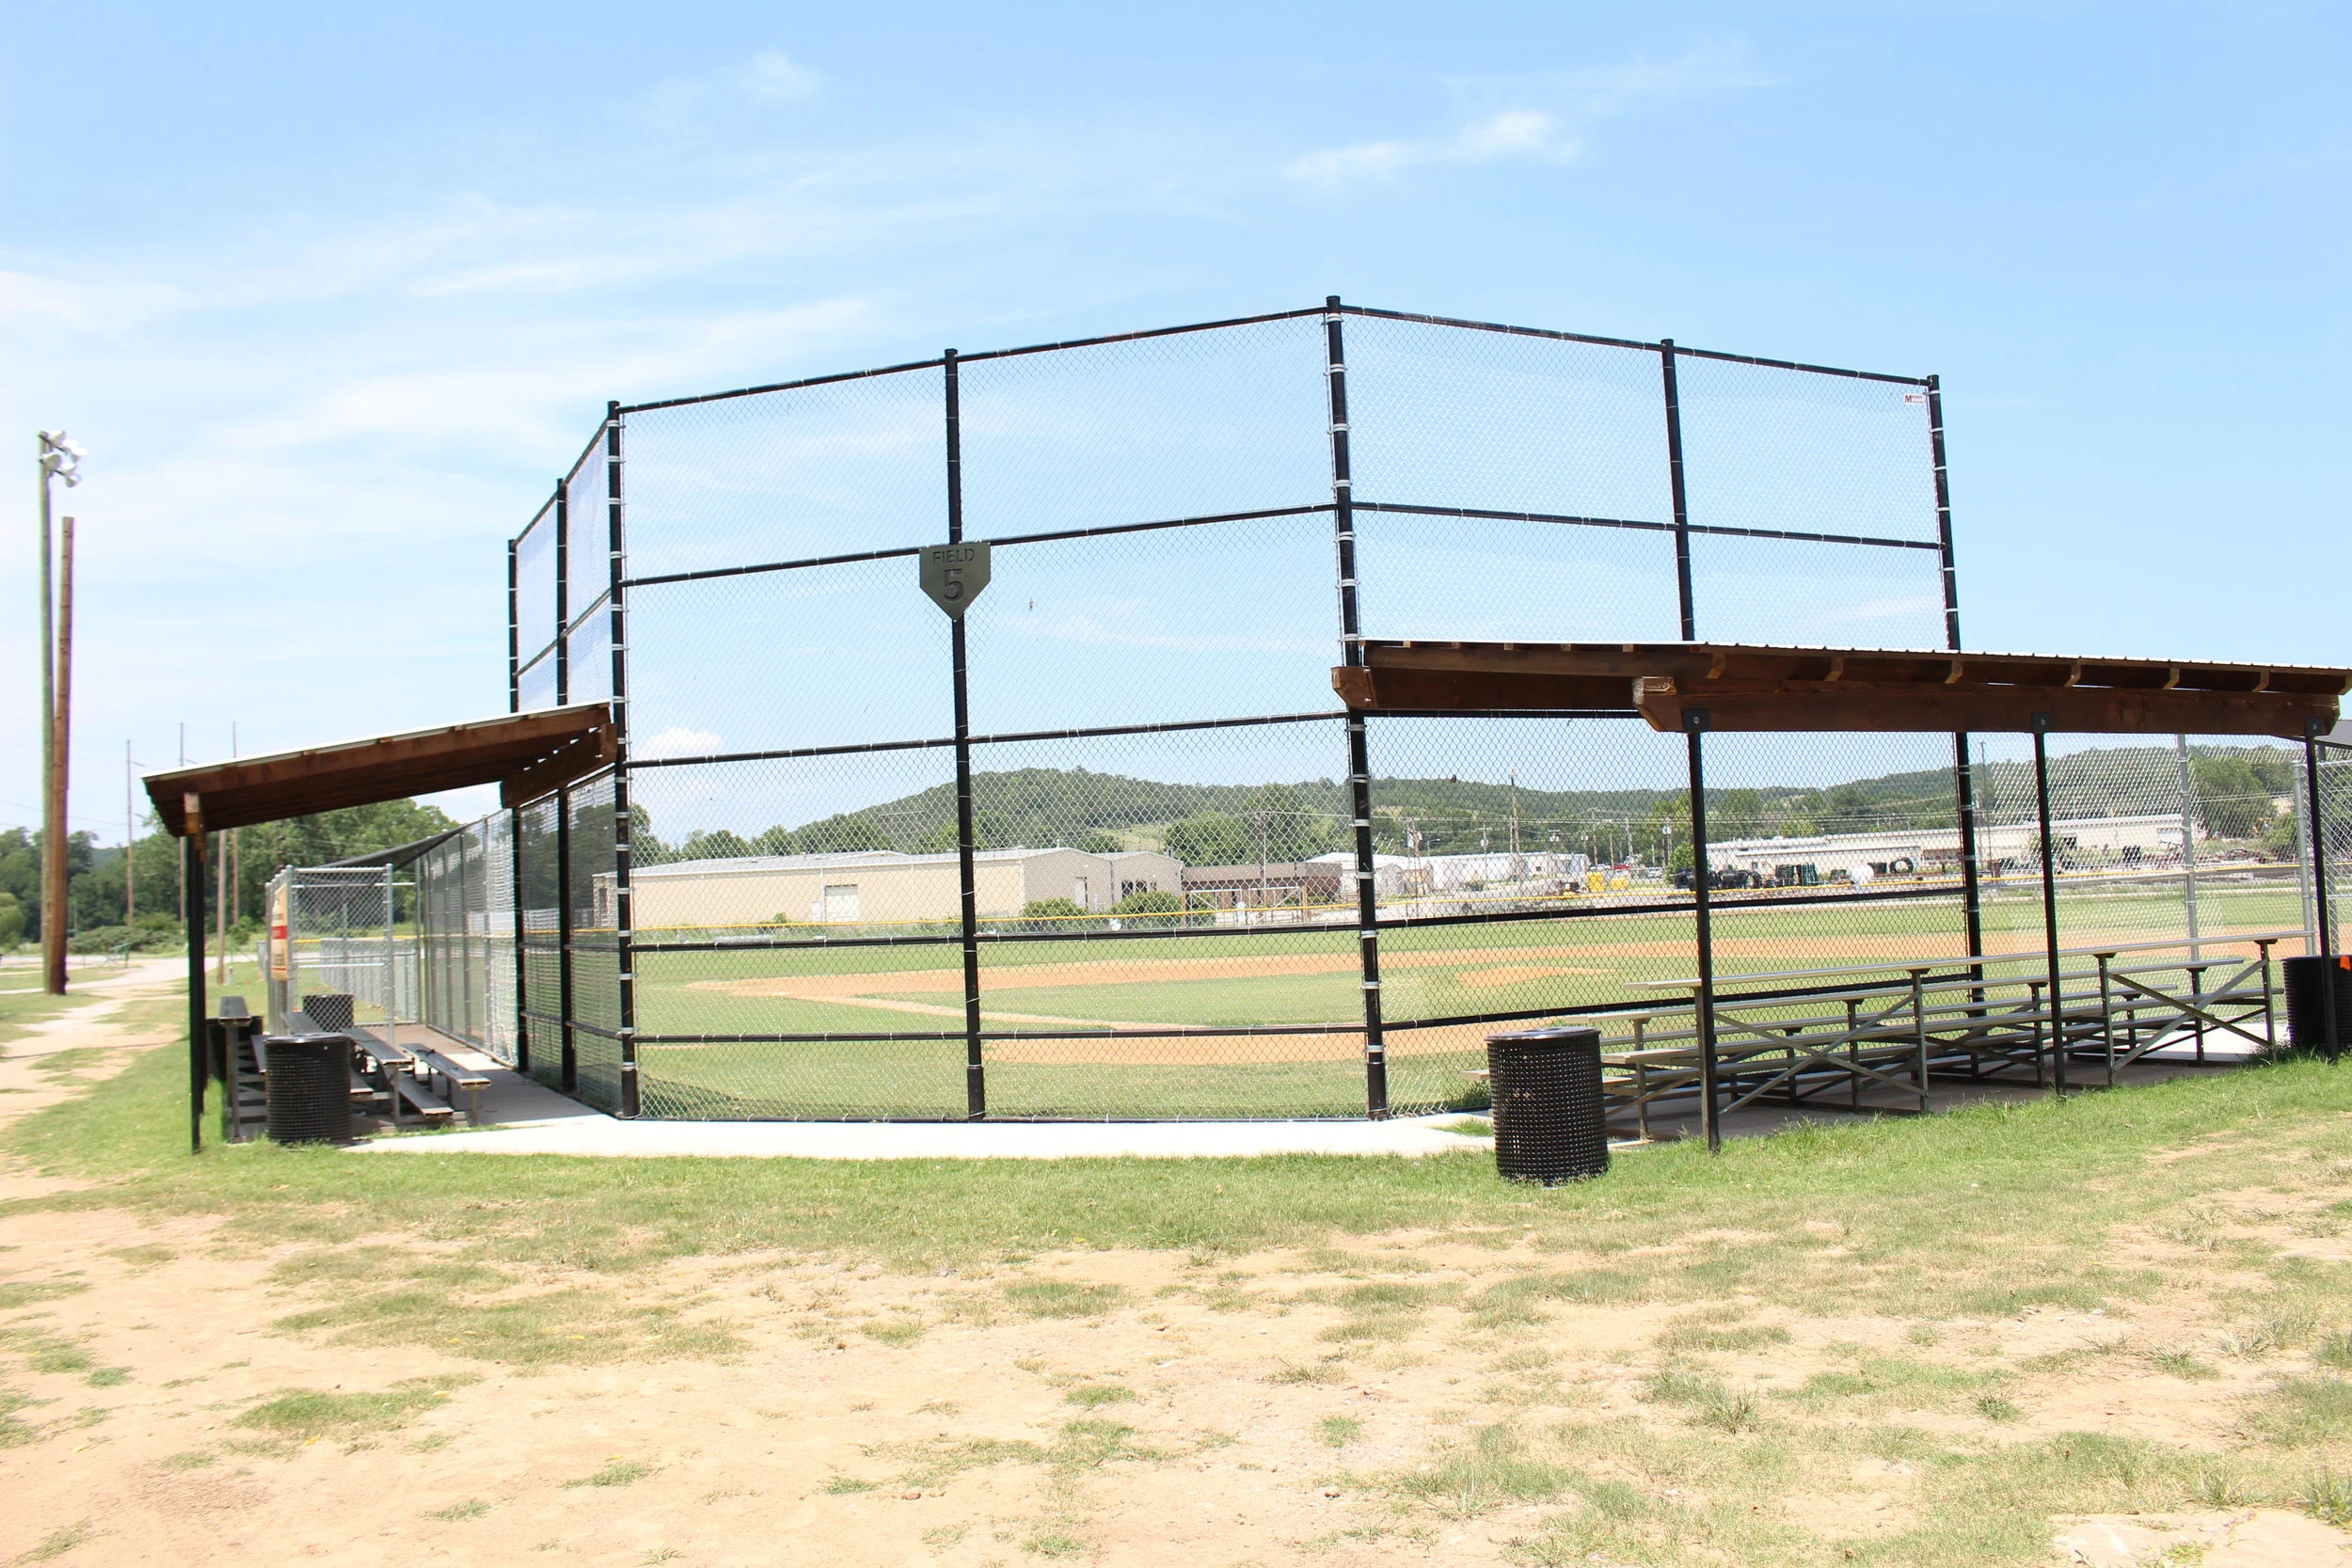
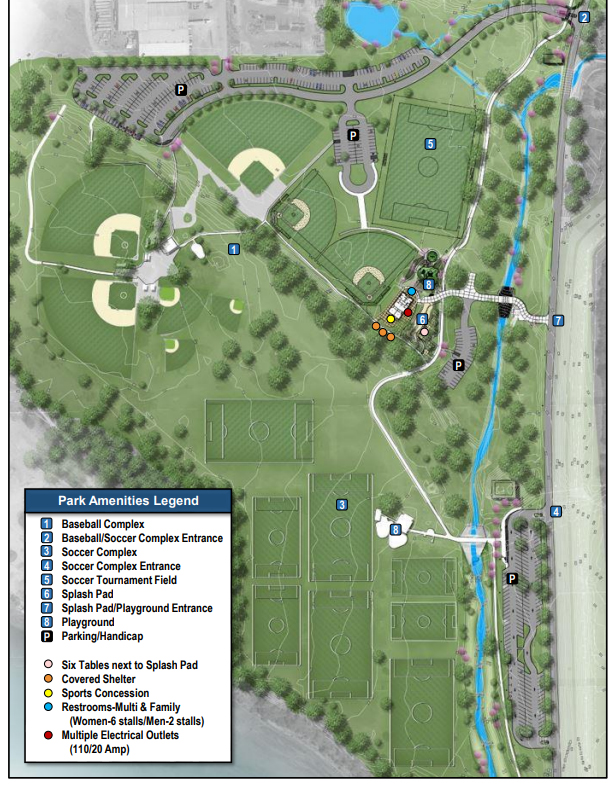
The supplied history identifies Case Community Park (formerly River City Park) as a long-standing center of Sand Springs athletics. It describes the William “Will” Ramsey Softball Complex as established in 1974 and the River City Sports Complex expansion as built in 1981.
The Jerry Adair Baseball Complex is described as a seven-lighted-field youth baseball hub that was heavily damaged by an EF-2 tornado in March 2015 and reopened after a major community-supported rebuild in 2016. The history also notes modern concessions, restrooms, playground infrastructure, and the neighboring Rotary Super Splash Pad.
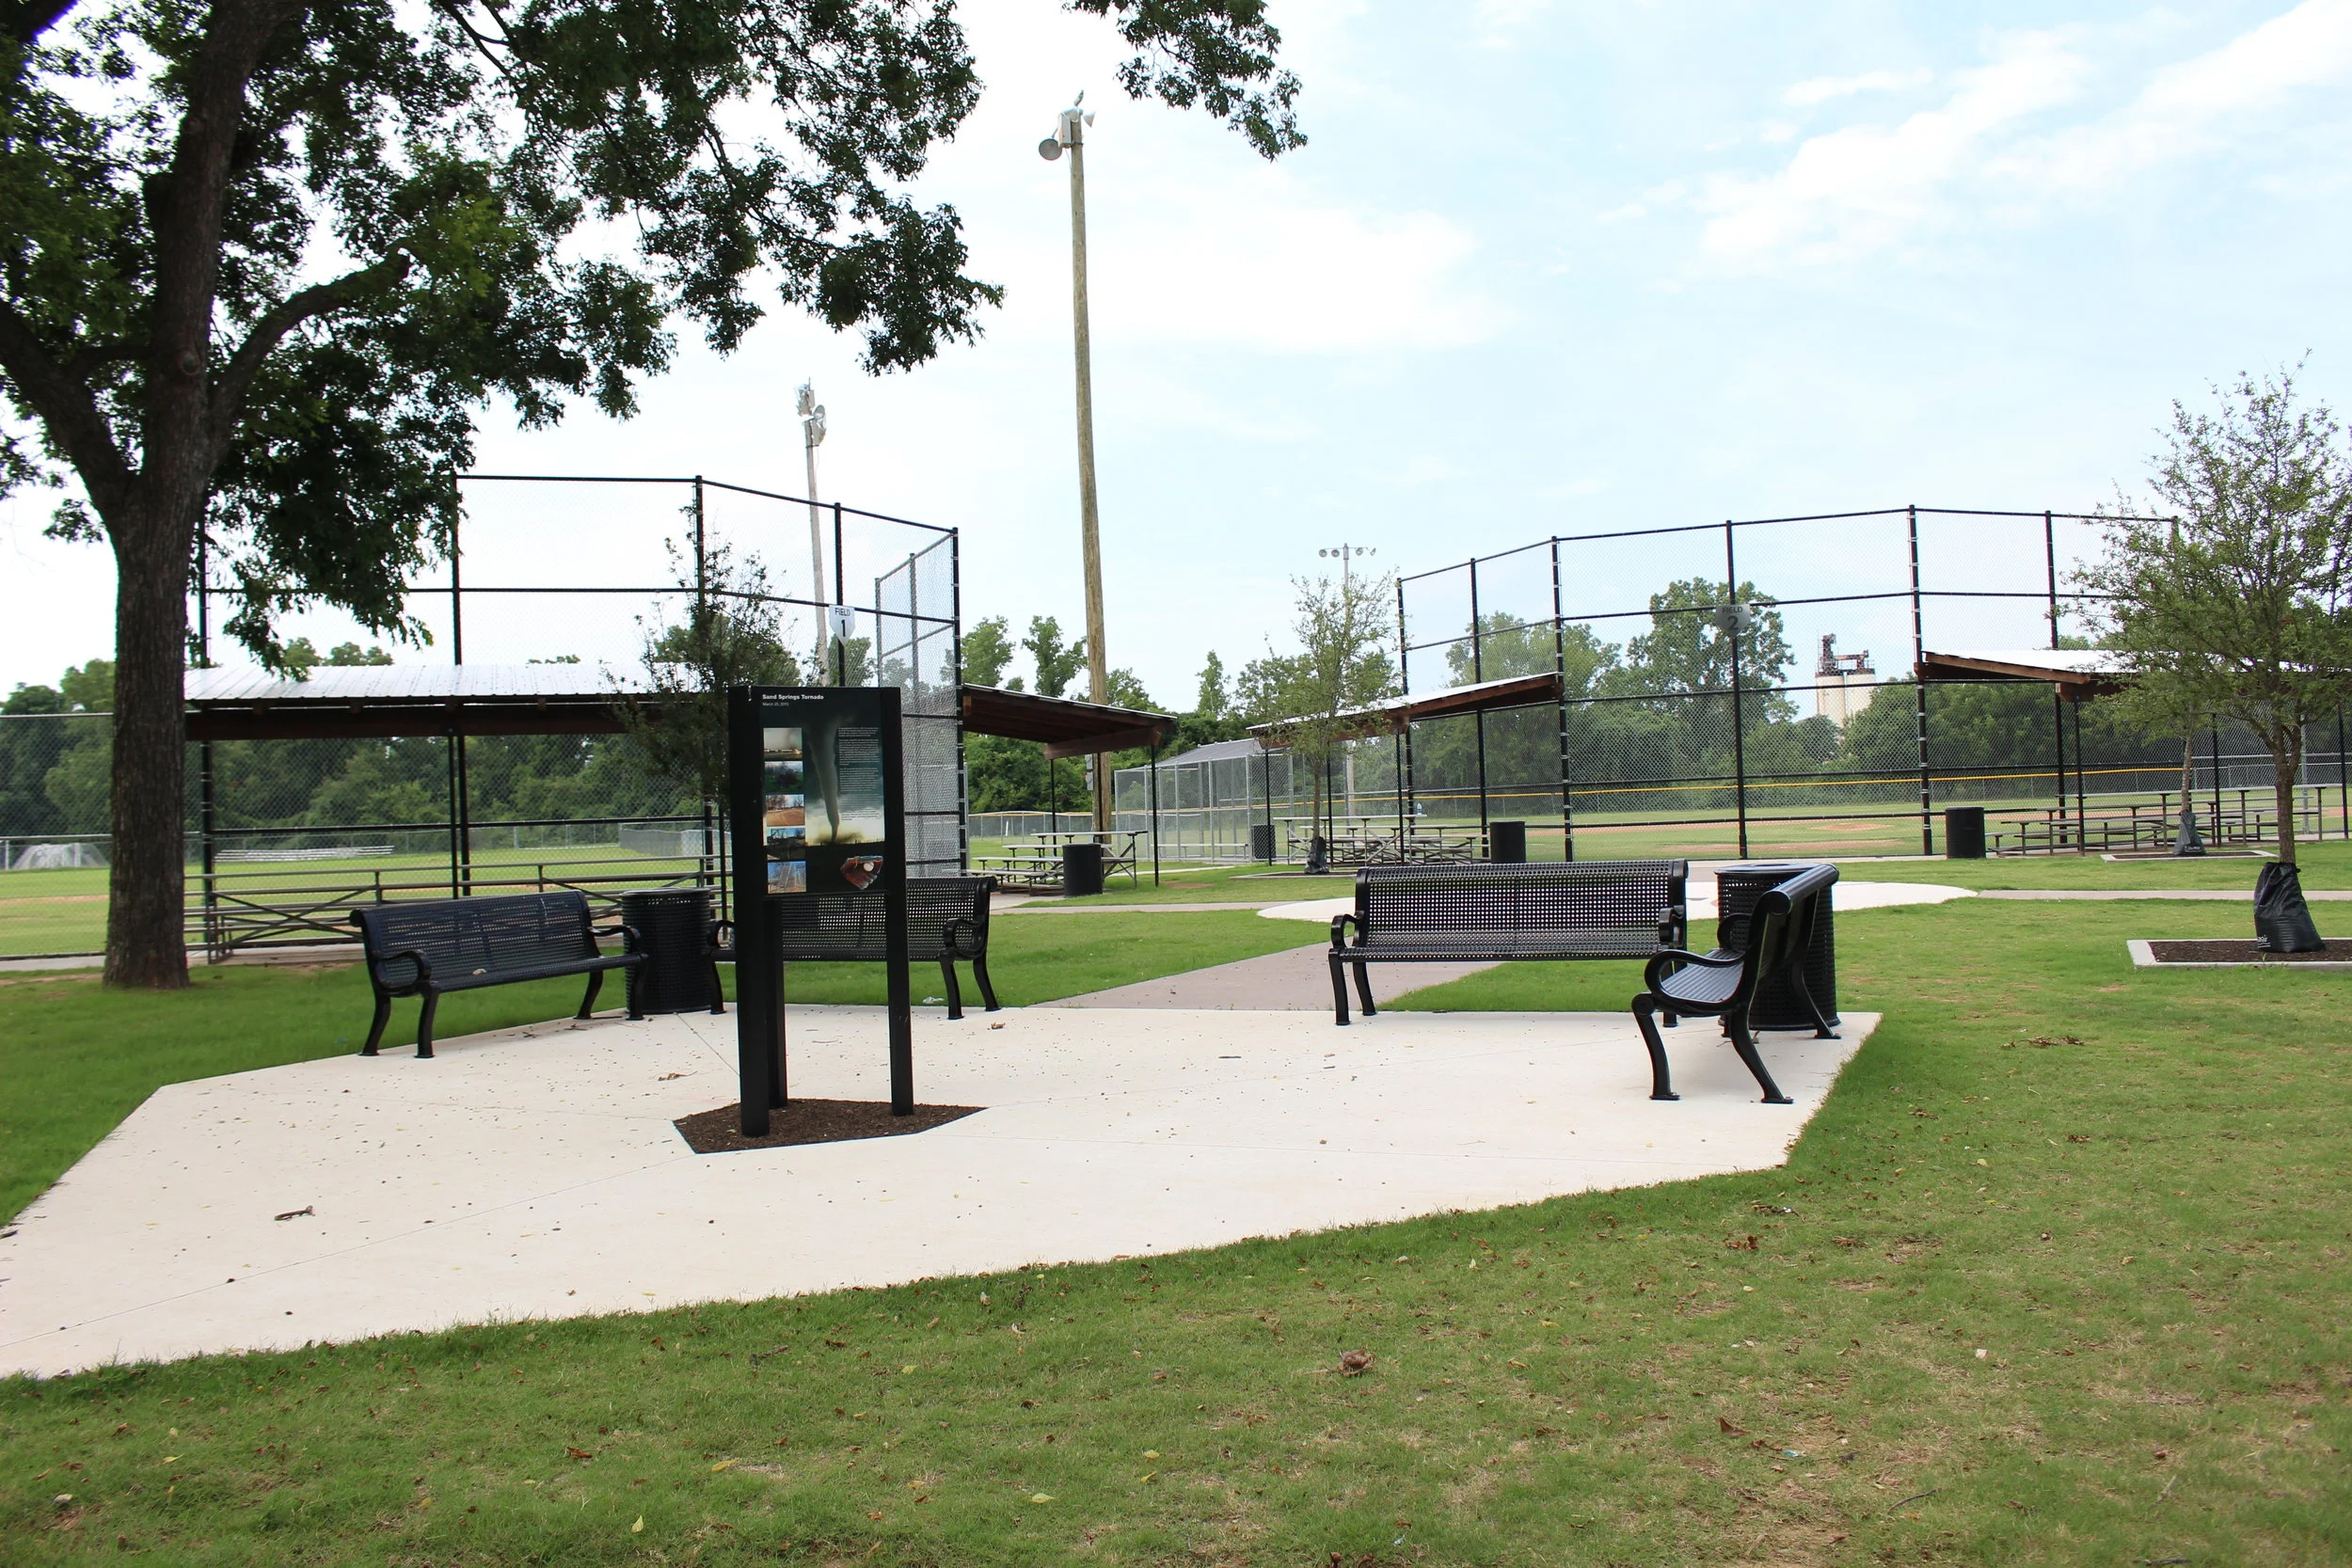
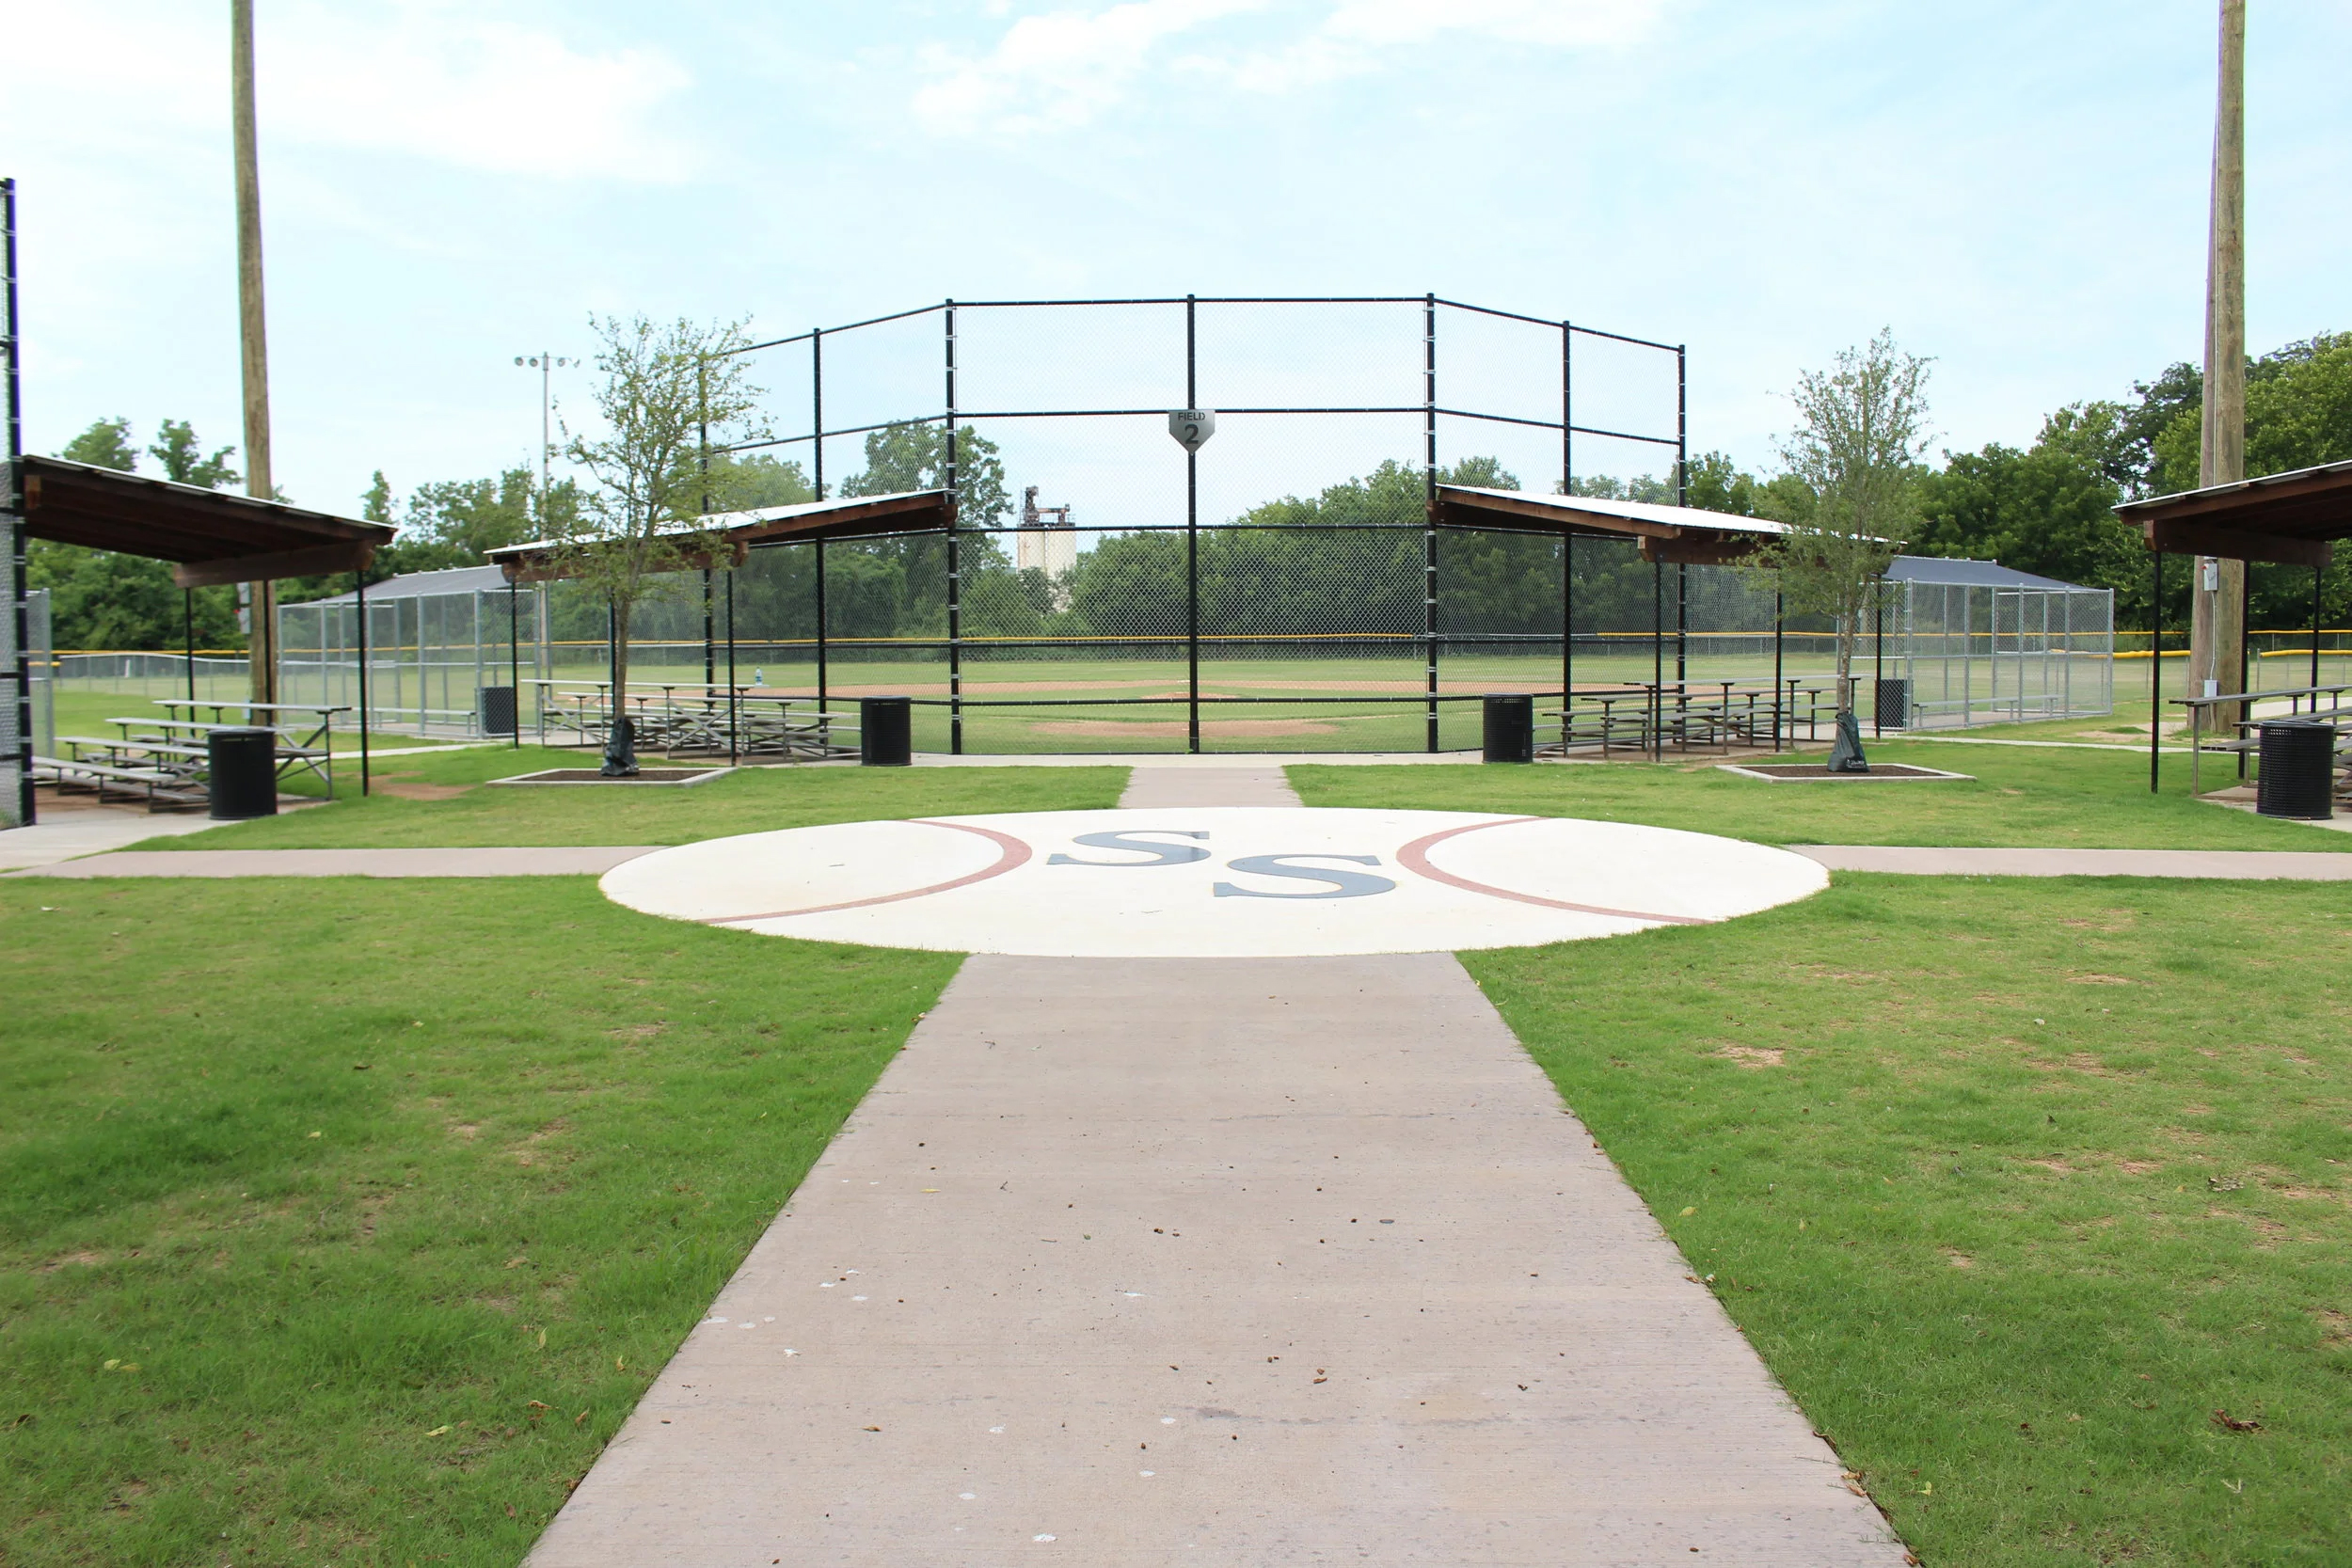
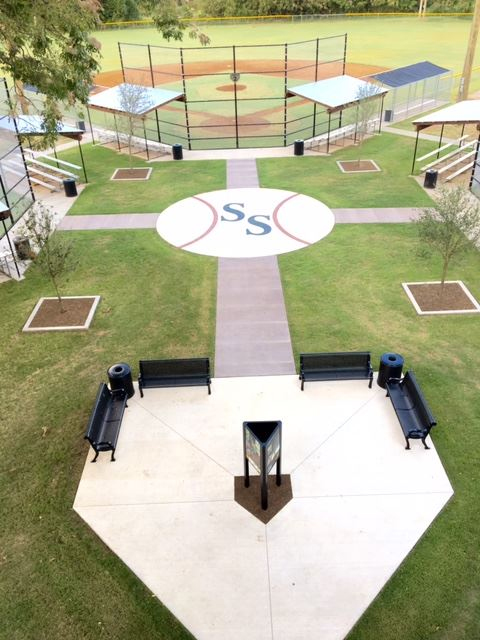
Additional Documentary Images
What This Profile Establishes — and Does Not Establish
Established / Calculated
Facility associations, teams, sports, seasons, minimum games and officials, directors, municipalities, counties, posted fees, Calculated Team Entry Fees, tournament/league activity, and direct/associated/combined analytical populations.
Not Established by the Dataset Alone
Actual receipts, facility or municipal revenue, director compensation, profits, taxable income, bank ownership, rental payments, revenue sharing, allocation of multi-facility proceeds, locally collected fees, or ultimate disposition of funds.
Facility-Specific Research Summary
The direct Sand Springs population documents $932,623 in Calculated Team Entry Fees across 5,305 teams, including $603,674 baseball and $328,949 softball. League records show 346 teams and $10,620 in Calculated Team Entry Fees. The highest displayed annual total is 2023 at $124.43K; baseball peaks in 2024 and softball in 2022.
Associated multi-facility records add a separate $422,233 analytical population, led by the Jenks Youth Baseball Complex + Sand Springs Youth Baseball configuration at $277.21K. The combined documented footprint is $1,354,856 across 7,033 teams, 16,905 minimum games, and 31,338 minimum officials. These figures establish documented scale and association, not allocation or receipt of funds.
Research & Methodology Disclaimer
The Hidden Valley — Integrity of the Game dataset is an independent research reconstruction based primarily on publicly accessible USSSA event, tournament, league, director, facility, team, pricing, and related historical information. Historical records may contain incomplete information, naming variations, reused or inconsistent identifiers, facility-name changes, $0.00 listings, missing fields, or records later modified or removed.
This is not an official USSSA report and is not represented as sponsored, endorsed, verified, or approved by USSSA or any governmental entity, municipality, tribe, school district, facility owner, director, or other organization appearing in the research. Calculated figures are research estimates, not audits, tax determinations, forensic-accounting conclusions, legal findings, or allegations. Identification does not itself imply wrongdoing, misconduct, tax noncompliance, criminal activity, or civil liability.