
Tri-County Basketball Research
Independent research into a rural, community-based youth basketball league, public/community facility use, officials compensation, recurring cash-flow activity, and the broader question of how youth-sports economics can serve local communities.
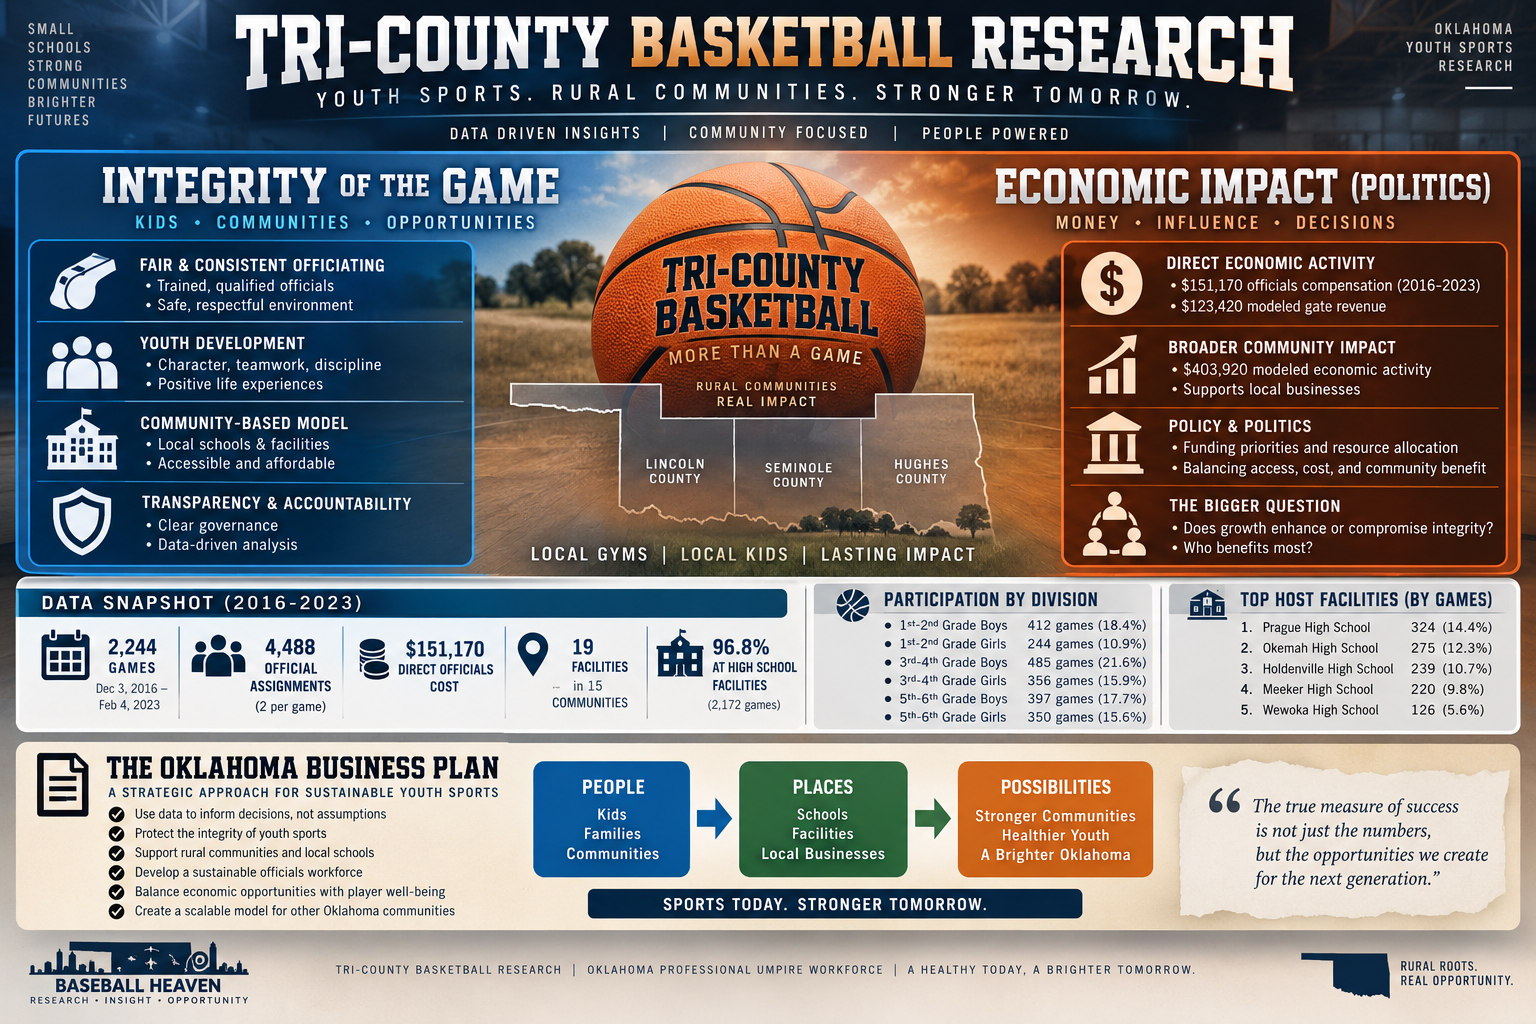
A rural youth-sports system measured through games, facilities, officials and community activity
The historical schedule documents 2,244 games from December 3, 2016 through February 4, 2023. The research distinguishes schedule-derived facts and calculated officials costs from modeled player, gate and local economic-impact assumptions.
Community-based cash flow is not automatically the same as a destination travel-tournament model
Tri-County involves money, paid officials, family travel, facilities, player fees and likely admission/concession activity. The research question is not whether money exists. The more important questions are how the activity is structured, where it occurs, who benefits and whether the economic architecture supports youth and community access.
Integrity of the Game
- Elementary-age boys and girls
- Recurring regional league play
- Rotating host communities
- Heavy reliance on local school facilities
- Direct, measurable demand for officials
- Community access and continuity
Economic Impact (Politics)
- Officials compensation and workforce cost
- Participant and family spending
- Admission / gate assumptions
- Local fuel, food and concession activity
- Public/community resource allocation
- Policy questions about transparency and benefit
People → Places → Possibilities
The Tri-County case provides a practical example of how youth-sports economics can be analyzed around community benefit rather than event volume alone.
Families
Officials
Communities
Facilities
Local Businesses
Healthier Youth
Sustainable Officiating
4,488 assignments demonstrate that officials are a workforce, not merely a line item
Two officials are represented for each recorded game. Historical per-official compensation progresses from $25 to $30 and then $40, producing a 60% nominal increase from the earliest to the latest represented rate.
| Year | Games | Rate / Official | Assignments | Officials Cost |
|---|---|---|---|---|
| 2016 | 186 | $25 | 372 | $9,300 |
| 2017 | 433 | $25 | 866 | $21,650 |
| 2019 | 163 | $30 | 326 | $9,780 |
| 2020 | 326 | $30 | 652 | $19,560 |
| 2021 | 167 | $40 | 334 | $13,360 |
| 2022 | 616 | $40 | 1,232 | $49,280 |
| 2023 | 353 | $40 | 706 | $28,240 |
What the same historical assignment workload would cost at different rates
These are controlled scenarios, not historical expenditures. Holding 4,488 assignments constant isolates the effect of per-game compensation.
| Per-Official Rate | Cost at 4,488 Assignments | Change vs. $40 |
|---|---|---|
| $25 | $112,200 | $-67,320 |
| $30 | $134,640 | $-44,880 |
| $40 | $179,520 | $+0 |
| $50 | $224,400 | $+44,880 |
| $60 | $269,280 | $+89,760 |
| $70 | $314,160 | $+134,640 |
Six elementary-age divisions across boys and girls basketball
| Division | Games | Share | Officials Cost |
|---|---|---|---|
| 3rd-4th Grade Boys | 485 | 21.6% | $32,600 |
| 1st-2nd Grade Boys | 412 | 18.4% | $27,760 |
| 5th-6th Grade Boys | 397 | 17.7% | $26,170 |
| 3rd-4th Grade Girls | 356 | 15.9% | $24,180 |
| 5th-6th Grade Girls | 350 | 15.6% | $23,700 |
| 1st-2nd Grade Girls | 244 | 10.9% | $16,760 |
The study's standardized participation model assumes 9 players per team and 18 player-participations per game. This produces 40,392 modeled player-game participations and is not a count of unique children.
96.8% of recorded games were classified as high-school facility use
The historical schedule used 19 facilities. The remaining 72 games outside the high-school classification occurred at Reynolds Wellness Center, identified in the dataset as a municipal facility.
| Top Host Facility | Games | Share of Schedule |
|---|---|---|
| Prague High School | 324 | 14.4% |
| Okemah High School | 275 | 12.3% |
| Holdenville High School | 239 | 10.7% |
| Meeker High School | 220 | 9.8% |
| Wewoka High School | 126 | 5.6% |
| Strother High School | 112 | 5.0% |
| Varnum High School | 110 | 4.9% |
| Seminole High School | 106 | 4.7% |
| Paden High School | 104 | 4.6% |
| Perkins High School | 102 | 4.5% |
What the research supports—and what it does not establish
The source supports
- Paid officials and documented compensation rates
- Recurring scheduled games and facility use
- Different communities charging different player fees
- A modeled admission/gate scenario
- A modeled local economic-activity scenario
- A distributed schedule among rural communities
The source does not establish
- Total registration revenue
- Actual gate or concession receipts
- Administrative compensation or profit
- Tax treatment or banking practices
- Personal income to any administrator
- A complete cash ledger
Local circulation rather than destination concentration
The modeled economic-impact assumption is intended to illustrate recurring family spending associated with rural travel—fuel, convenience stores, concessions and similar purchases. These figures are estimates, not audited merchant revenue.
Why this basketball research belongs beside the Oklahoma Professional Umpire Workforce Model
Recruitment
Thousands of assignments require a dependable pipeline of adults willing to work evenings and weekends.
Training & Standards
Basketball referees and baseball/softball umpires share needs for certification, mentorship, evaluation and progressive assignments.
Compensation
Per-game pay can be analyzed systematically as a labor-market variable rather than treated only as an event expense.
Schedule-derived, calculated and modeled evidence are kept separate
Schedule-Derived
Games, dates, divisions, facilities, towns, ownership classifications and schedule geography.
Calculated
Official assignments and direct officials cost derived from recorded game volume, two officials per game and represented compensation rates.
Modeled
Players per team, player-game participations, gate activity and local economic impact.
A community-centered comparison case for Oklahoma youth-sports reform
Tri-County Basketball documents a substantial youth-sports operation: 2,244 games, 19 facilities, 15 communities and 4,488 officiating assignments. Nearly 97% of recorded games occurred at facilities classified as high schools, reinforcing the league's relationship with local community infrastructure.
The research does not argue that economic activity is inherently problematic. Rather, it illustrates why youth-sports systems should be evaluated according to governance, transparency, beneficiary structure, facility relationships and financial incentives. Tri-County's schedule is geographically distributed and community-centered, making it a useful comparison to destination-oriented travel tournament models.
The case also strengthens the Oklahoma Professional Umpire Workforce concept by showing that officiating demand exists well beyond baseball. A single rural basketball league generated thousands of assignments and a directly measurable compensation history.
Research, education, transparency and public-interest analysis
This is an independent research and analytical publication. It is not represented as sponsored, endorsed, verified or approved by Tri-County Basketball, any school district, municipality, facility owner, official, administrator, government entity or other organization.
Schedule-derived and calculated figures are distinguished from modeled assumptions. Modeled participation, gate and local economic-impact figures are not audited financial statements, verified receipts, tax determinations, forensic-accounting conclusions, legal findings or allegations. Identification of a facility, community or person does not itself imply wrongdoing or liability. Additional accounting records would be required for conclusions about total revenue, profit, tax treatment, banking practices or financial compliance.