
- Facility and multi-facility associations
- Teams, sports and displayed seasons
- Tournament and league classifications
- Minimum games and minimum officials
- Director categories
- Municipality and county relationships
- Publicly posted Team Entry Fees
- Calculated Team Entry Fees
- Direct, associated and combined analytical populations
Bouse Sports Complex
Hidden Valley - Integrity of the Game
Bouse Sports Complex
Oklahoma USSSA Facility Activity Profile | 2001-2026. Independent research based on publicly available USSSA information, designed to distinguish direct Primary Facility activity from associated multi-facility activity and the broader combined documented activity footprint.
Primary Facility: Bouse Sports Complex
Location: Choctaw, Oklahoma
Address: 1333 N Indian Meridian Rd
Facility context: eight turf baseball/softball fields, splash pad, and playground.
Independent research. Not an official USSSA report.
Location: Choctaw, Oklahoma
Address: 1333 N Indian Meridian Rd
Facility context: eight turf baseball/softball fields, splash pad, and playground.
Independent research. Not an official USSSA report.

Primary Facility Snapshot
Direct / stand-alone Bouse Sports Complex activity
Pages 1-2 include records in which Bouse Sports Complex is listed independently as the event facility. Multi-facility combinations are excluded from this direct population.
Calculated Team Entry Fees
$1,777,443
Baseball
$363,677
Softball
$1,413,766
Total Teams
5,821
Minimum Games
17,374
Minimum Umpires Assigned
32,682
Directors
15
Municipalities
1
Counties
1
League Team Entry Fees
$19,988
League Teams
108
Primary Facility Count
1
Interpretation: Calculated Team Entry Fees are an analytical measure derived from participating teams multiplied by the publicly posted Team Entry Fee. They are not, by themselves, proof of actual receipts, facility revenue, municipal revenue, director income, profit, taxable income, or disposition of funds.
Page 1
Direct activity: facility, municipality and director concentrations

Direct Primary Facility Findings
- The report associates $1,777,443 in direct Calculated Team Entry Fees with Bouse Sports Complex.
- The direct municipality is Choctaw, also representing approximately $1.78M in the municipality chart.
- Softball represents the larger sport share at $1,413,766, compared with $363,677 for baseball.
- The report identifies 15 director categories in the direct population.
Leading Direct Director Concentrations
Page 2
Annual and sport trend analysis
The direct population displays activity for the seasons shown below. Missing years are not inferred.
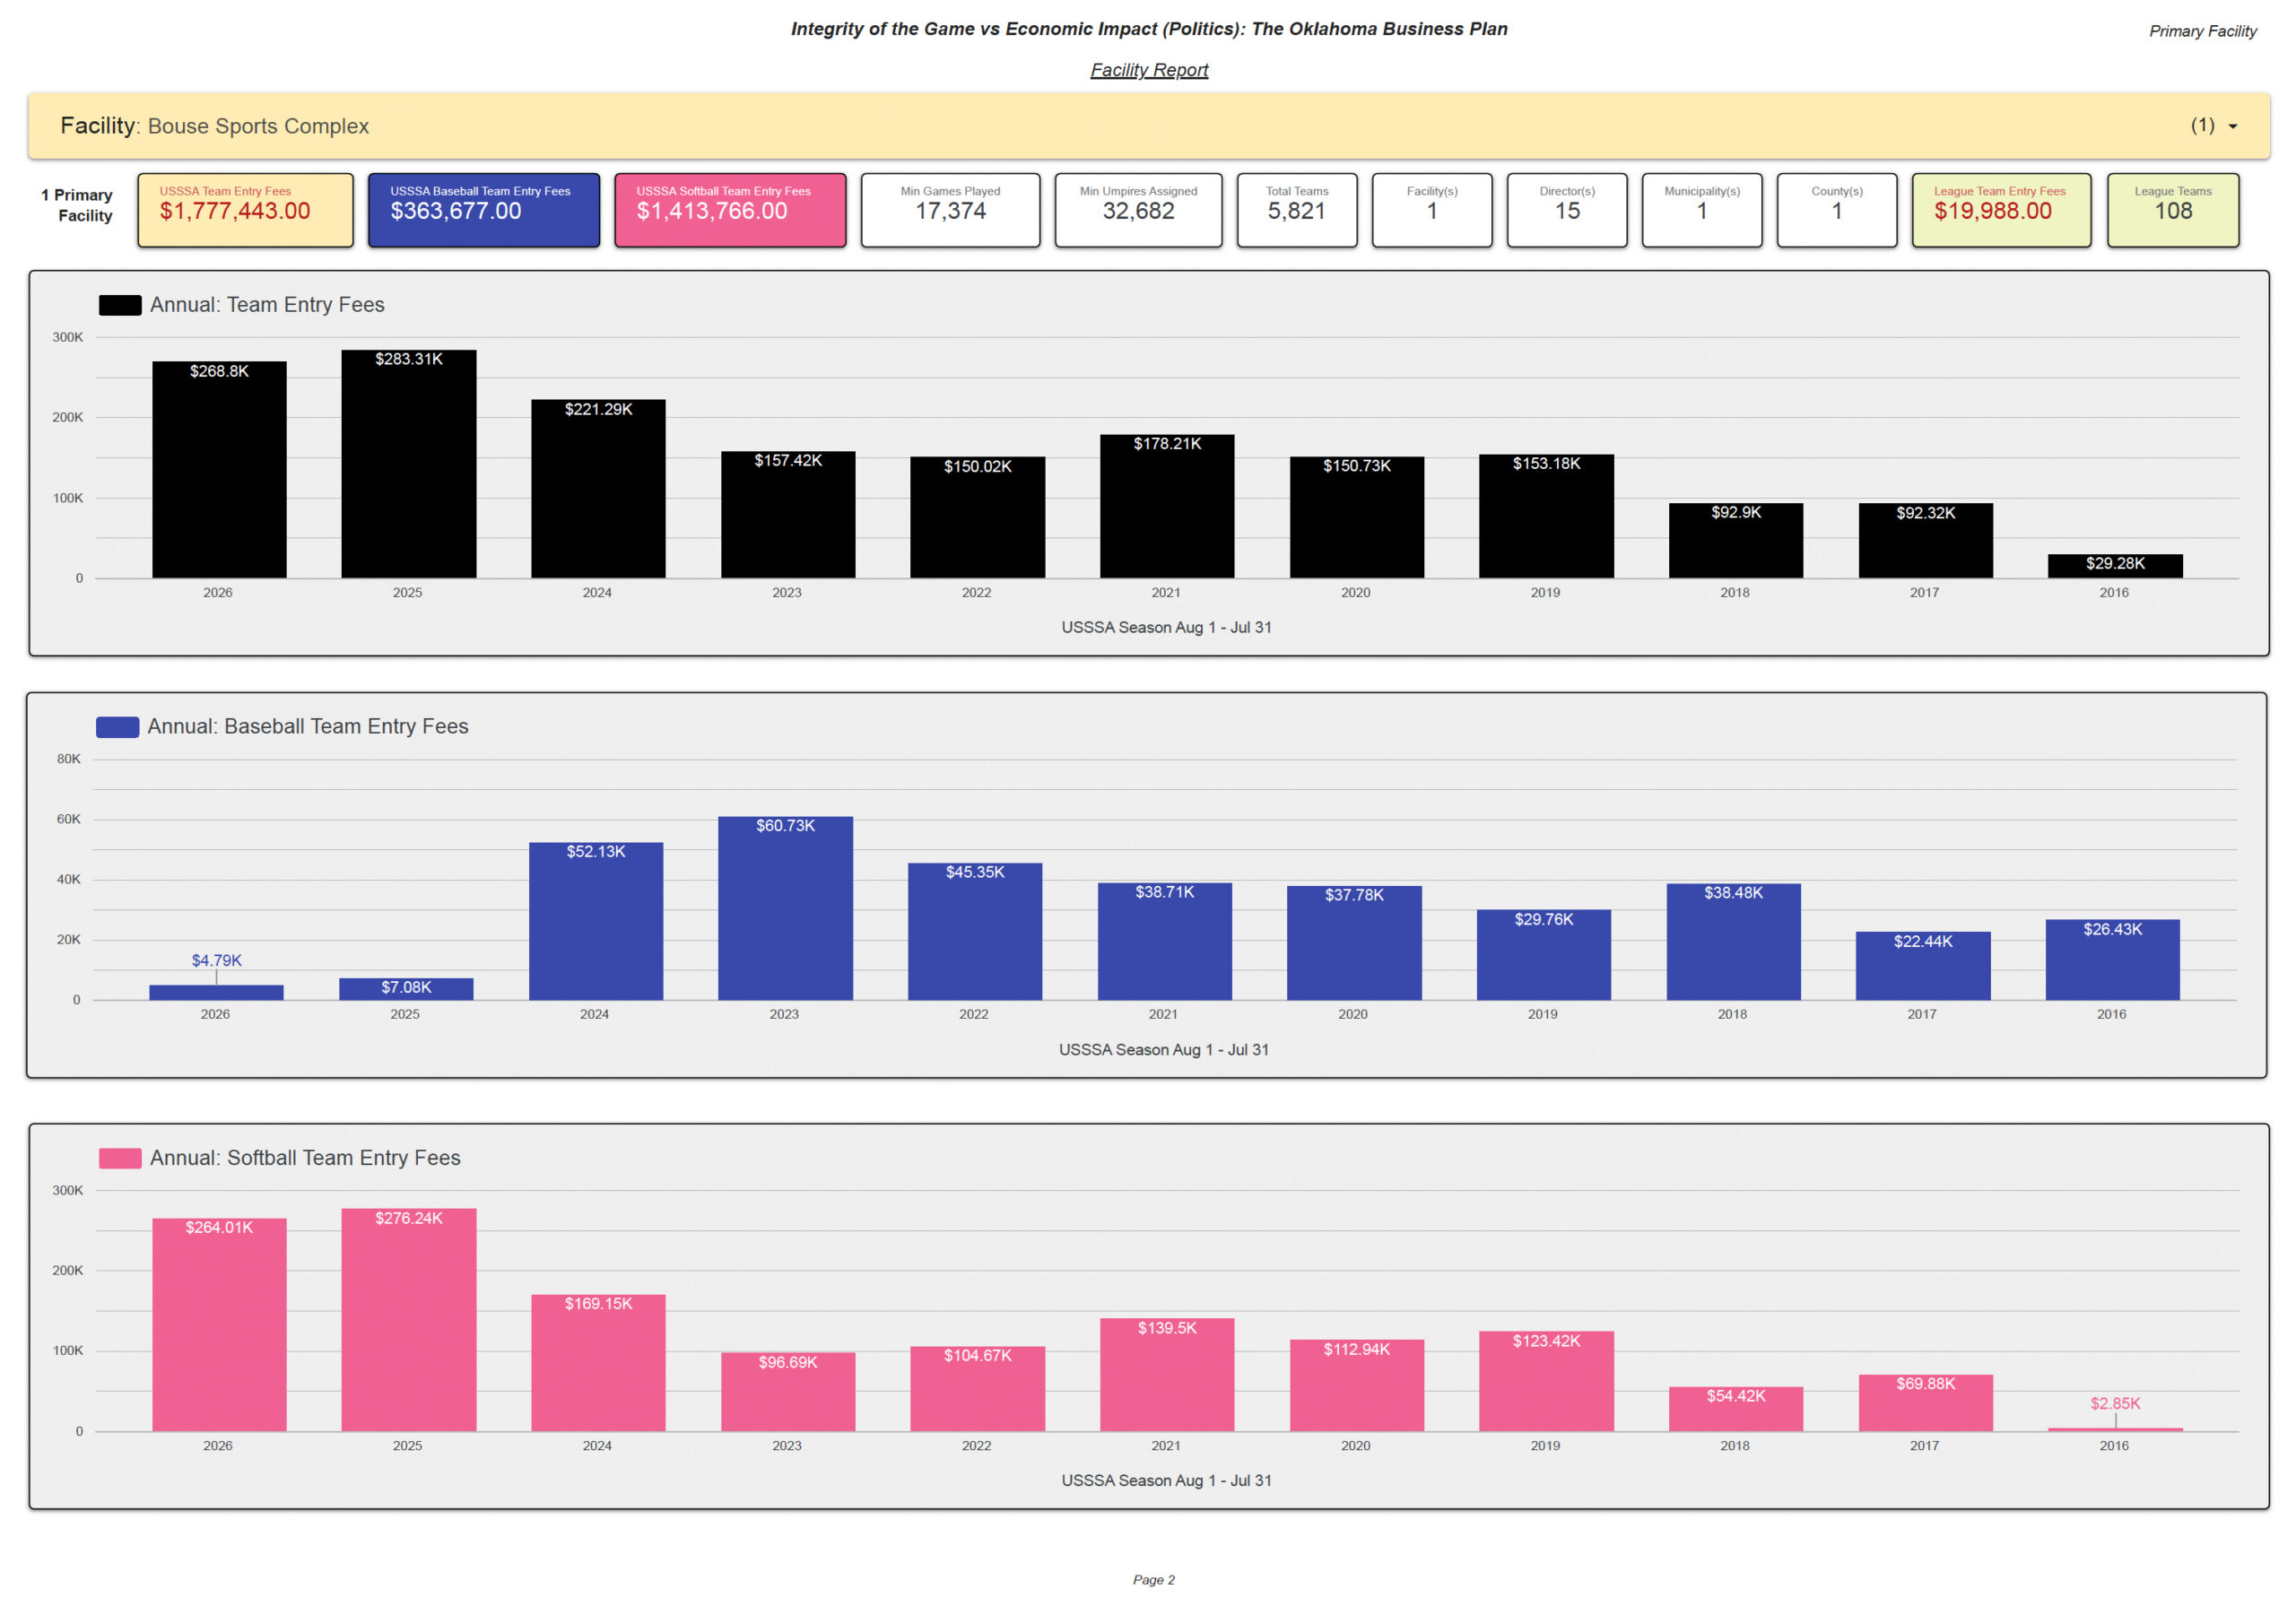
Displayed Annual Calculated Team Entry Fees
| Season | Total | Baseball | Softball |
|---|---|---|---|
| 2026 | $268.80K | $4.79K | $264.01K |
| 2025 | $283.31K | $7.08K | $276.24K |
| 2024 | $221.29K | $52.13K | $169.15K |
| 2023 | $157.42K | $60.73K | $96.69K |
| 2022 | $150.02K | $45.35K | $104.67K |
| 2021 | $178.21K | $38.71K | $139.50K |
| 2020 | $150.73K | $37.78K | $112.94K |
| 2019 | $153.18K | $29.76K | $123.42K |
| 2018 | $92.90K | $38.48K | $54.42K |
| 2017 | $92.32K | $22.44K | $69.88K |
| 2016 | $29.28K | $26.43K | $2.85K |
Peak displayed seasons: highest total season = 2025 ($283.31K); highest baseball season = 2023 ($60.73K); highest softball season = 2025 ($276.24K). Softball is the dominant calculated-fee sport across the direct population.
Page 3
Associated multi-facility / satellite activity
Page 3 excludes the stand-alone Bouse Sports Complex population. It captures records in which Bouse Sports Complex appears as part of a larger multi-facility configuration.
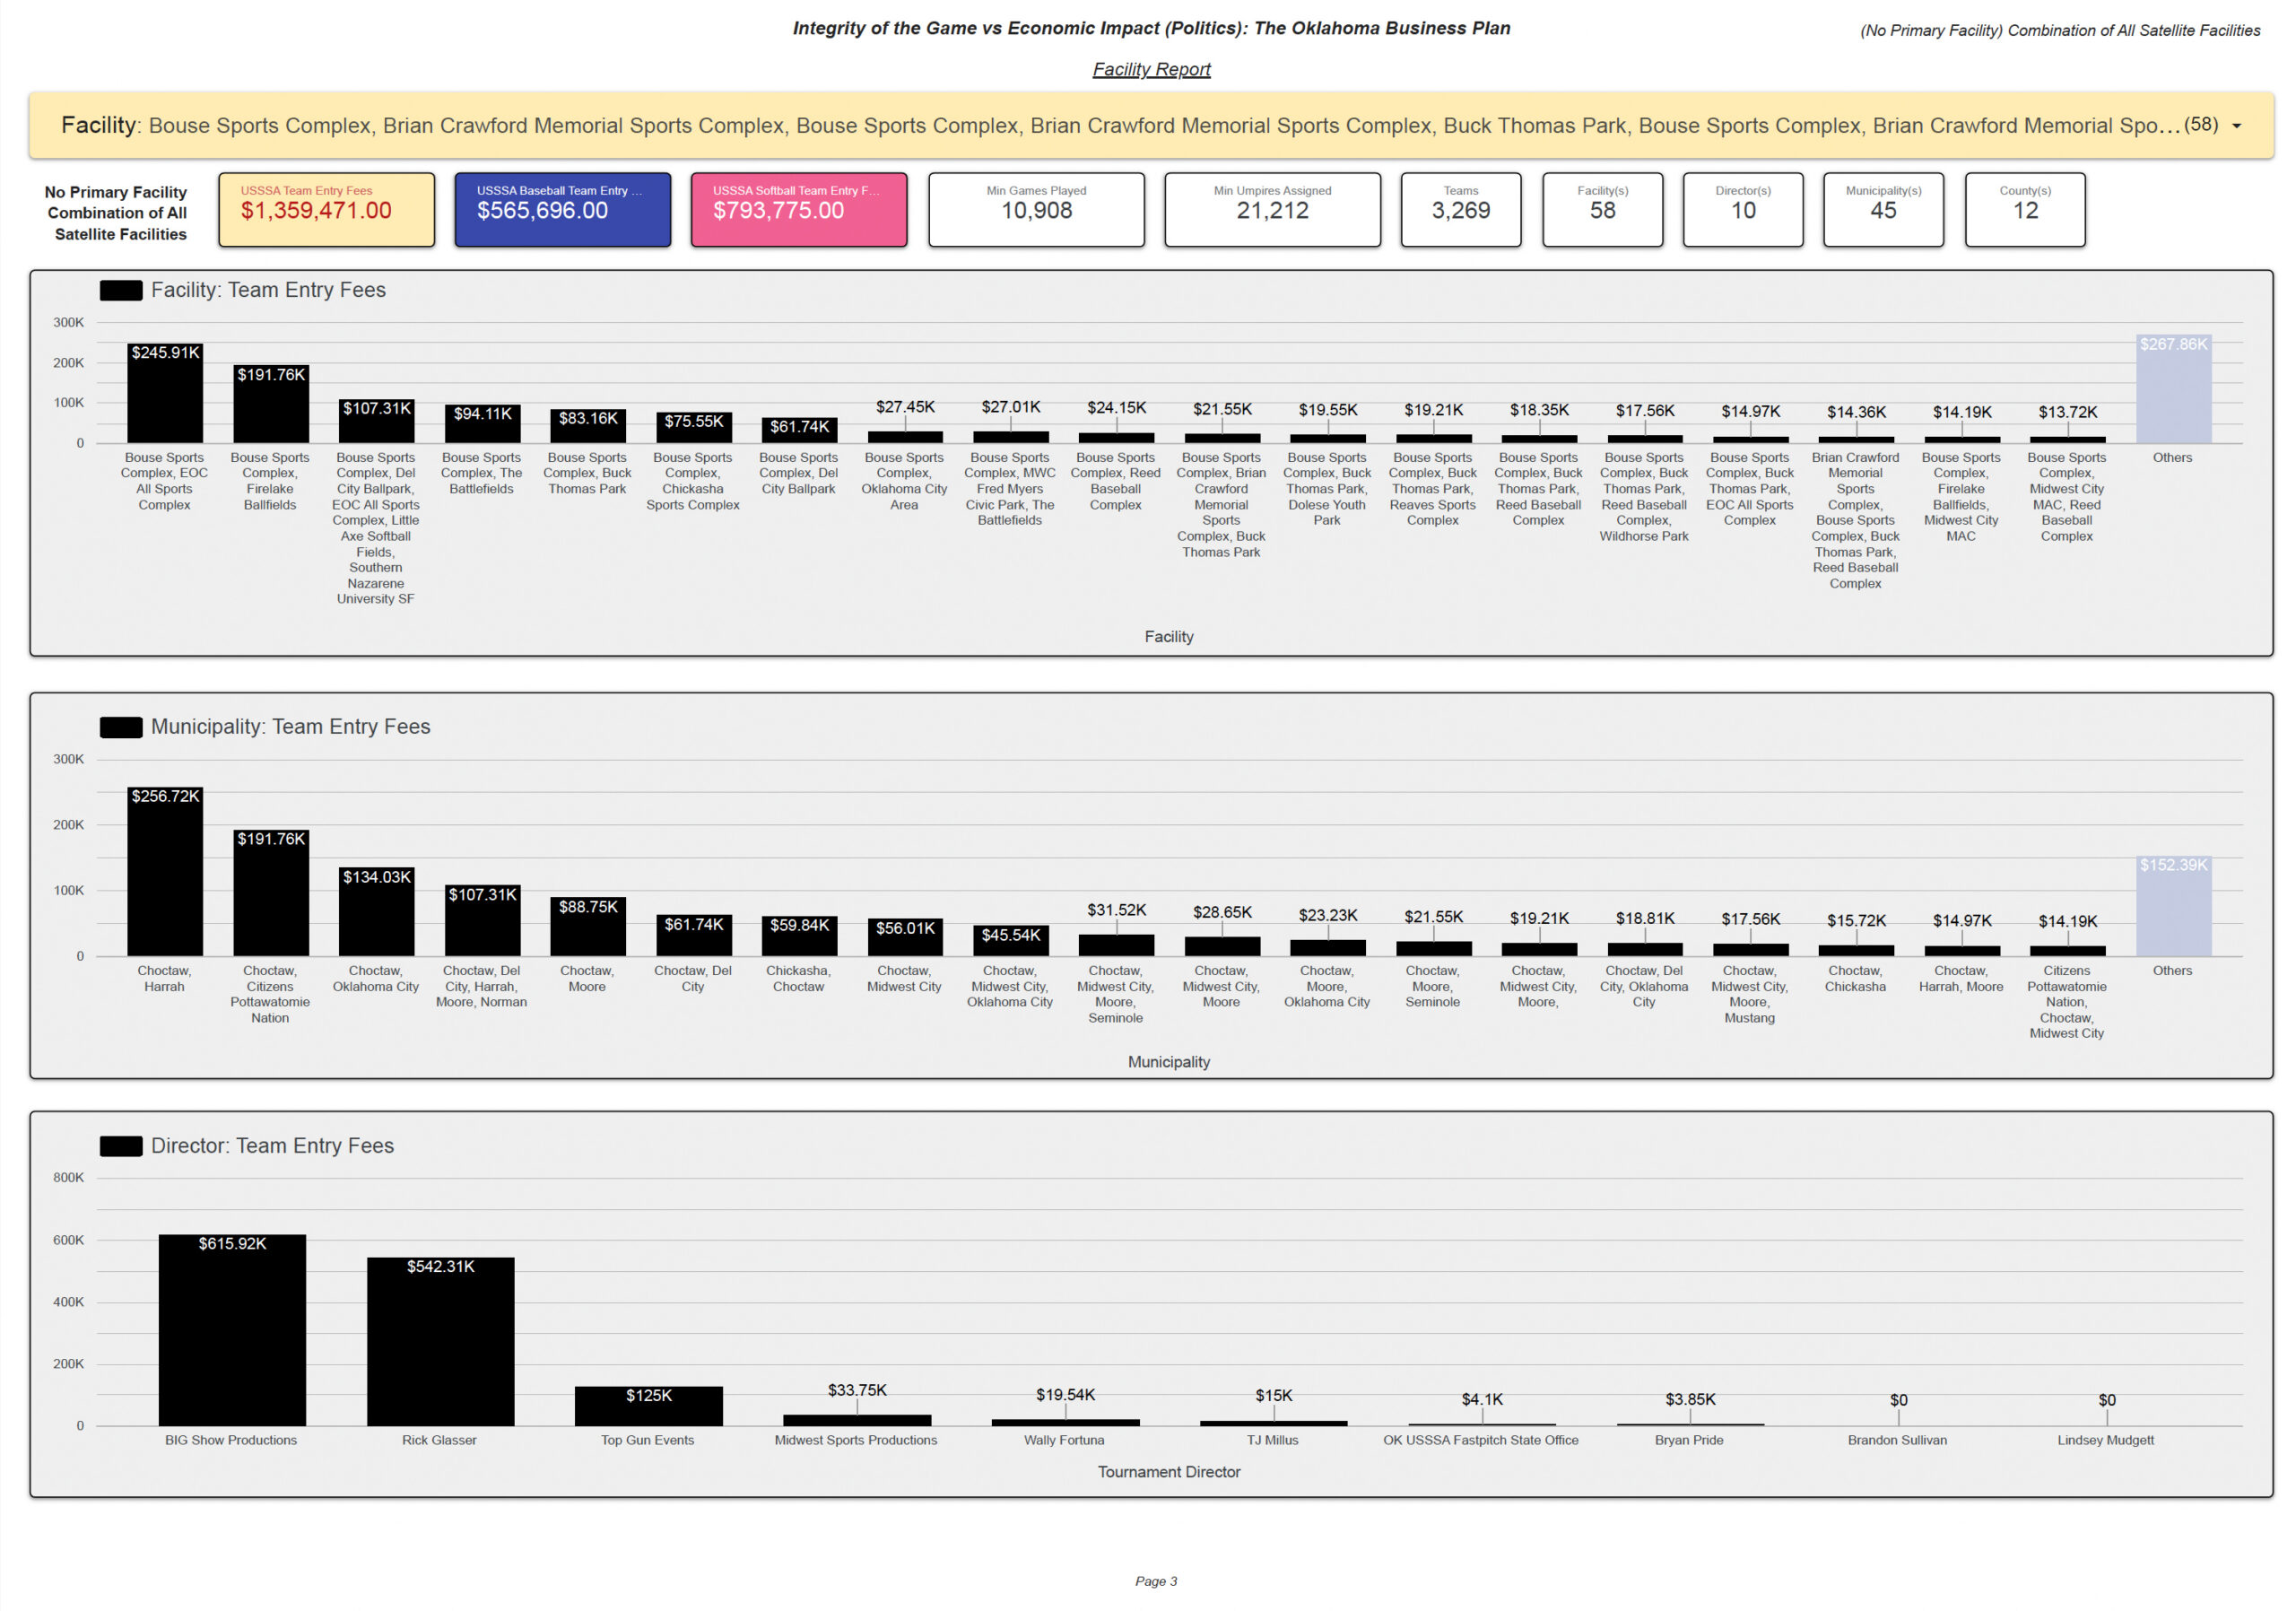
Associated Calculated Team Entry Fees
$1,359,471
Baseball
$565,696
Softball
$793,775
Teams
3,269
Minimum Games
10,908
Minimum Umpires Assigned
21,212
Facility / Combination Categories
58
Directors / Municipalities / Counties
10 / 45 / 12
Largest Displayed Multi-Facility Configurations
- Bouse Sports Complex + EOC All Sports Complex — $245.91K
- Bouse Sports Complex + Firelake Ballfields — $191.76K
- Bouse Sports Complex + Del City Ballpark + EOC All Sports Complex + Little Axe Softball Fields + Southern Nazarene University SF — $107.31K
- Bouse Sports Complex + The Battlefields — $94.11K
- Bouse Sports Complex + Buck Thomas Park — $83.16K
ASSOCIATION IS NOT ALLOCATION.
Each multi-facility amount is one pool of Calculated Team Entry Fee activity associated with the complete listed configuration. The report does not establish how teams, games, officials, fees, or other activity were distributed among individual locations.
Each multi-facility amount is one pool of Calculated Team Entry Fee activity associated with the complete listed configuration. The report does not establish how teams, games, officials, fees, or other activity were distributed among individual locations.
Page 4
Combined documented facility activity footprint
Pages 1-2 Direct Activity + Page 3 Associated Multi-Facility Activity = Page 4 Combined Documented Facility Activity Footprint. This is the broadest report view involving Bouse Sports Complex and must not be read as proof that every dollar, team, game, or official occurred exclusively at the Primary Facility.
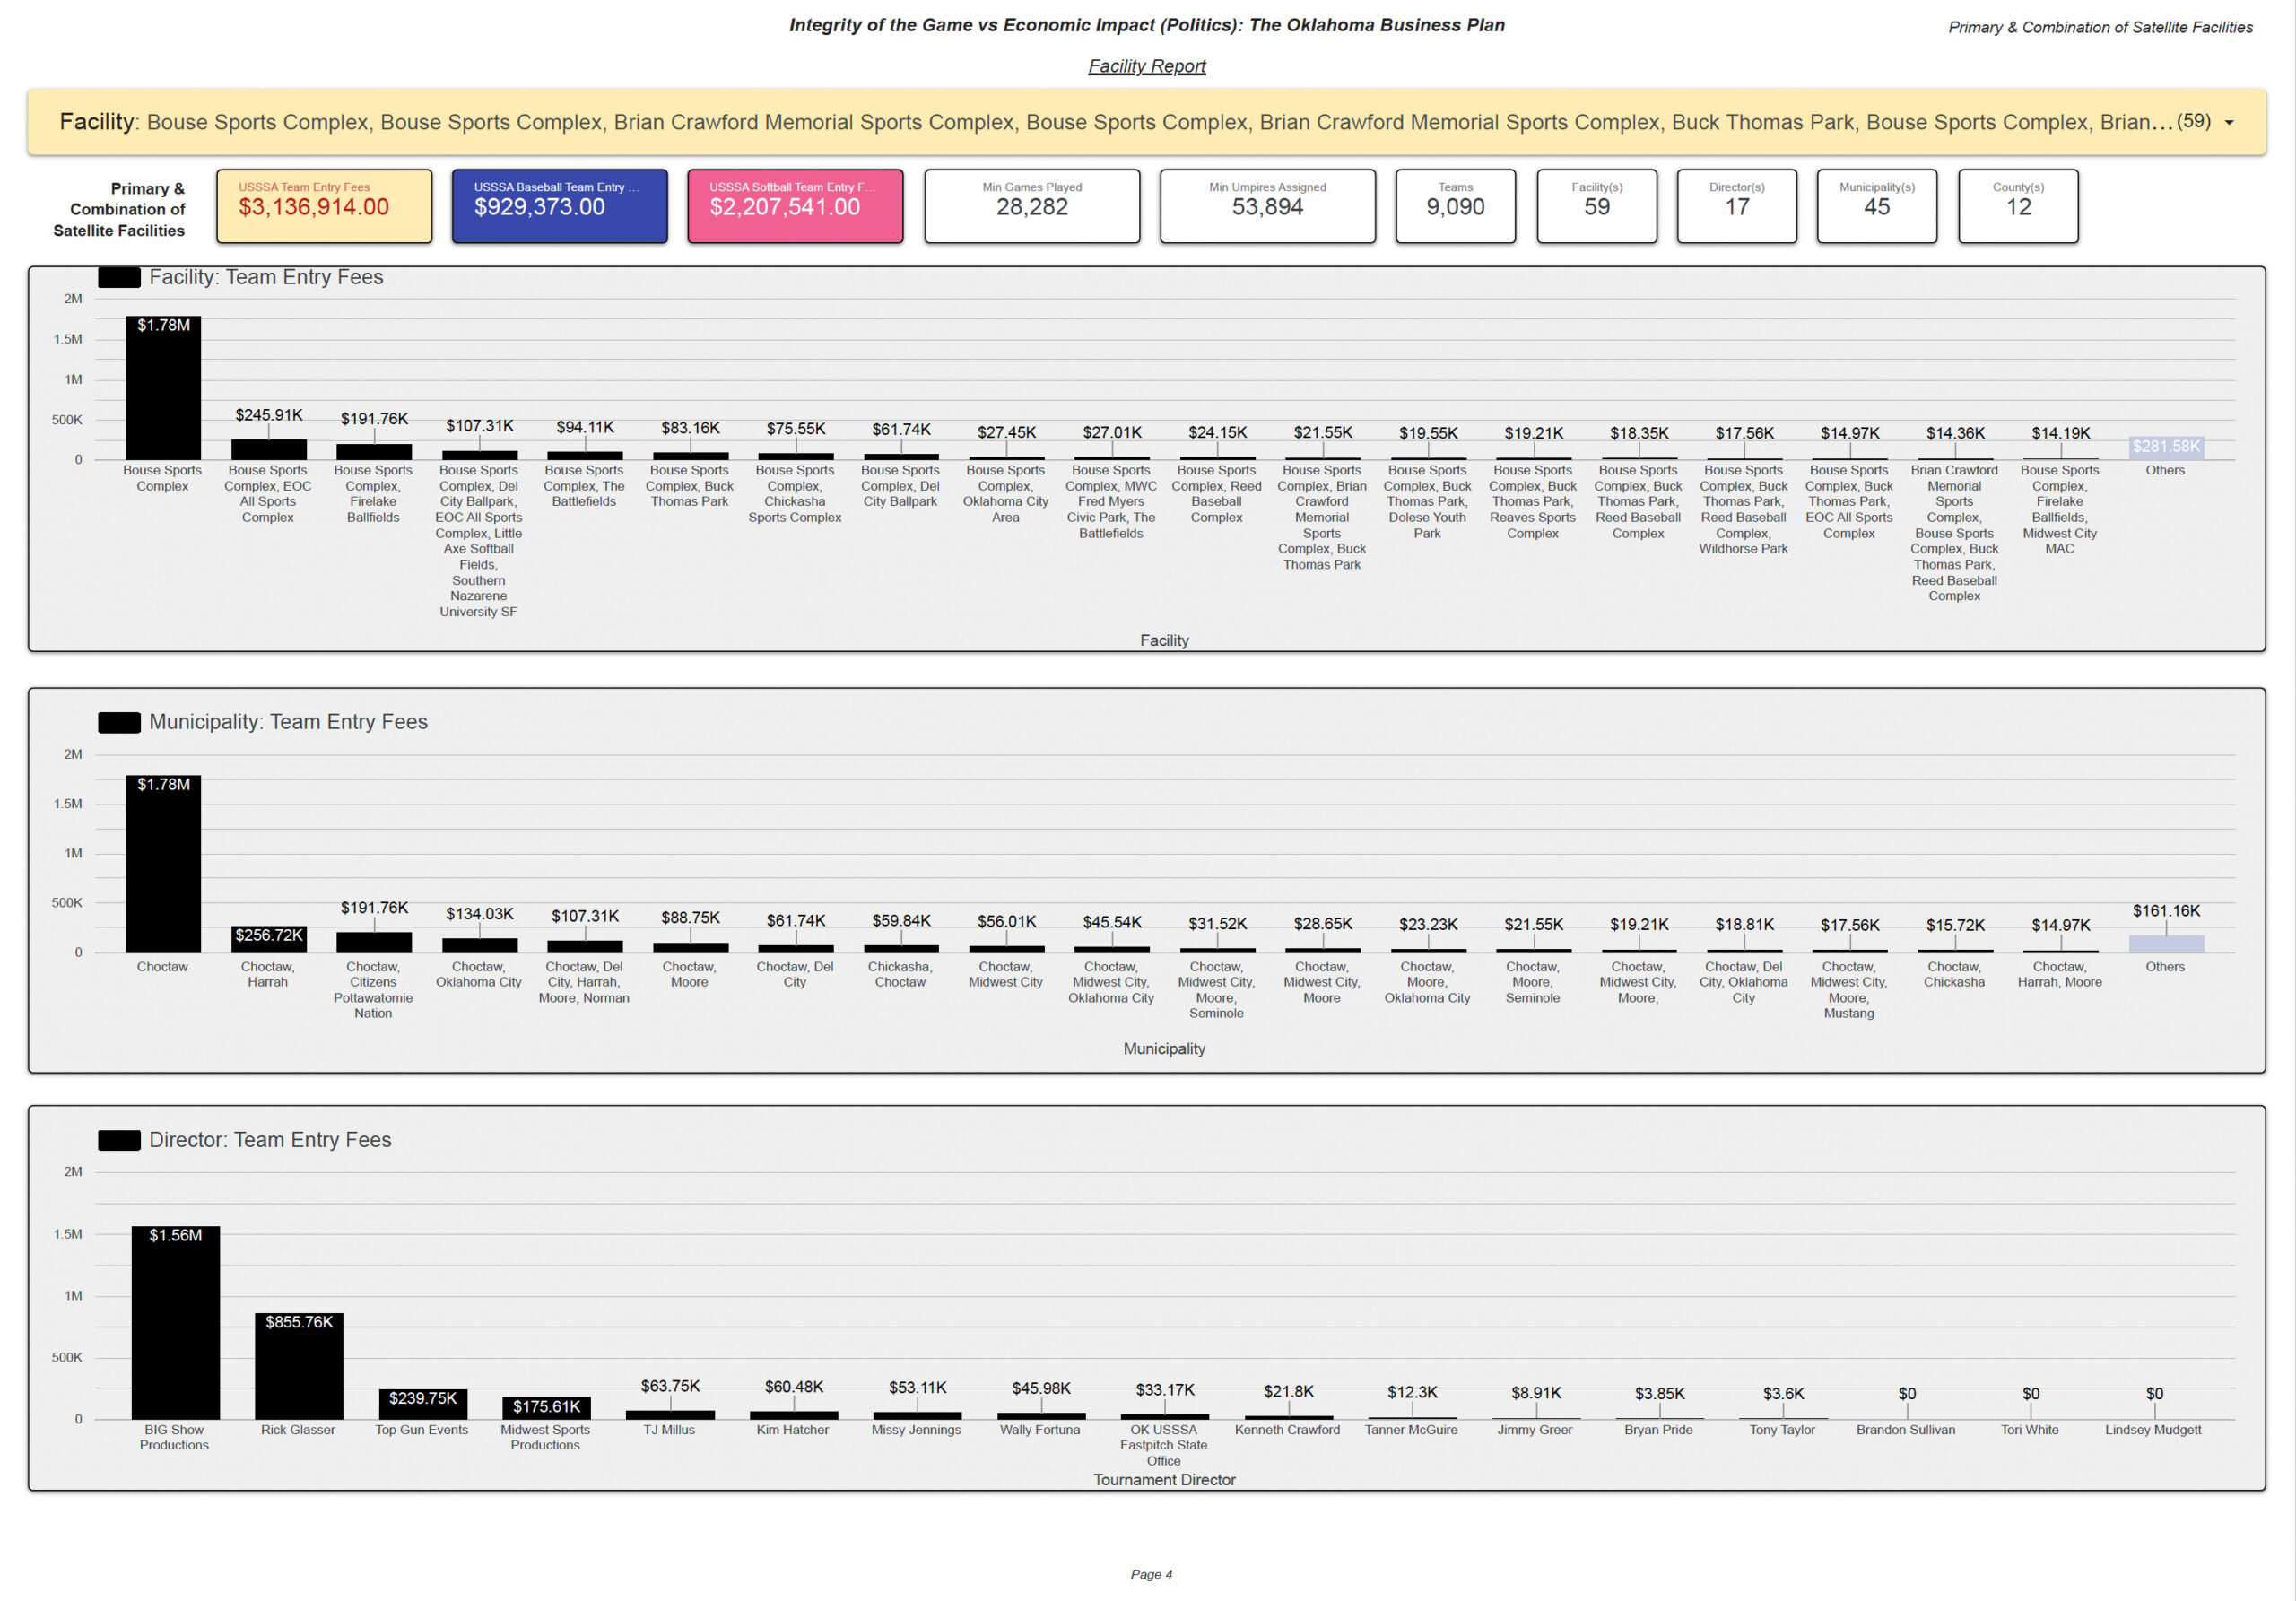
Combined Activity Footprint
| Calculated Team Entry Fees | $3,136,914 |
| Baseball | $929,373 |
| Softball | $2,207,541 |
| Teams | 9,090 |
| Minimum Games | 28,282 |
| Minimum Umpires Assigned | 53,894 |
| Facility / Combination Categories | 59 |
| Directors | 17 |
| Municipality Categories | 45 |
| Counties | 12 |
Leading Combined Director Concentrations
- BIG Show Productions — $1.56M
- Rick Glasser — $855.76K
- Top Gun Events — $239.75K
- Midwest Sports Productions — $175.61K
- TJ Millus — $63.75K
How to Read the Report
Direct, associated and combined populations
DIRECT
Pages 1-2: records listing Bouse Sports Complex independently as the event facility. Multi-facility combinations are excluded.
ASSOCIATED
Page 3: records where Bouse Sports Complex appears within a multi-site configuration. The full event-level value remains attached to the complete listed configuration.
COMBINED
Page 4: the combined documented activity footprint across the direct and associated populations. It is the broadest view, not an allocation to Bouse alone.
Association is not allocation. Multi-facility records establish that listed facilities were associated with the same event; they do not establish how teams, games, officials, fees, revenues, or other activity were allocated among individual locations.
Calculated Team Entry Fee Methodology
A calculated measure of documented activity
The report uses publicly available team counts and posted Team Entry Fees to create an analytical estimate of documented activity.
Participating Teams × Publicly Posted Team Entry Fee = Calculated Team Entry Fees
Calculated Team Entry Fees are not, by themselves, verified receipts, gross revenue, facility or municipal revenue, director compensation, USSSA corporate revenue, profit, taxable income, bank deposits, gate receipts, concession revenue, umpire compensation, tax liability, or audited financial statements.
Tournament & League Records
League activity and $0.00-fee interpretation
Direct League Activity
The direct Bouse Sports Complex scorecards identify 108 league teams and $19,988 in League Calculated Team Entry Fees.
$0.00 Public Listings
A publicly displayed $0.00 Team Entry Fee does not necessarily establish that an event generated no operational activity. It may reflect a free event, league structure, missing historical information, or another circumstance that cannot be determined from the public record alone. Unsupported local fees are not imputed.
Geographic & Director Network
Operational reach documented in the facility report
Direct Geography
The direct population is associated with Choctaw, one municipality and one county.
Associated Geography
The associated population expands to 45 municipality categories and 12 counties, reflecting the breadth of multi-facility configurations in the underlying records.
Director Network
The report identifies 15 director categories in the direct population, 10 in the associated population, and 17 in the combined footprint.
These relationships document event-record associations. They do not independently establish ownership, employment, lease terms, revenue sharing, contractual relationships, or financial allocation.
Facility Documentation
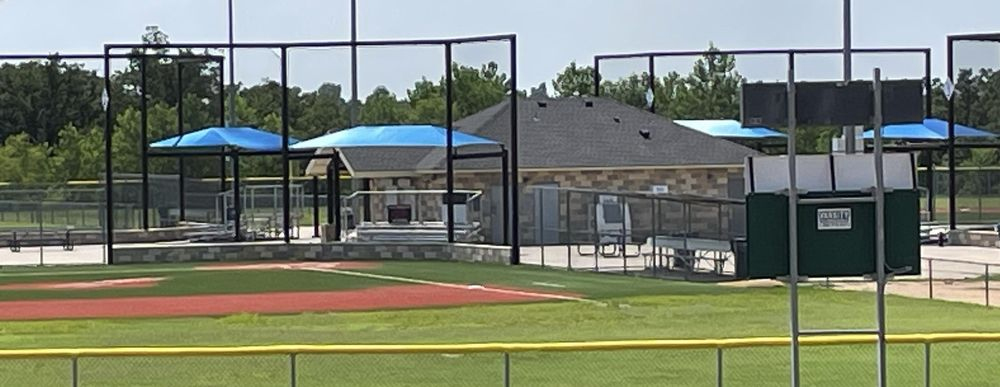
Bouse Sports Complex photographs
Supplied documentary images of the Bouse Sports Complex facility.
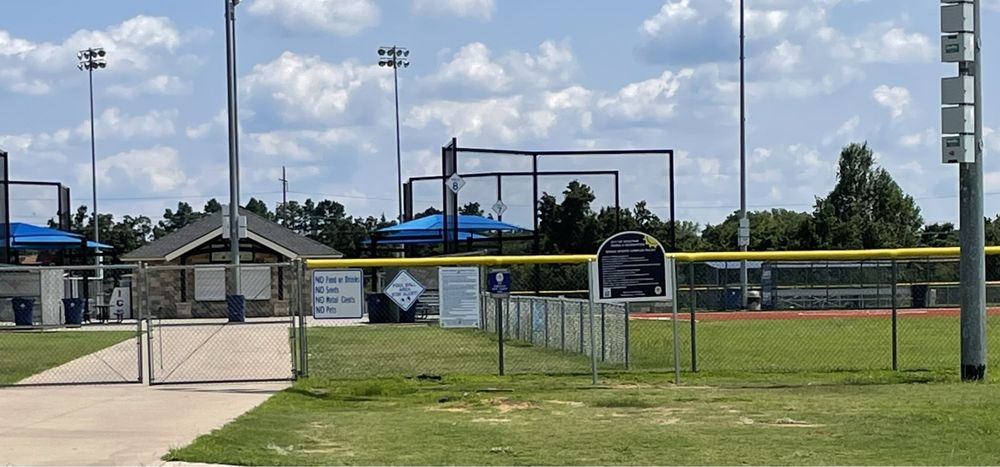

Report Image Gallery
Bouse Sports Complex Facility Report visuals
Full Facility Report
Seven-page facility report including Pages 1-4 analytical views, methodology and interpretation guide, dataset methodology/disclaimer, and accompanying research material.
Open Facility Report PDFFacility Summary
Professional summary of the direct, associated and combined facility activity populations and report limitations.
Open Facility Summary PDFEvidence Boundaries
What the profile establishes - and what it does not establish
Publicly documented / calculated
Not established by the dataset alone
- Actual payments collected or gross receipts
- Facility, municipal, tribal, director or USSSA revenue
- Director compensation, profit or taxable income
- Bank ownership or bank deposits
- Gate or concession revenue
- Rental payments or revenue sharing
- Allocation of multi-facility proceeds
- Locally collected fees not shown in the public record
- Ultimate disposition of funds
Facility-Specific Research Summary
Bouse Sports Complex analytical synthesis
Bouse Sports Complex has a substantial documented USSSA activity footprint across baseball and softball. The conservative direct population reports $1,777,443 in Calculated Team Entry Fees, including $363,677 baseball and $1,413,766 softball, associated with 5,821 teams, 17,374 minimum games, 32,682 minimum umpires assigned, 15 directors, 108 league teams, and $19,988 in League Calculated Team Entry Fees.
The highest displayed total and softball season is 2025, while the highest baseball season is 2023. BIG Show Productions is the largest direct director concentration at $942.93K. Page 3 adds $1,359,471 in associated multi-facility activity, including major configurations involving EOC All Sports Complex, Firelake Ballfields, Del City Ballpark, Little Axe Softball Fields, Southern Nazarene University SF, The Battlefields and Buck Thomas Park.
Together, the report presents a $3,136,914 combined documented activity footprint involving 9,090 teams, 28,282 minimum games, 53,894 minimum umpires assigned, 59 facility/facility-combination categories, 17 directors, 45 municipality categories, and 12 counties. Page 4 is the broadest documented activity footprint involving Bouse Sports Complex; it is not a claim that all activity occurred exclusively at the Primary Facility.
Research & Methodology Disclaimer
Independent research and analytical publication
The Hidden Valley - Integrity of the Game dataset is an independent research reconstruction based primarily on publicly accessible USSSA historical information. Historical records may contain incomplete fields, naming variations, reused or inconsistent identifiers, facility-name changes, zero-dollar listings, missing fields, or records later changed or removed.
This project is not an official USSSA report and is not represented as prepared, sponsored, endorsed, verified, or approved by USSSA, its directors or affiliates, any governmental entity, municipality, tribe, school district, facility owner, or other organization appearing in the research. Calculated figures are research estimates, not audits, tax determinations, forensic-accounting conclusions, legal findings, or allegations. Identification does not itself imply wrongdoing, misconduct, tax noncompliance, criminal activity, or civil liability.
Research the records. Follow the data. Preserve the distinction between documented fact, calculated activity, analytical inference, and conclusions requiring independent verification.