
Bentley Sports Complex
Oklahoma USSSA Facility Activity Profile | 2001–2026
Integrity of the Game vs Economic Impact (Politics): The Oklahoma Business Plan
Independent facility-level analysis of publicly available Oklahoma USSSA tournament and league information associated with Bentley Sports Complex in Bixby, Oklahoma.
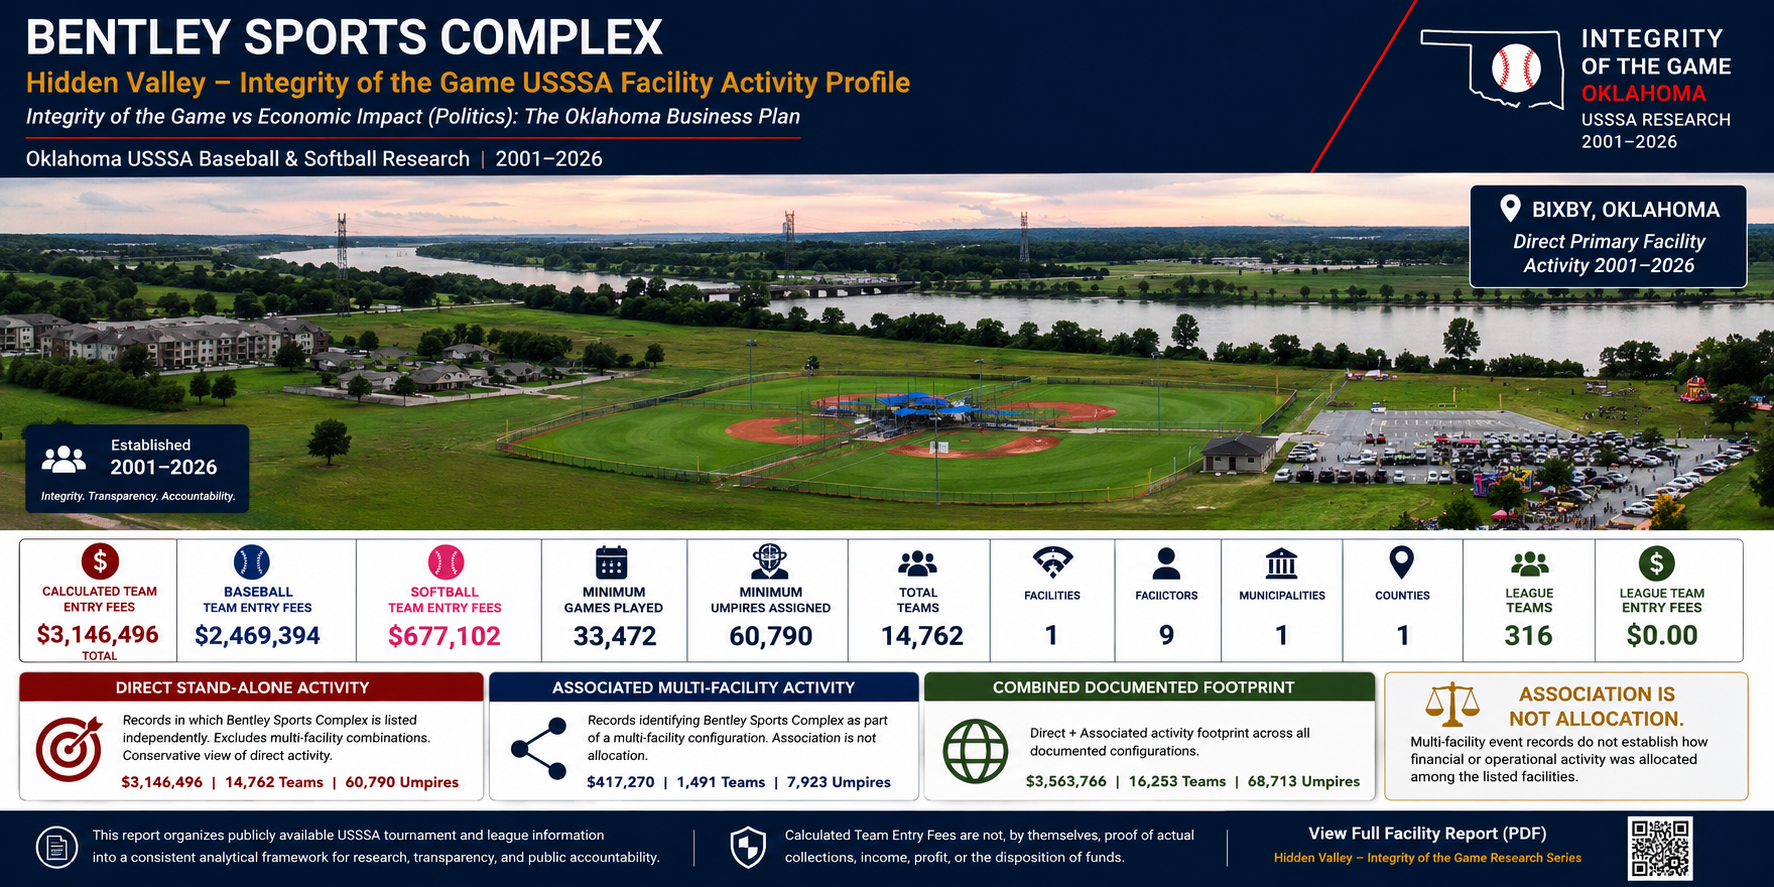
Primary Facility Snapshot — Direct / Stand-Alone Activity
Pages 1–2 isolate records in which Bentley Sports Complex is listed independently as the event facility. Multi-facility combinations are excluded, making this the report's most conservative facility-specific analytical population.
Page 1 — Direct Primary Facility Activity
The direct facility and municipality charts identify approximately $3.15M in Calculated Team Entry Fee activity associated with Bentley Sports Complex and Bixby. The director chart is led by Lynn Gibson — $2.24M, followed by Susan Gibson $442.93K, Rick Glasser $207.01K, Jace Sanchez $147.10K, Keith Kirk $44.05K, BIG Show Productions $31.09K, Wally Fortuna $18.21K, Bob Lomax $6.64K, and Julie Dingle $5.30K.

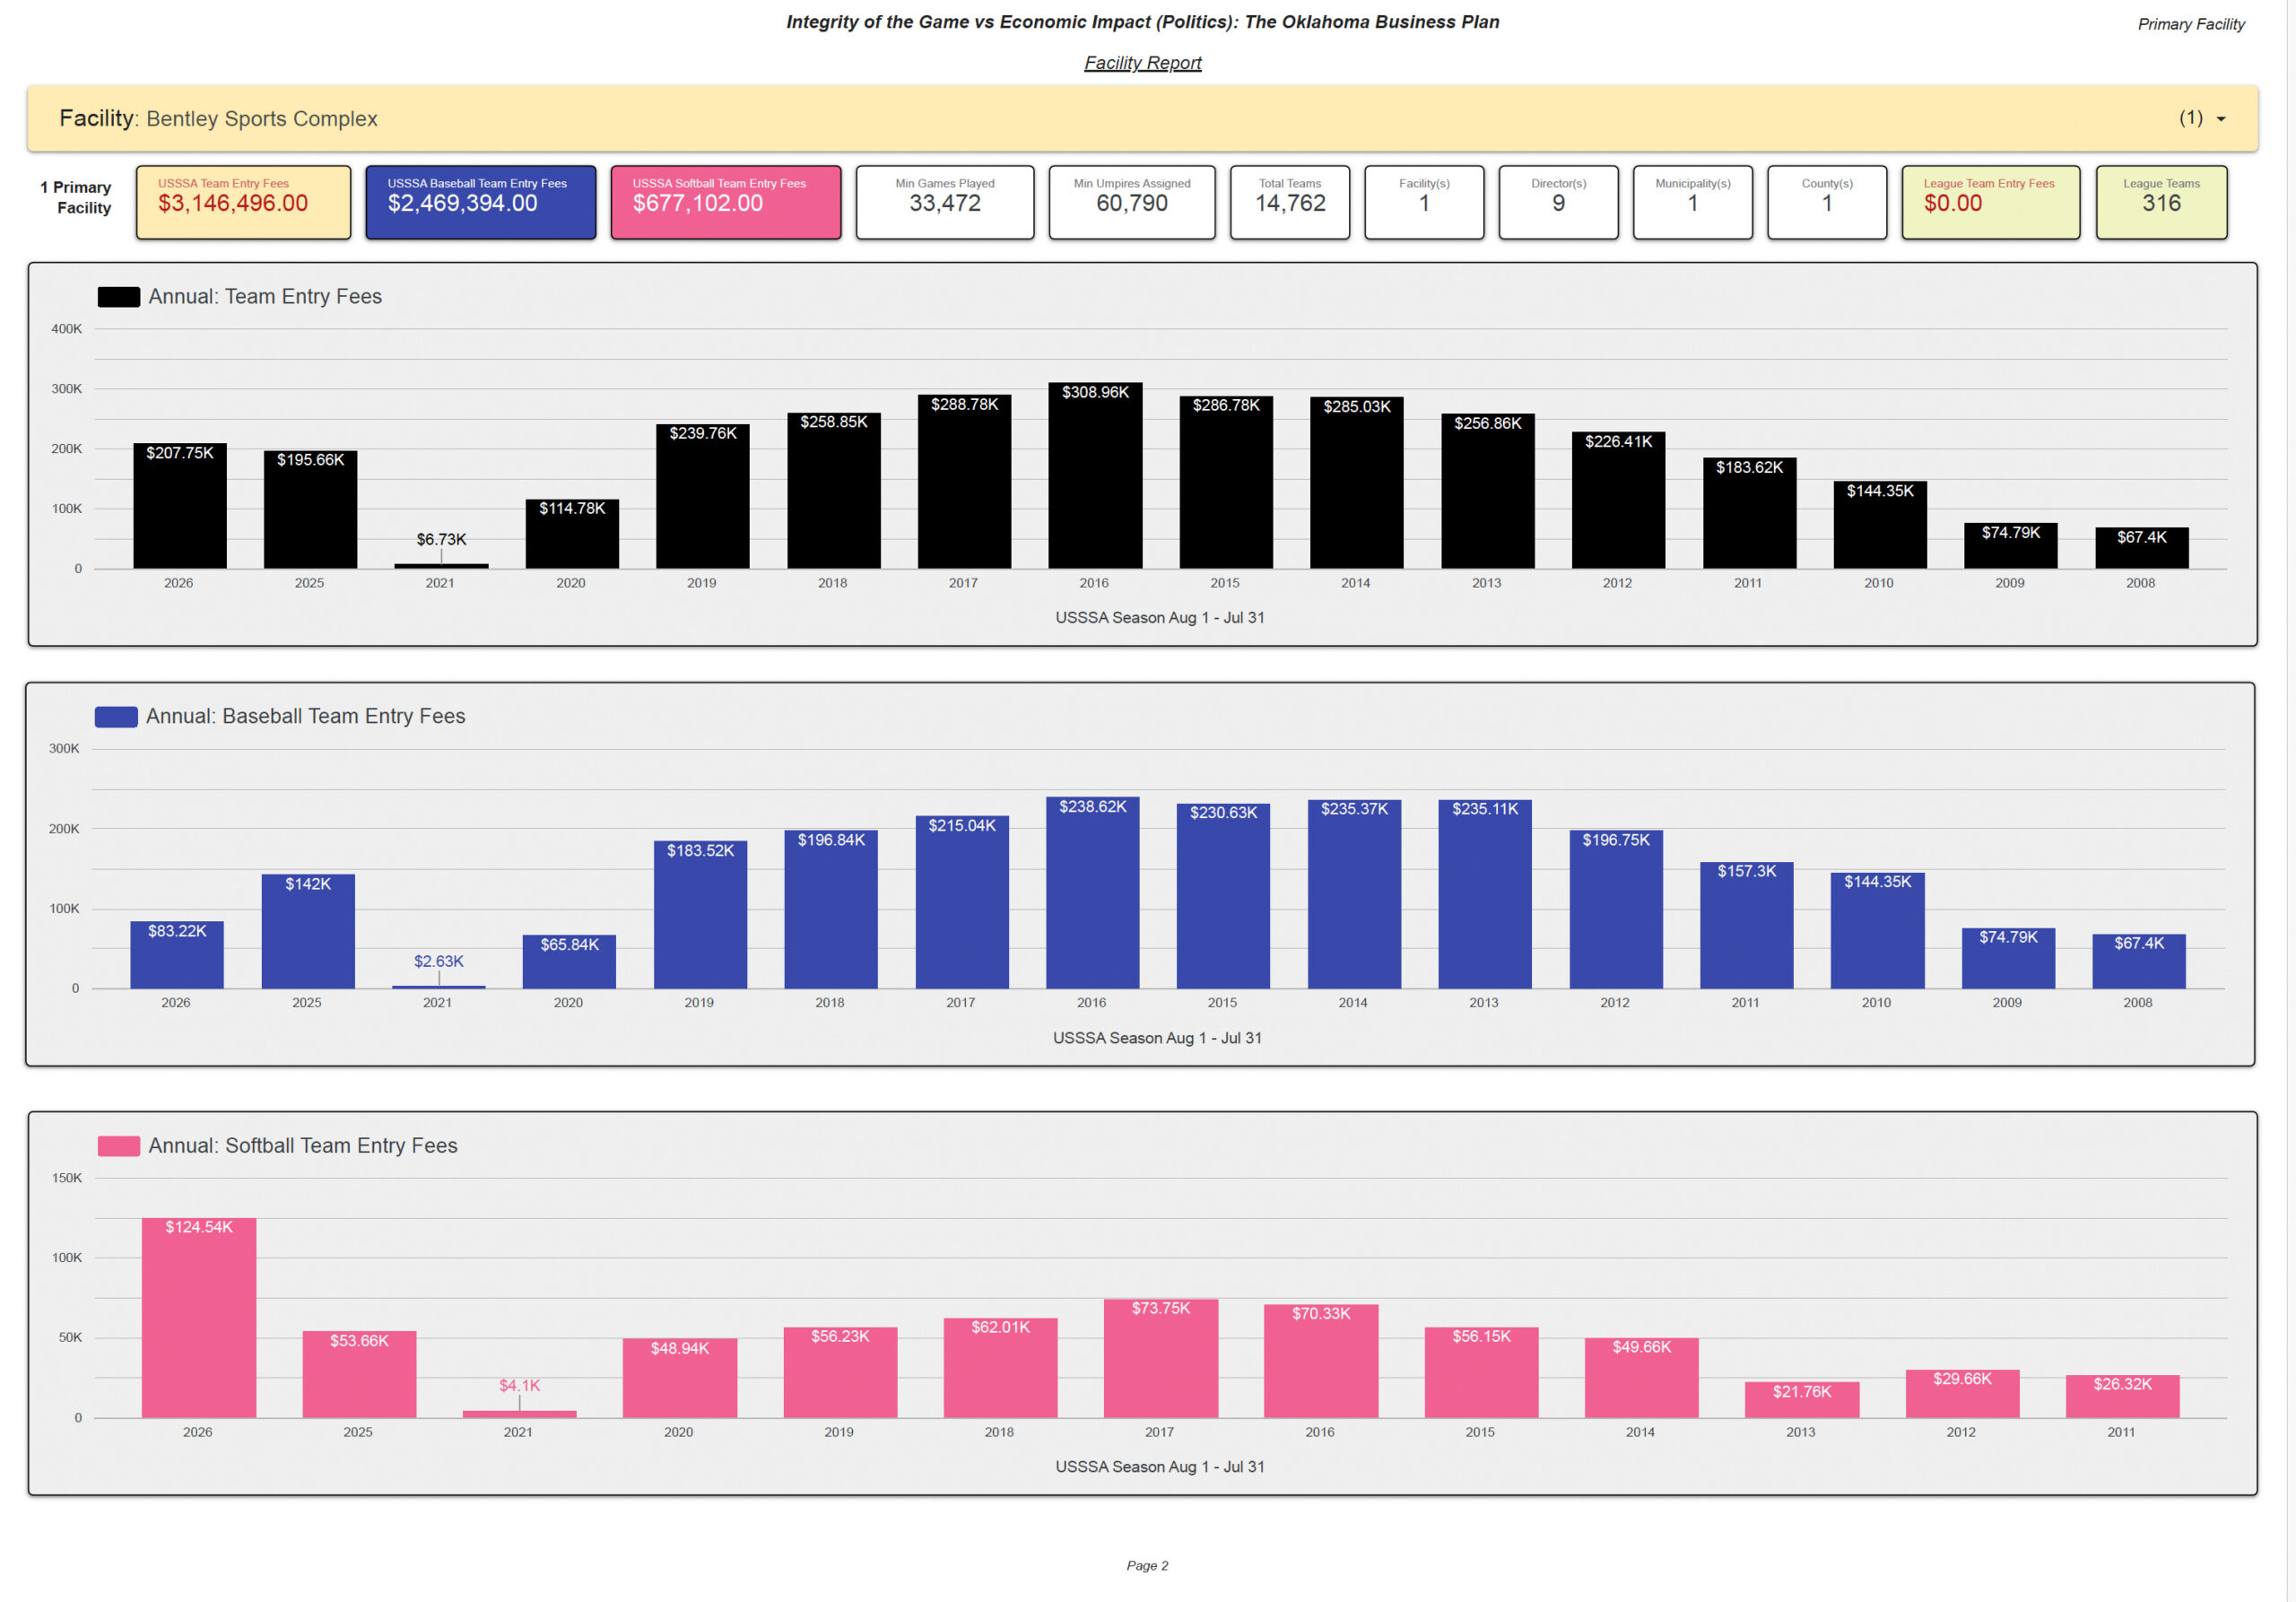
Page 2 — Annual & Sport Trends
Peak total season: 2016 — $308.96K. Peak baseball season: 2016 — $238.62K. Peak softball season: 2026 — $124.54K.
| Season | Total | Baseball | Softball |
|---|---|---|---|
| 2026 | $207.75K | $83.22K | $124.54K |
| 2025 | $195.66K | $142.00K | $53.66K |
| 2021 | $6.73K | $2.63K | $4.10K |
| 2020 | $114.78K | $65.84K | $48.94K |
| 2019 | $239.76K | $183.52K | $56.23K |
| 2018 | $258.85K | $196.84K | $62.01K |
| 2017 | $288.78K | $215.04K | $73.75K |
| 2016 | $308.96K | $238.62K | $70.33K |
| 2015 | $286.78K | $230.63K | $56.15K |
| 2014 | $285.03K | $235.37K | $49.66K |
| 2013 | $256.86K | $235.11K | $21.76K |
| 2012 | $226.41K | $196.75K | $29.66K |
| 2011 | $183.62K | $157.30K | $26.32K |
| 2010 | $144.35K | $144.35K | — |
| 2009 | $74.79K | $74.79K | — |
| 2008 | $67.40K | $67.40K | — |
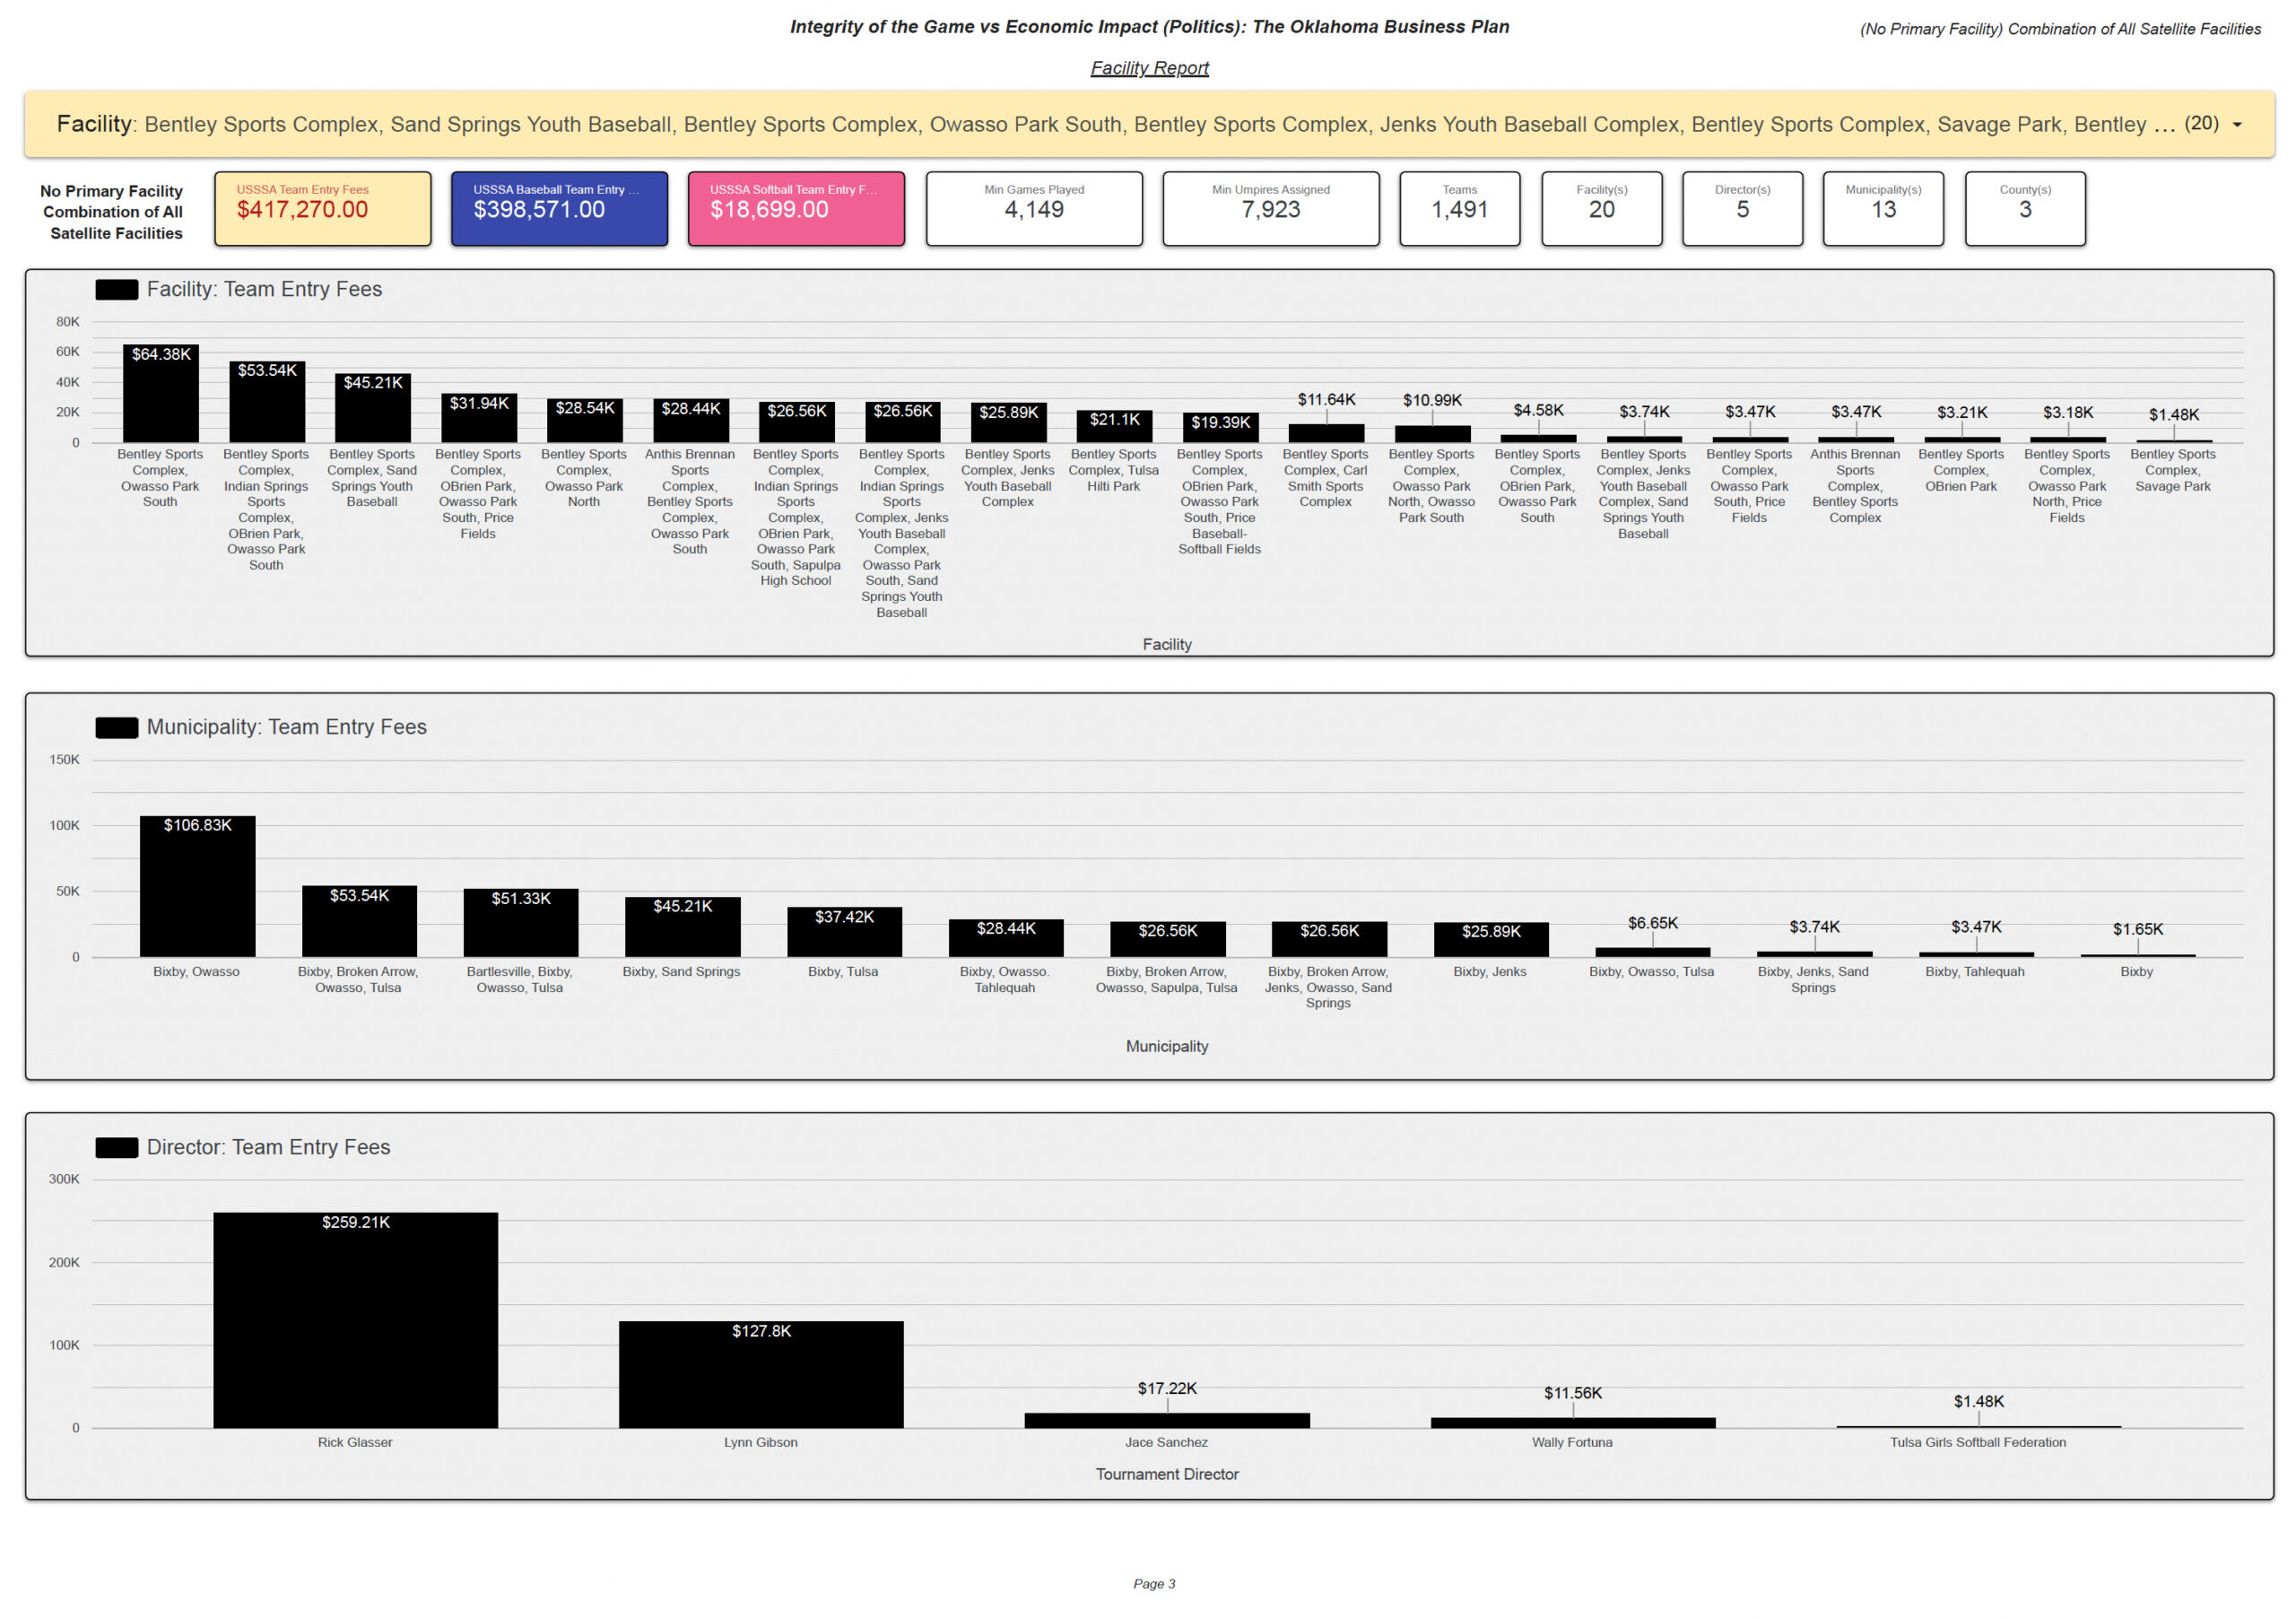
Page 3 — Associated Multi-Facility / Satellite Activity
Page 3 excludes the stand-alone Bentley Sports Complex population and examines records in which Bentley Sports Complex appears with one or more additional facilities. This population identifies $417,270 in Calculated Team Entry Fees, including $398,571 baseball and $18,699 softball. It represents 1,491 teams, 4,149 minimum games, 7,923 minimum umpires assigned, 20 facilities, 5 directors, 13 municipalities, and 3 counties.
Leading Multi-Facility Configurations
Bentley Sports Complex + Owasso Park South — $64.38K; Bentley Sports Complex + Indian Springs Sports Complex + OBrien Park + Owasso Park South — $53.54K; Bentley Sports Complex + Sand Springs Youth Baseball — $45.21K; Bentley Sports Complex + OBrien Park + Owasso Park South + Price Fields — $31.94K.
Associated Director Categories
Rick Glasser $259.21K; Lynn Gibson $127.80K; Jace Sanchez $17.22K; Wally Fortuna $11.56K; Tulsa Girls Softball Federation $1.48K.
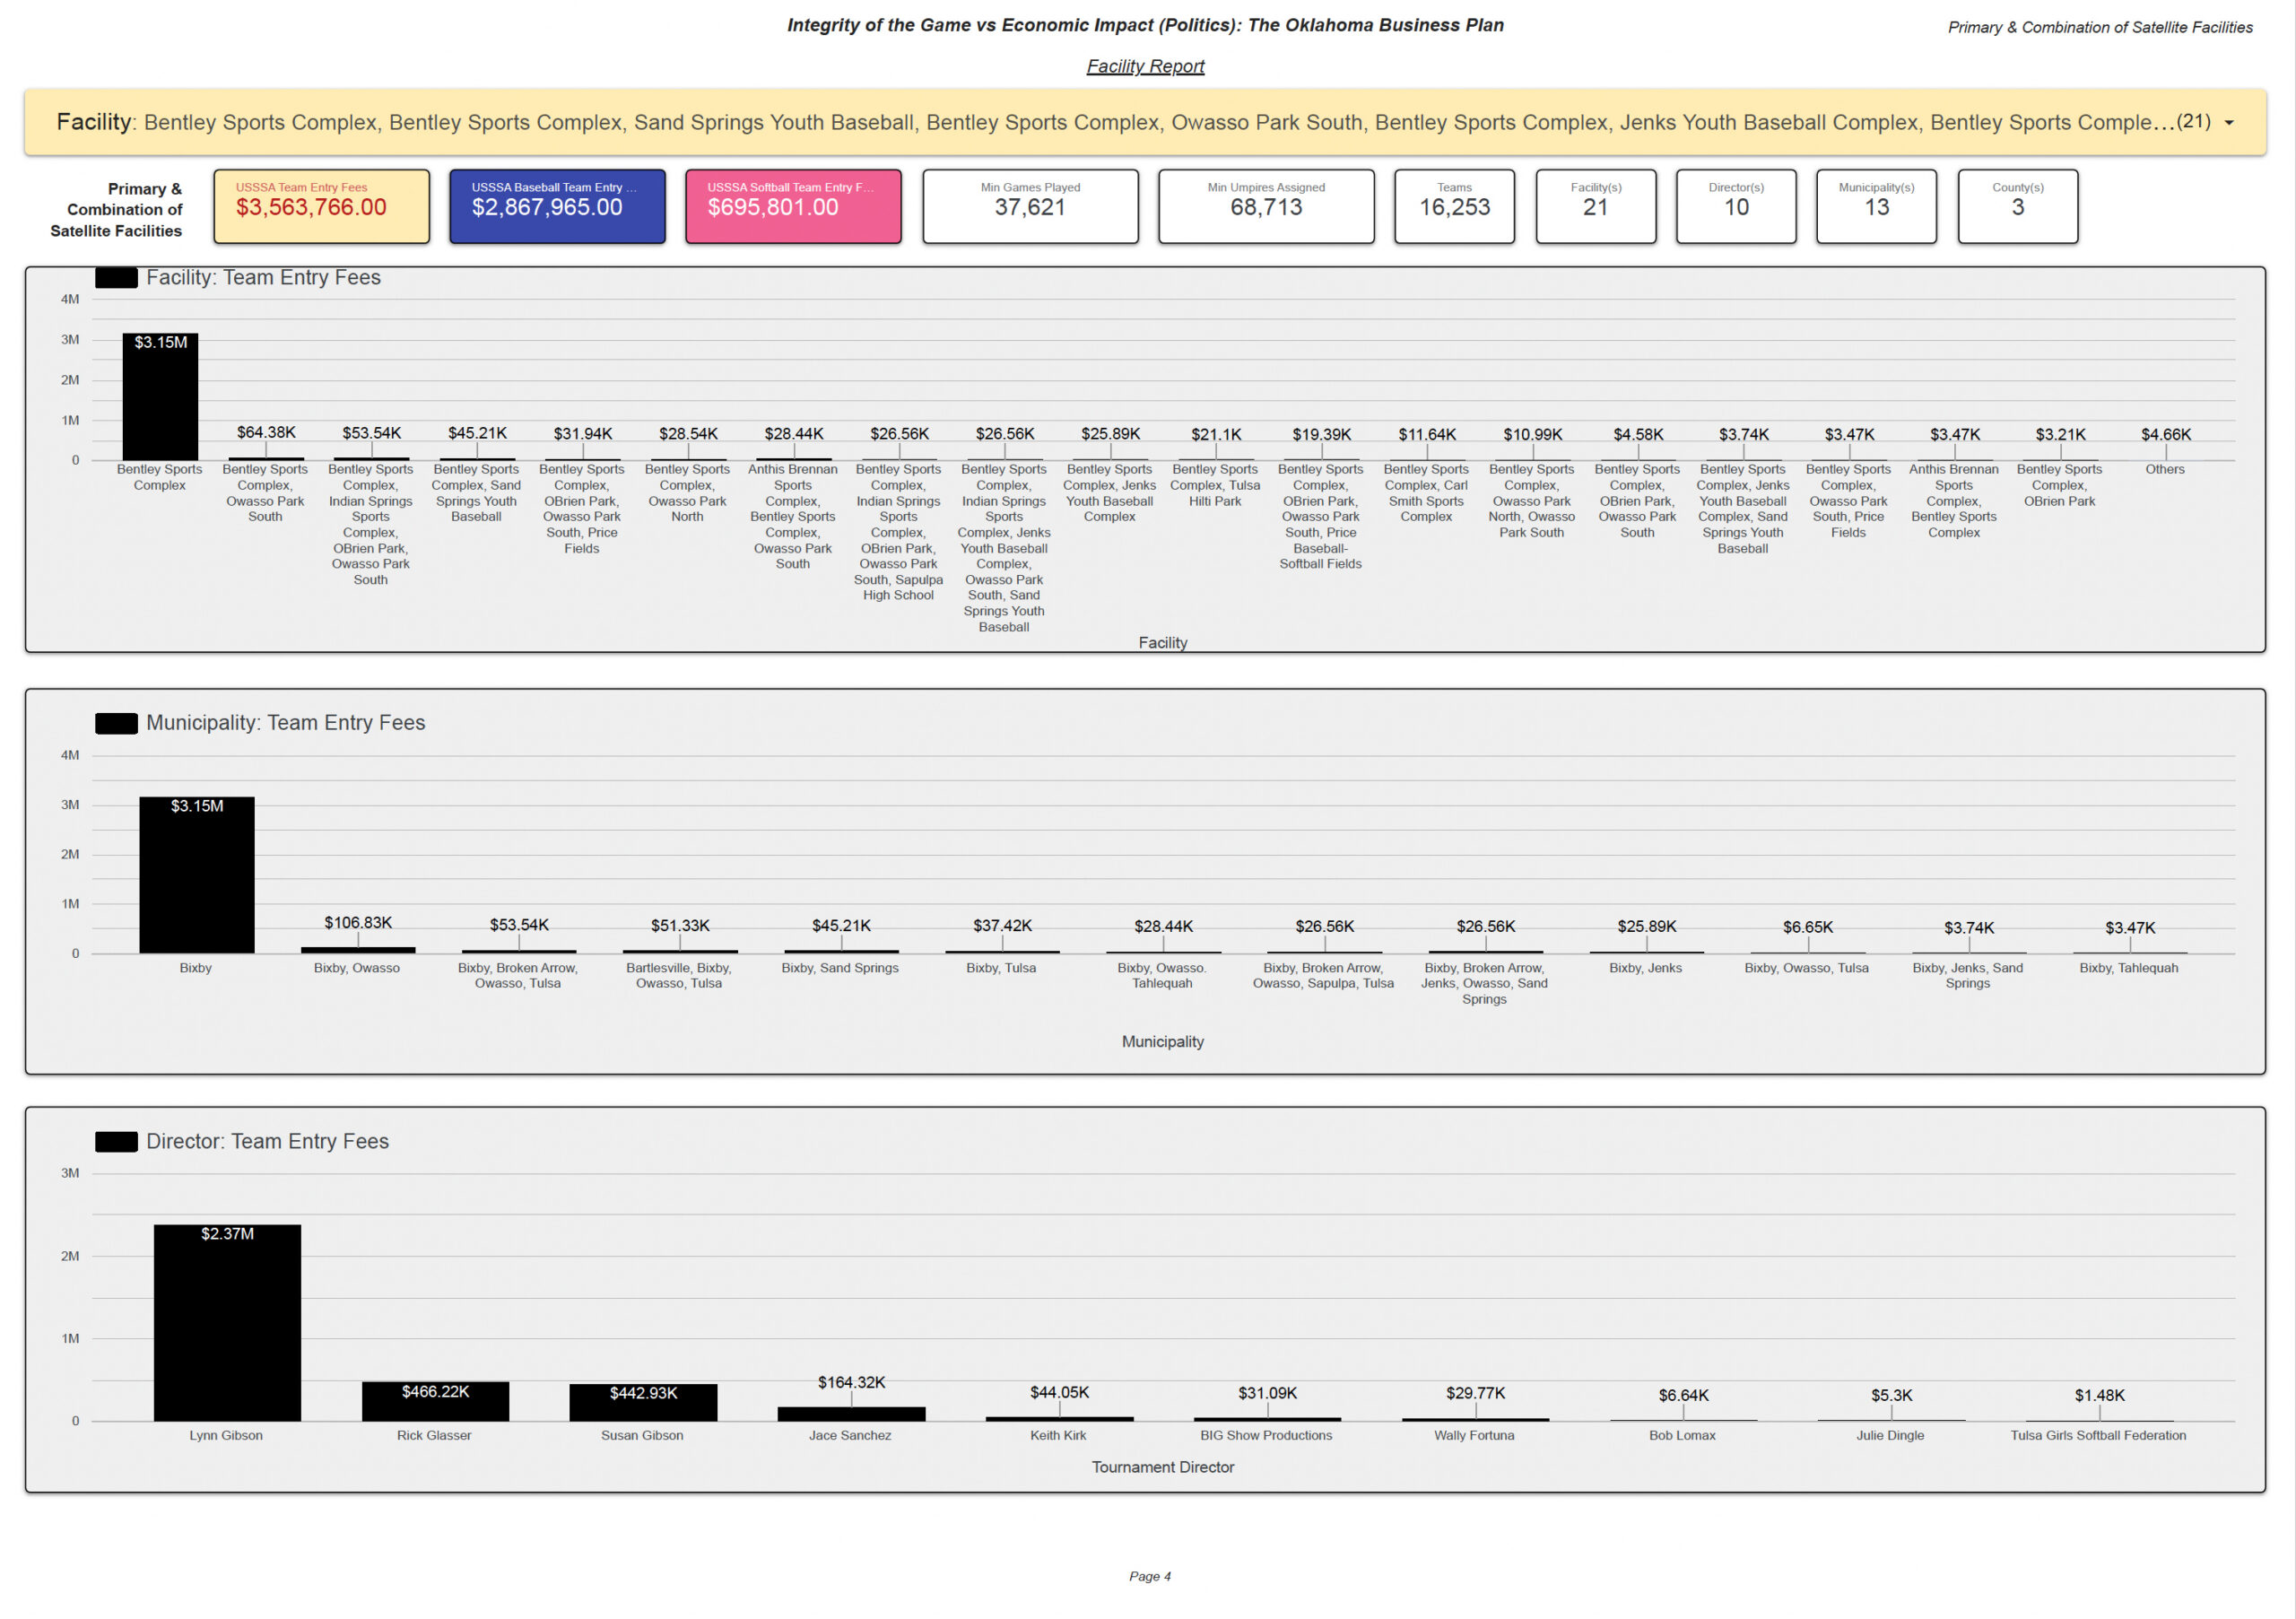
Page 4 — Combined Documented Facility Activity Footprint
Pages 1–2 Direct Activity + Page 3 Associated Multi-Facility Activity = Page 4 Combined Documented Facility Activity Footprint.
The combined director chart is led by Lynn Gibson — $2.37M, followed by Rick Glasser $466.22K, Susan Gibson $442.93K, Jace Sanchez $164.32K, Keith Kirk $44.05K, BIG Show Productions $31.09K, Wally Fortuna $29.77K, Bob Lomax $6.64K, Julie Dingle $5.30K, and Tulsa Girls Softball Federation $1.48K.
Direct / Associated / Combined
DIRECT
Records listing Bentley Sports Complex independently as the Primary Facility.
ASSOCIATED
Records in which Bentley Sports Complex appears within multi-site configurations.
COMBINED
Both analytical populations together as the broadest documented activity footprint.
Calculated Team Entry Fee Methodology
Participating Teams × Publicly Posted Team Entry Fee = Calculated Team Entry Fees
The calculation is applied at the applicable event-record level and aggregated for analysis.
Tournament / League / $0.00-Fee Activity
The dataset contains tournament and league records. Bentley Sports Complex displays 316 League Teams and League Team Entry Fees: $0.00. The public value is preserved rather than replaced with an unsupported estimate. A $0.00 listing does not necessarily establish that no operational activity occurred.
Geographic & Director Network
The direct population identifies Bixby as the municipality and one county. Multi-facility records expand the documented network into 13 municipalities and 3 counties. These are event-record associations; they do not establish ownership, employment, revenue sharing, or contractual relationships.
The report identifies nine direct director categories, led by Lynn Gibson. The associated population includes five director categories, led by Rick Glasser. The combined footprint includes ten director categories, led by Lynn Gibson. These concentrations describe calculated activity associated with director categories and should not be interpreted as personal income or receipts.
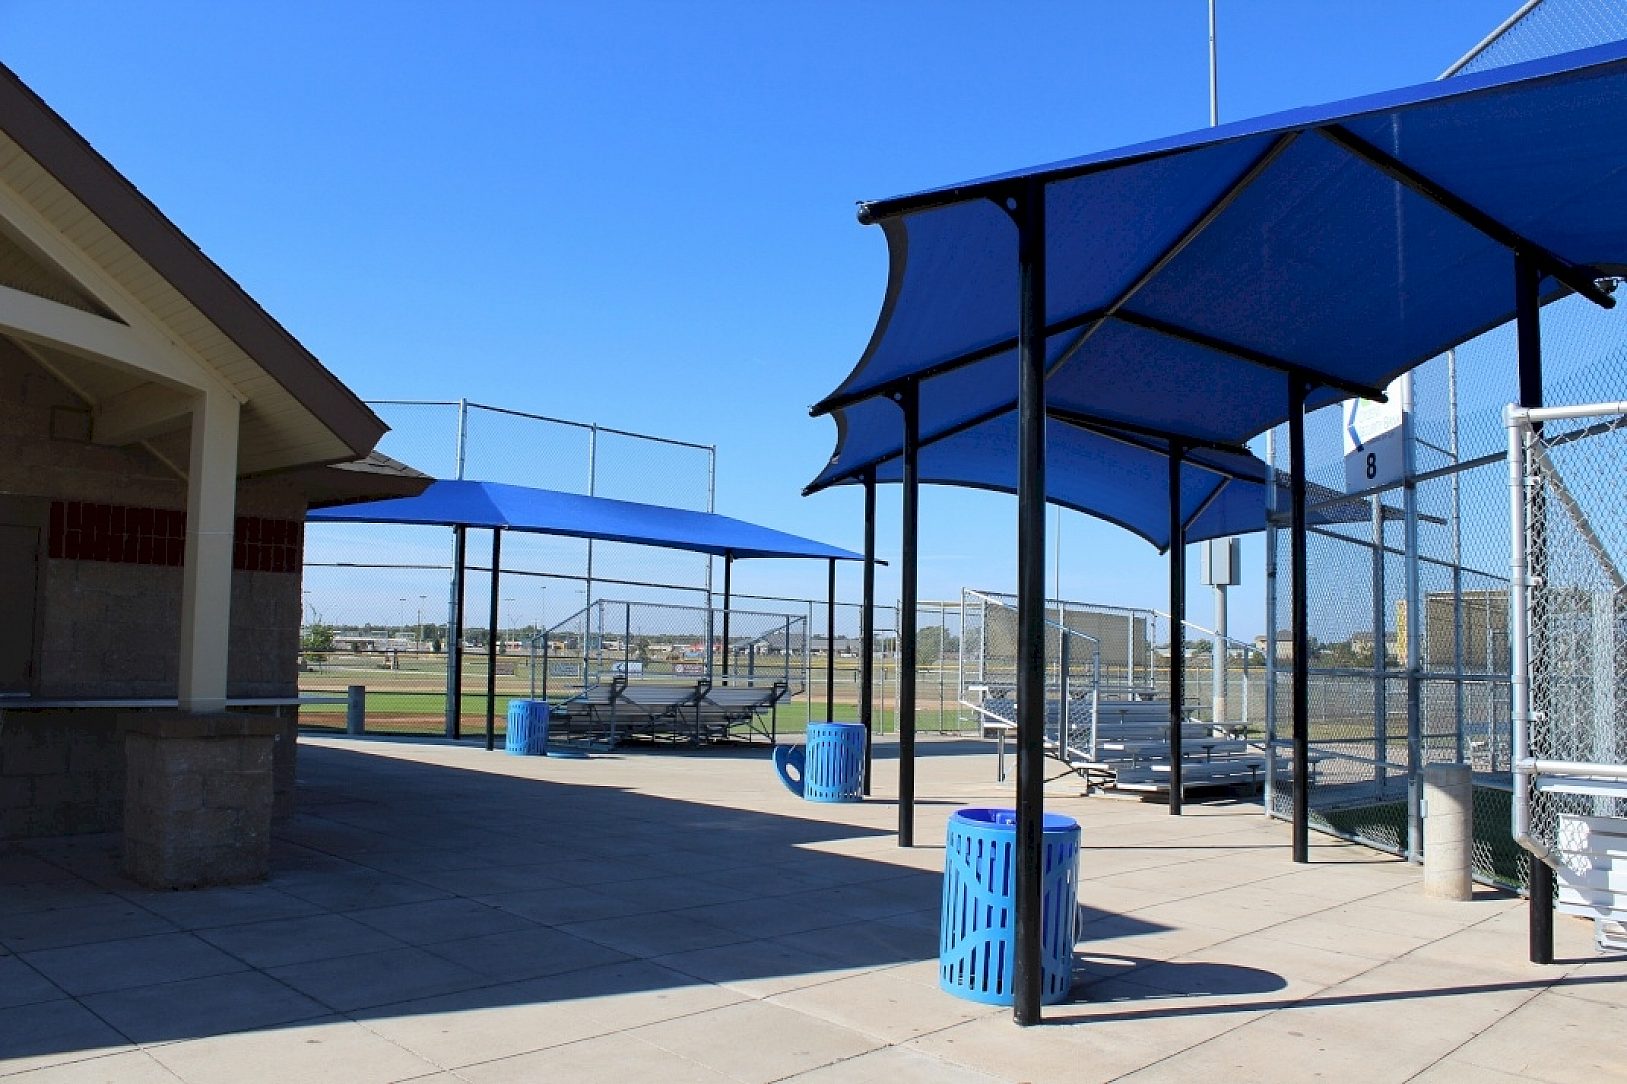
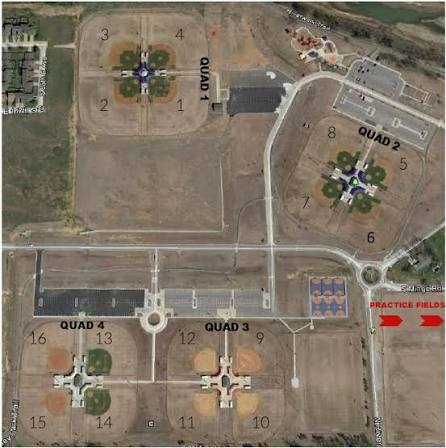
Actual Bentley Sports Complex Facility Images
These supplied photographs document the facility itself and are presented separately from the analytical financial and operational data.

Facility Report Image Gallery & Document Access

What This Profile Establishes — and What It Does Not
Publicly Documented / Calculated
Facility associations; teams; sports; seasons; minimum games and umpires; director categories; municipalities; counties; posted fees; Calculated Team Entry Fees; and tournament/league activity.
Not Established by This Dataset Alone
Actual receipts; facility or municipal revenue; director compensation; profits; taxable income; bank ownership; rental payments; revenue sharing; allocation of multi-facility proceeds; locally collected fees; or ultimate disposition of funds unless independently documented.
Facility-Specific Research Summary
Bentley Sports Complex has a substantial documented USSSA activity footprint dominated by baseball. The direct stand-alone population identifies $3,146,496 in Calculated Team Entry Fees associated with 14,762 teams, including $2,469,394 baseball and $677,102 softball. It also identifies 33,472 minimum games, 60,790 minimum umpires assigned, 316 league teams, and $0.00 League Team Entry Fees.
The annual series shows sustained activity across the displayed 2008–2026 seasons, with 2016 the highest displayed total and baseball season and 2026 the highest displayed softball season. The direct director chart is led by Lynn Gibson.
Associated multi-facility records identify another $417,270 in Calculated Team Entry Fees, including $398,571 baseball and $18,699 softball, across 1,491 teams, 4,149 minimum games, 7,923 minimum umpires assigned, 20 facilities, 5 directors, 13 municipalities, and 3 counties. The largest displayed associated configuration is Bentley Sports Complex + Owasso Park South at $64.38K.
Together, the direct and associated populations form a $3,563,766 combined documented facility activity footprint involving 16,253 teams, 37,621 minimum games, 68,713 minimum umpires assigned, 21 facilities, 10 directors, 13 municipalities, and 3 counties. This combined footprint measures documented association across all applicable records; it does not establish that all activity occurred exclusively at Bentley Sports Complex.
Research & Methodology Disclaimer
Integrity of the Game vs Economic Impact (Politics): The Oklahoma Business Plan and the Hidden Valley — Integrity of the Game dataset are independent research products created for research, educational, public-interest, transparency, and analytical purposes.
This is not an official USSSA report and is not represented as prepared, sponsored, endorsed, verified, or approved by USSSA, its directors or affiliates, any governmental entity, municipality, tribe, school district, facility owner, director, or other organization appearing in the research.
Calculated financial figures are research estimates derived from publicly available information and the stated methodology. They are not audits, tax determinations, forensic-accounting conclusions, legal findings, or allegations of wrongdoing. Identification of a person, organization, facility, municipality, or other entity does not itself imply misconduct, tax noncompliance, criminal activity, or civil liability.