
Lynn Gibson
USSSA Director Activity Profile: Lynn Gibson
Independent analysis of publicly available Oklahoma USSSA activity associated with Lynn Gibson, including tournament and league activity, sport, teams, divisions, minimum games, minimum required officials, Calculated Team Entry Fees, seasons, municipalities, counties and facilities.
USSSA Classification: Area Director
USSSA materials classify Tournament Directors at the state level and below as Area Directors. USSSA appointees generally operate as independent contractors rather than employees.
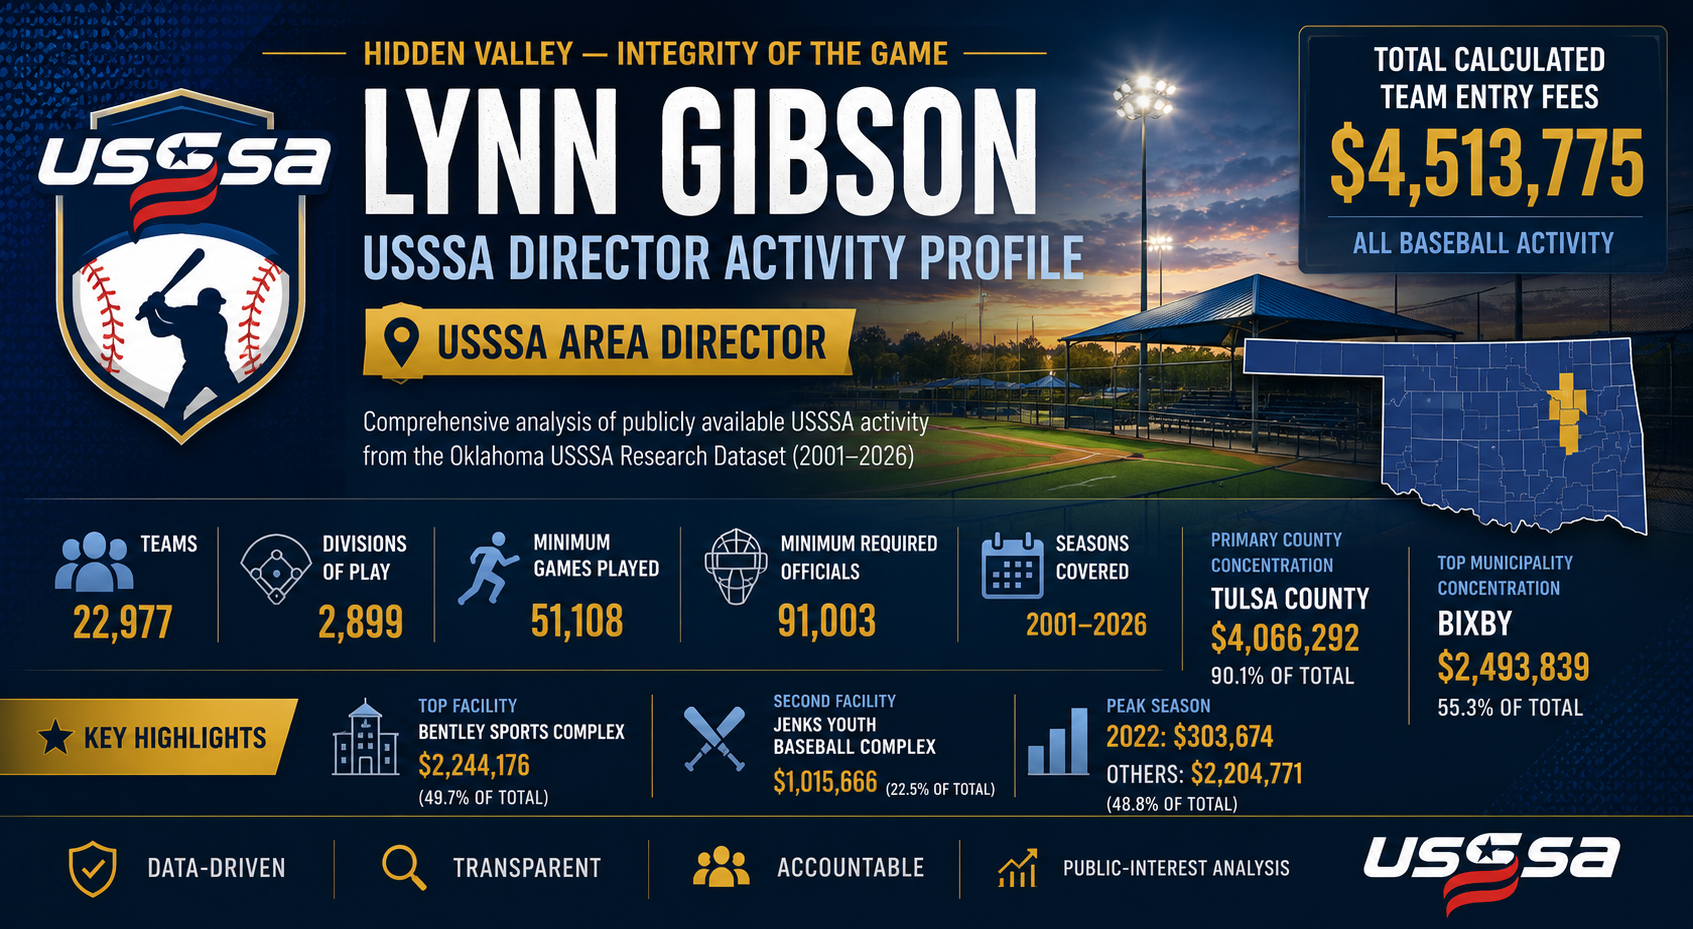
Lynn Gibson Activity Snapshot
Calculated Team Entry Fees are derived from participating teams multiplied by publicly posted Team Entry Fees where a fee is identified. They are analytical measurements based on public USSSA information, not USSSA-reported aggregate financial totals or personal income.
Tournament, League & Methodology Context
Tournament and League Activity
The broader Hidden Valley dataset includes both tournament and league activity. Some league records may document teams, divisions, dates, facilities and other operational information while displaying a $0.00 Team Entry Fee.
$0.00 in Calculated Team Entry Fees does not necessarily mean $0.00 in documented operational activity. A $0.00 public fee means the public USSSA information captured in the dataset did not identify a Team Entry Fee for that record. This could reflect an apparently free league or another fee arrangement not visible in the public Team Entry Fee field. The dataset does not assume local fees were collected and does not impute an unsupported fee.
Calculated Team Entry Fee Methodology
Participating Teams × Publicly Posted Team Entry Fee = Calculated Team Entry Fees.
These figures should not be characterized as USSSA-reported aggregate revenue, director income, personal compensation, profit, taxable income, net proceeds or audited financial statements.
Calculated Team Entry Fees by Season
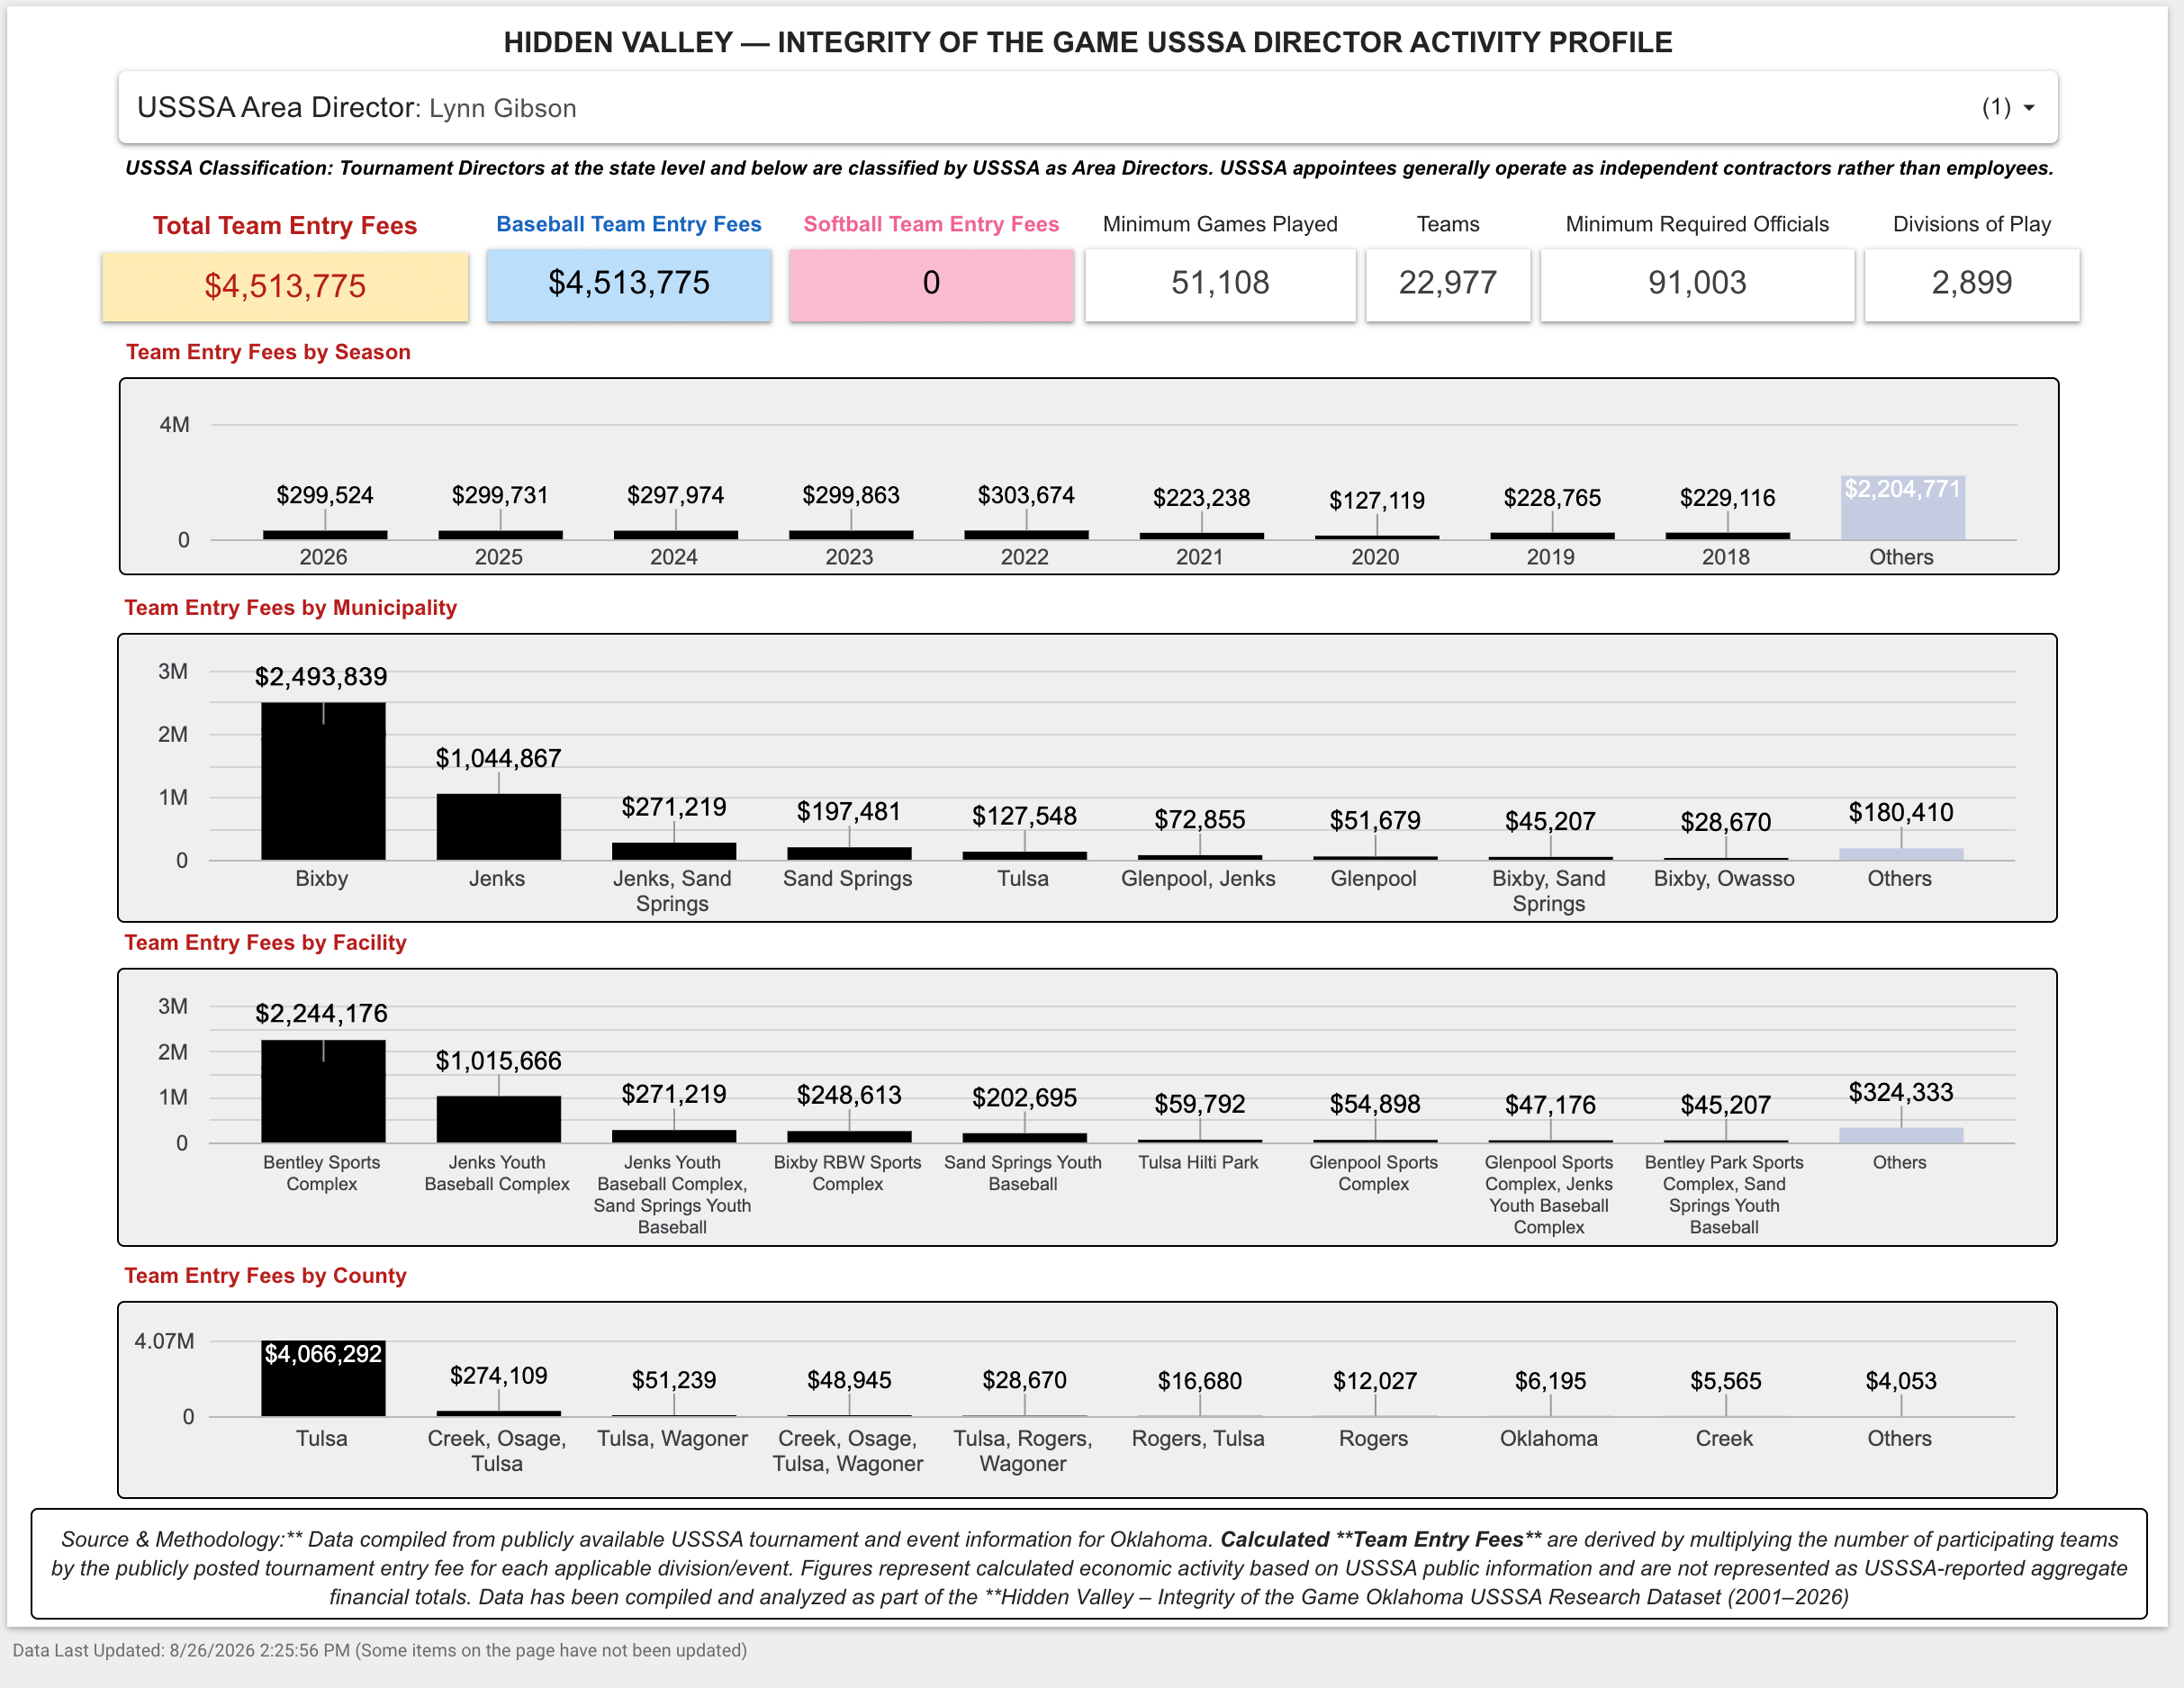
2026 — $299,524
2025 — $299,731
2024 — $297,974
2023 — $299,863
2022 — $303,674
2021 — $223,238
2020 — $127,119
2019 — $228,765
2018 — $229,116
Others — $2,204,771
Among individually displayed years, 2022 is the largest at $303,674. “Others” is an aggregated season category; its individual years cannot be determined from the profile page alone. $0.00-fee league/event activity can still contribute to operational measures without increasing Calculated Team Entry Fee totals.
Geographic Distribution
Calculated Team Entry Fees by Municipality
Bixby — $2,493,839
Jenks — $1,044,867
Jenks / Sand Springs — $271,219
Sand Springs — $197,481
Tulsa — $127,548
Glenpool / Jenks — $72,855
Glenpool — $51,679
Bixby / Sand Springs — $45,207
Bixby / Owasso — $28,670
Others — $180,410
Bixby is the largest individually displayed municipality category. Combined municipality categories represent one geographic event classification and should not be duplicated across individual municipalities. These amounts should not be interpreted as municipal revenue.
Calculated Team Entry Fees by County
Tulsa — $4,066,292
Creek / Osage / Tulsa — $274,109
Tulsa / Wagoner — $51,239
Creek / Osage / Tulsa / Wagoner — $48,945
Tulsa / Rogers / Wagoner — $28,670
Rogers / Tulsa — $16,680
Rogers — $12,027
Oklahoma — $6,195
Creek — $5,565
Others — $4,053
Tulsa County is the dominant county category. Multi-county classifications represent one combined geographic classification and should not be independently attributed in full to every county listed. Rogers and Creek also appear independently and should remain analytically separate from their combined classifications.
Calculated Team Entry Fees by Facility
The source report contains both single-facility and multi-facility classifications. Multi-facility amounts represent one pool of Calculated Team Entry Fee activity associated with the combined configuration and must not be duplicated across the individual facilities.
The facility data does not establish allocation of Team Entry Fees among facilities, facility rental payments, revenue sharing, facility income, distributions, net proceeds, or subsequent disposition of event funds. Nor does it establish that a secondary facility was an overflow or satellite site unless independently documented.
Research Images
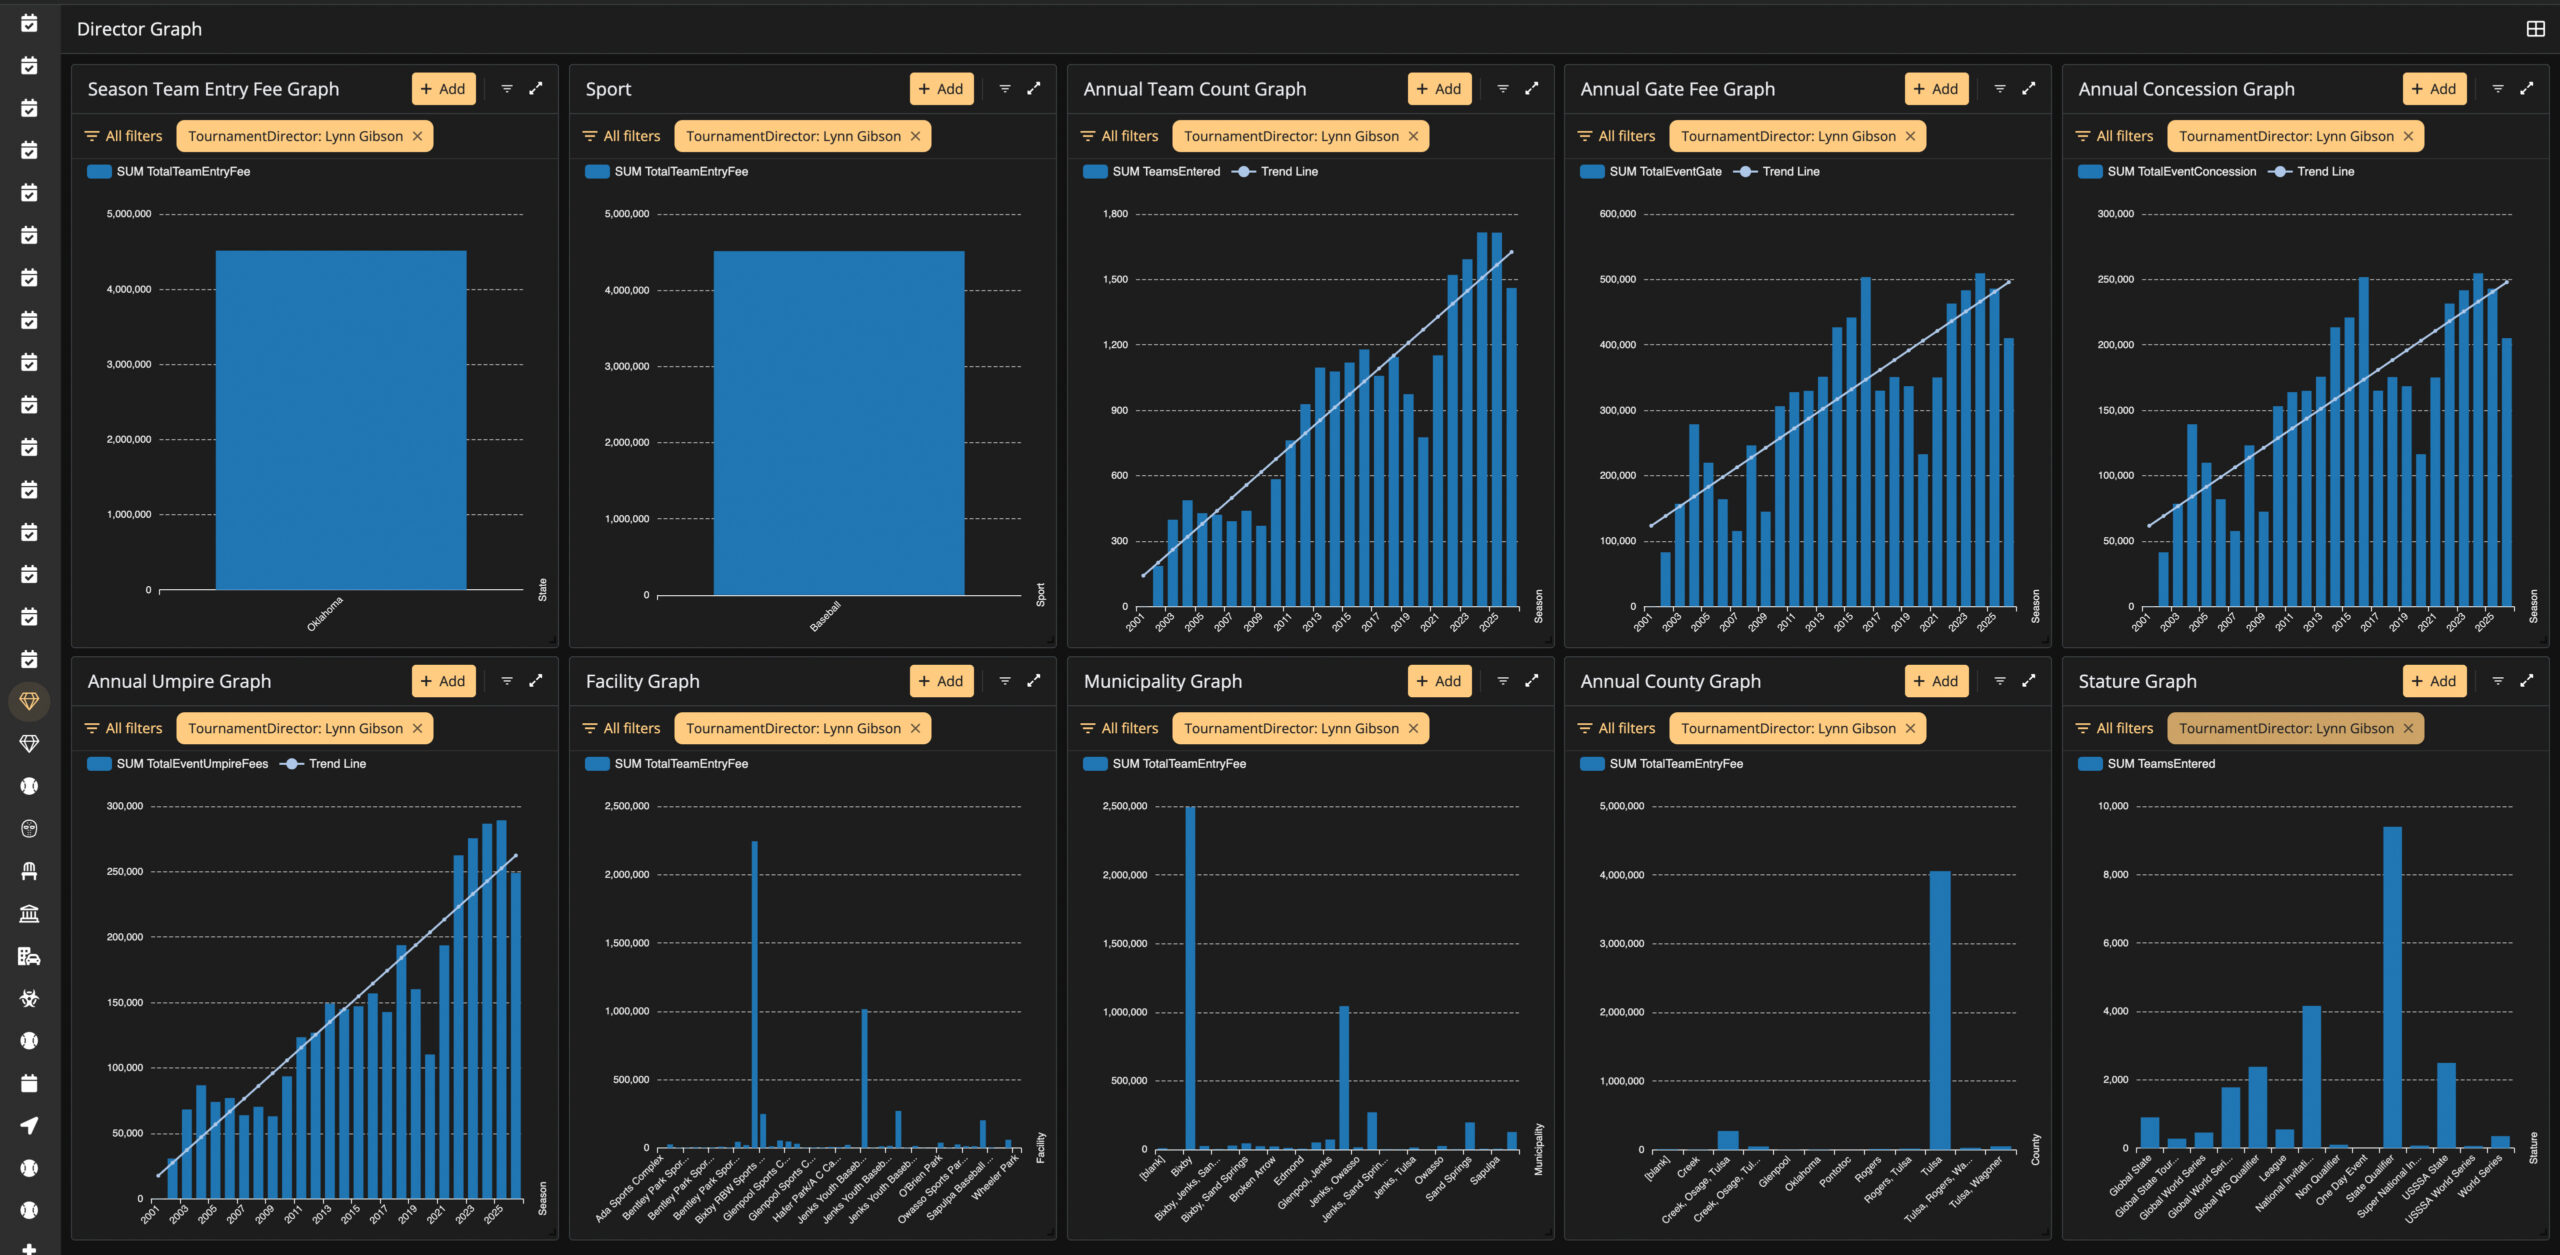
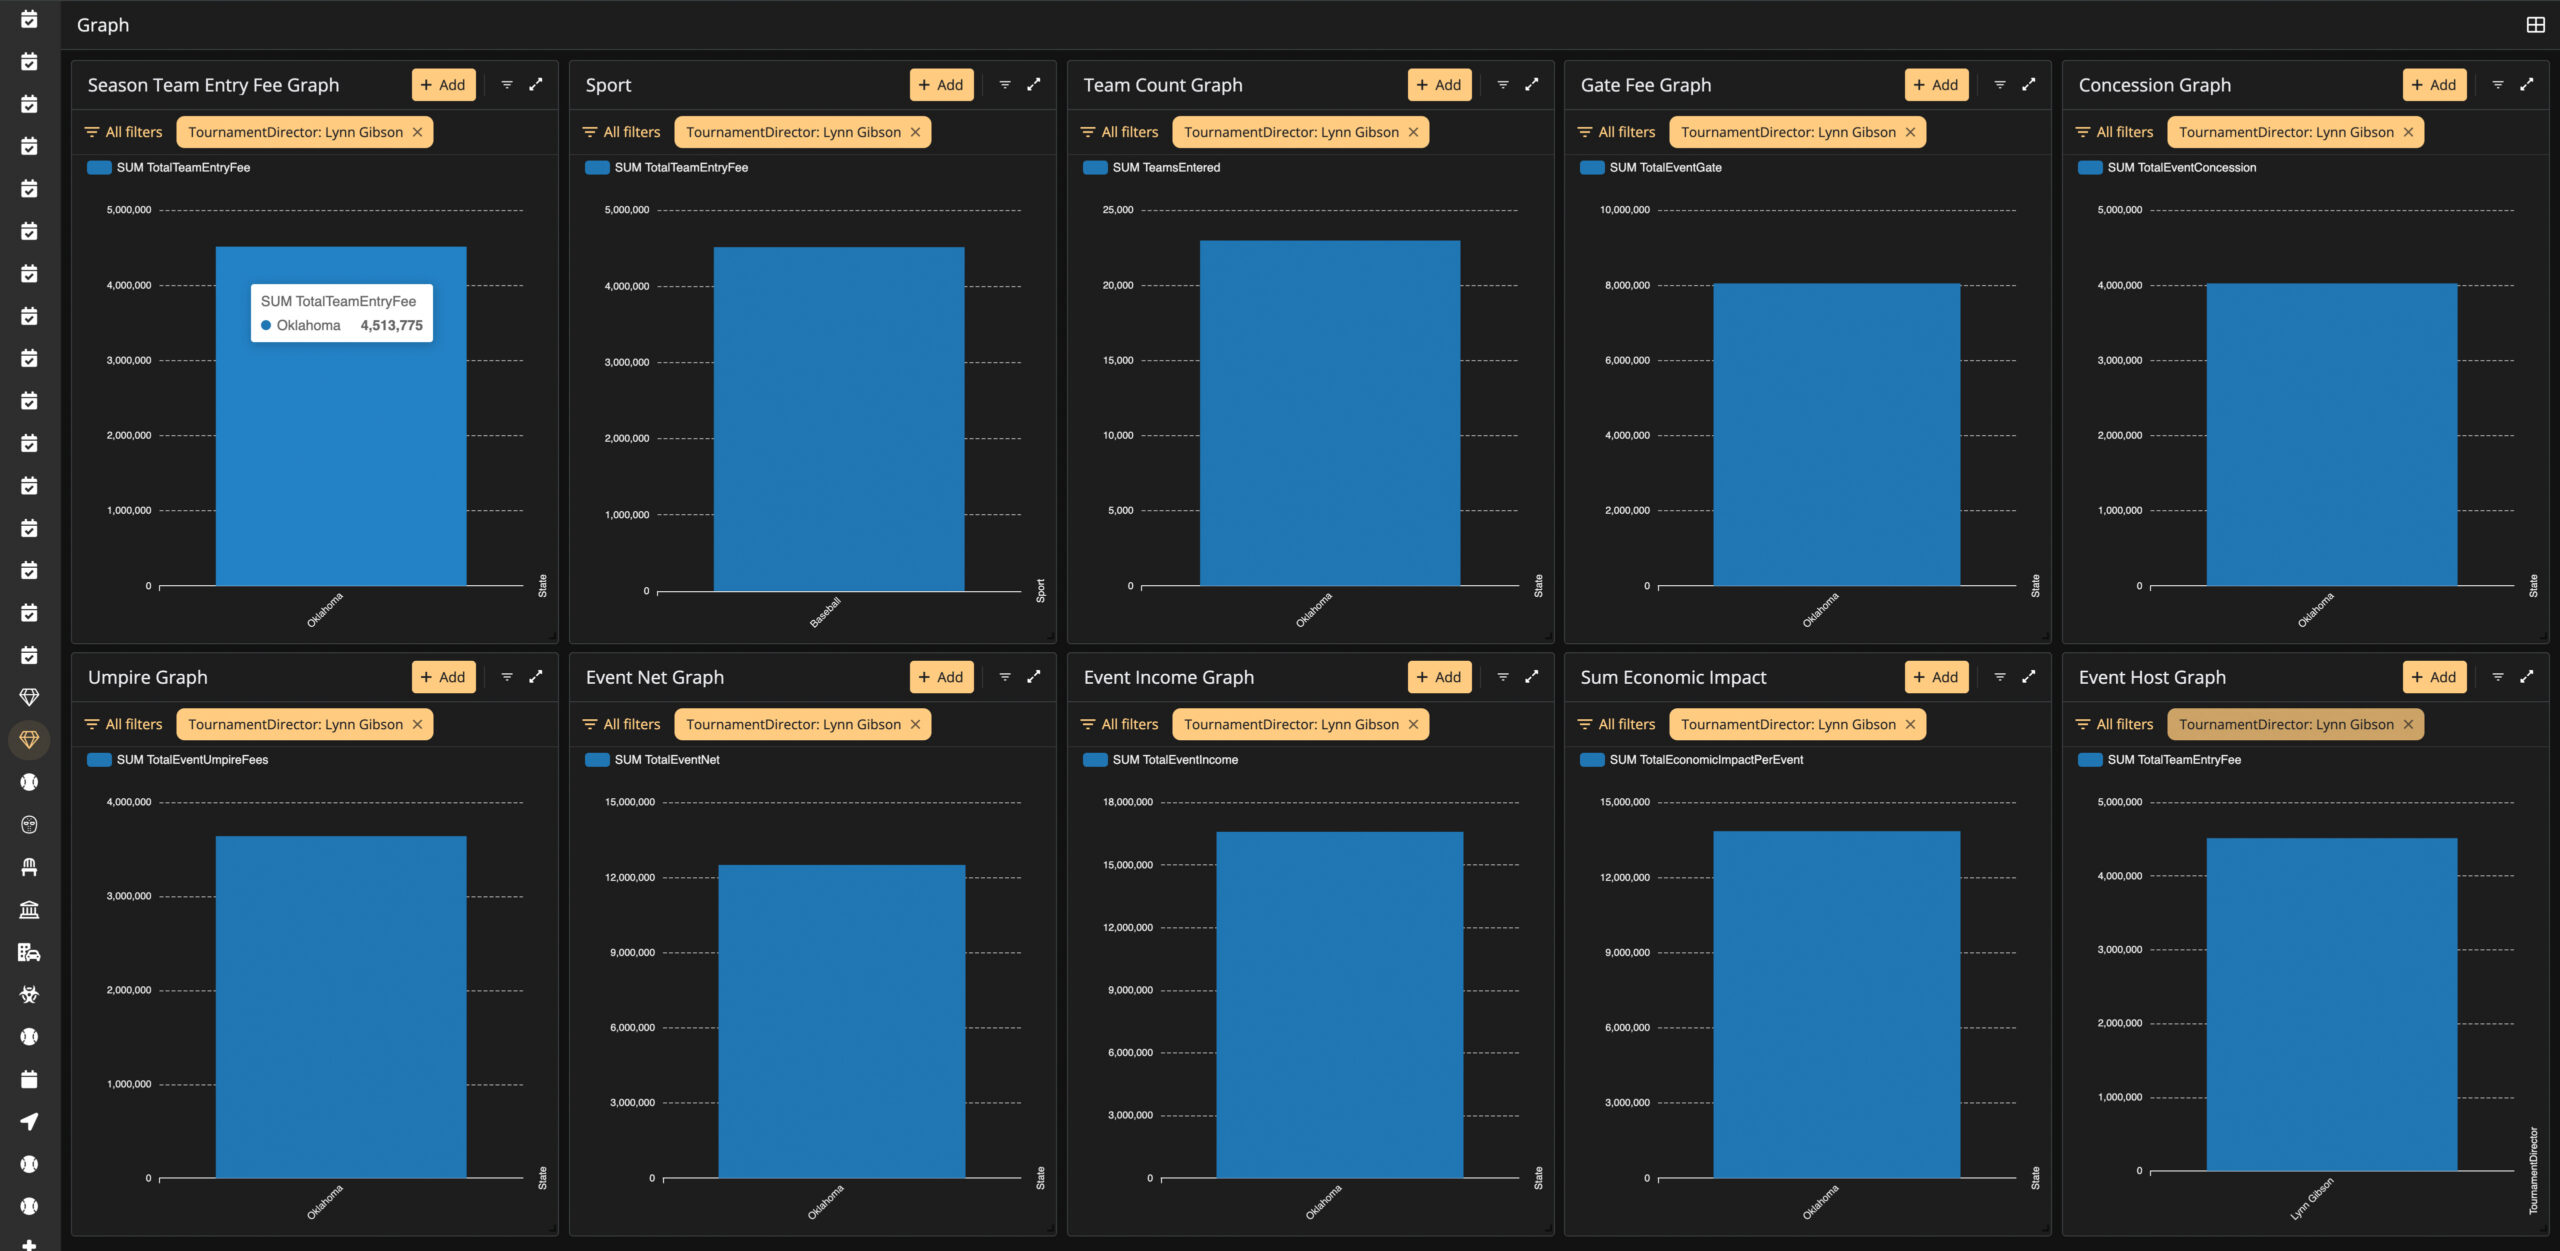
USSSA Organizational & Financial Structure
The source report provides organizational and payment-process context rather than additional Lynn Gibson-specific financial findings. It depicts the general authority flow as USSSA National → State Director → Area Director → Tournament Director → Tournament/Event → Teams.
The financial-flow portion depicts applicable online event payments as Teams → USSSA Online Payment System → USSSA → ACH → Event/Fiscal Director → Tournament Operations. This describes an applicable online payment pathway and does not establish that every tournament or league payment necessarily followed that exact pathway. The subsequent disposition of event funds is not determined by the Hidden Valley dataset unless independently documented.
What This Profile Establishes — and What It Does Not
Publicly Documented / Calculated
- Lynn Gibson is identified as a USSSA Area Director.
- $4,513,775 in Total Calculated Team Entry Fees, categorized as baseball.
- 22,977 teams, 2,899 divisions, 51,108 minimum games and 91,003 minimum required officials.
- Season, municipality, county and facility associations shown in the profile.
- Single- and multi-facility / geographic classifications contained in the report.
- $0.00-fee records may still contain documented operational activity in the broader dataset.
Not Established by This Dataset Alone
- Personal income or compensation received by Lynn Gibson.
- Actual event net profit, taxable income or audited financial results.
- Allocation or ultimate disposition of event funds.
- Facility rental payments, revenue sharing or facility income.
- The full value of a multi-location record independently attributable to each location.
- Whether a $0.00-fee league collected fees locally.
Lynn Gibson — Profile Summary
The profile contains meaningful multi-facility and multi-county classifications. These combined records remain intact as one pool of Calculated Team Entry Fee activity associated with the applicable configuration rather than having the full amount duplicated across every location appearing in the record.
Research & Methodology Disclaimer
This page is an independent research and analytical publication and is not affiliated with, endorsed by, sponsored by, or prepared on behalf of USSSA (United States Specialty Sports Association) or any governmental entity. Information is compiled from publicly available USSSA tournament/event information, USSSA materials, public records and related research materials.
Calculated Team Entry Fees are estimates derived from publicly reported team participation multiplied by publicly posted Team Entry Fees where a fee is identified. These figures should not be interpreted as USSSA-reported revenue, director income, profit, taxable income or audited financial statements.
Public records and online information may contain omissions, revisions, errors, cancellations, refunds, discounts, payment adjustments or other circumstances that cannot be independently verified from public information alone. The Hidden Valley methodology does not fill evidentiary gaps with unsupported assumptions. Readers should independently review source materials before drawing legal, financial, tax or regulatory conclusions.