
2012
0
Independent research portal examining documented USSSA baseball and softball activity associated with FireLake Ballfields, including direct stand-alone Primary Facility records, associated multi-facility activity, annual trends, director concentration, and the combined documented facility activity footprint.
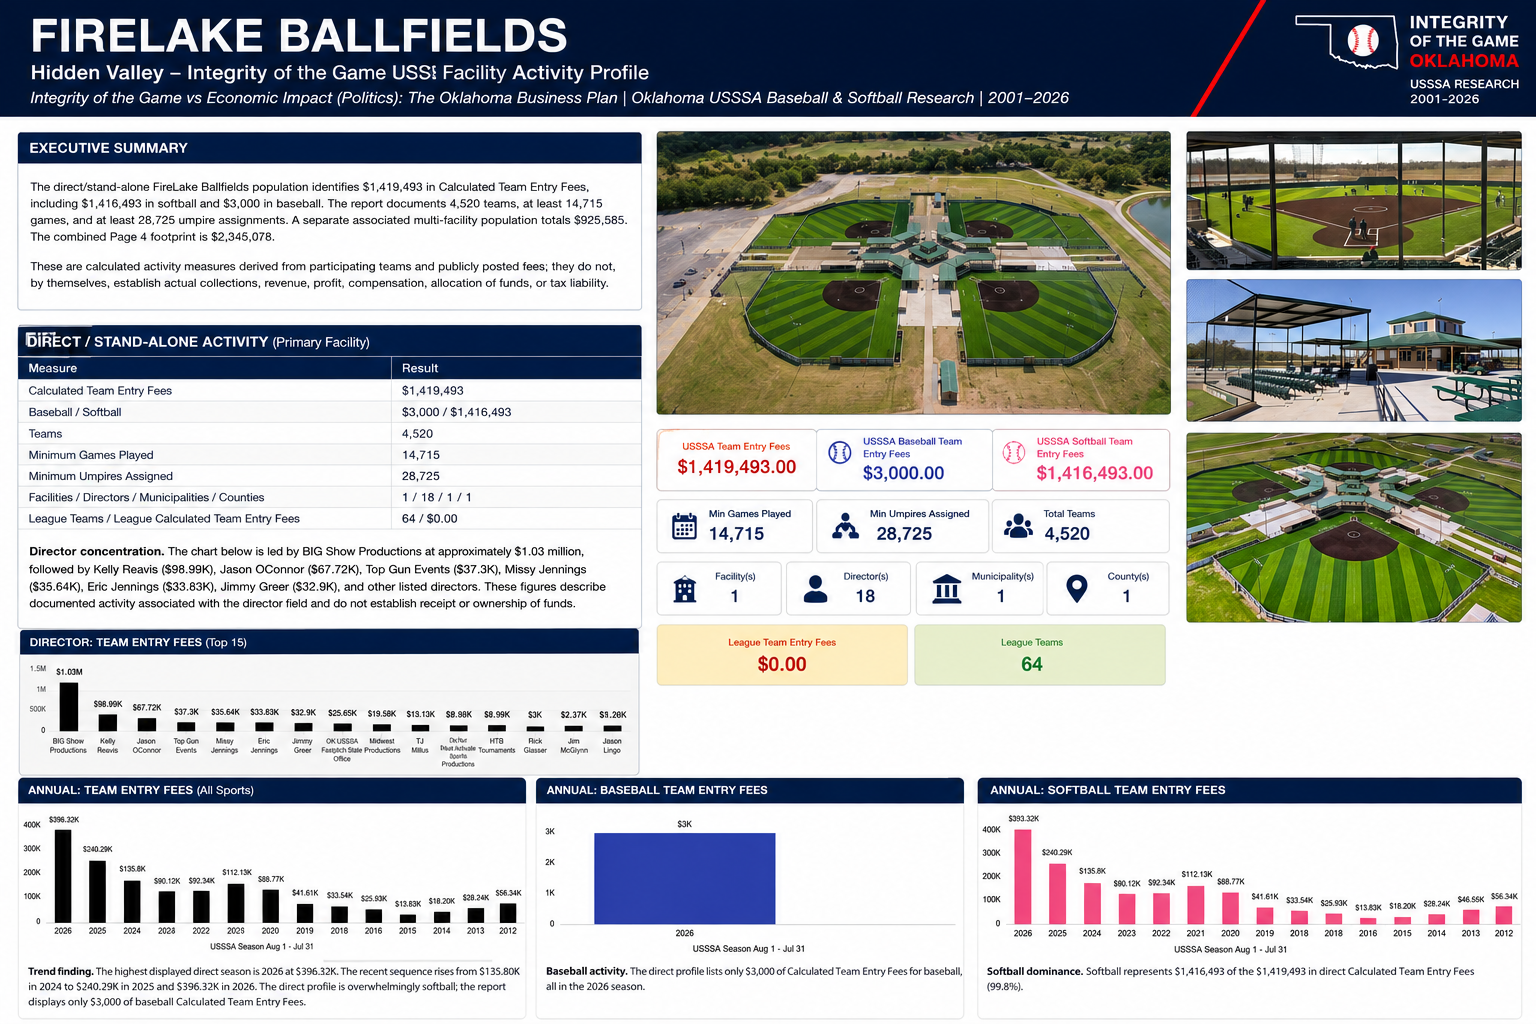
Pages 1-2 represent records listing FireLake Ballfields independently as the Primary Facility, excluding multi-facility combinations. The direct population identifies $1,419,493 in Calculated Team Entry Fees, including $1,416,493 in softball and $3,000 in baseball, with 4,520 teams, at least 14,715 games, and at least 28,725 umpire assignments.
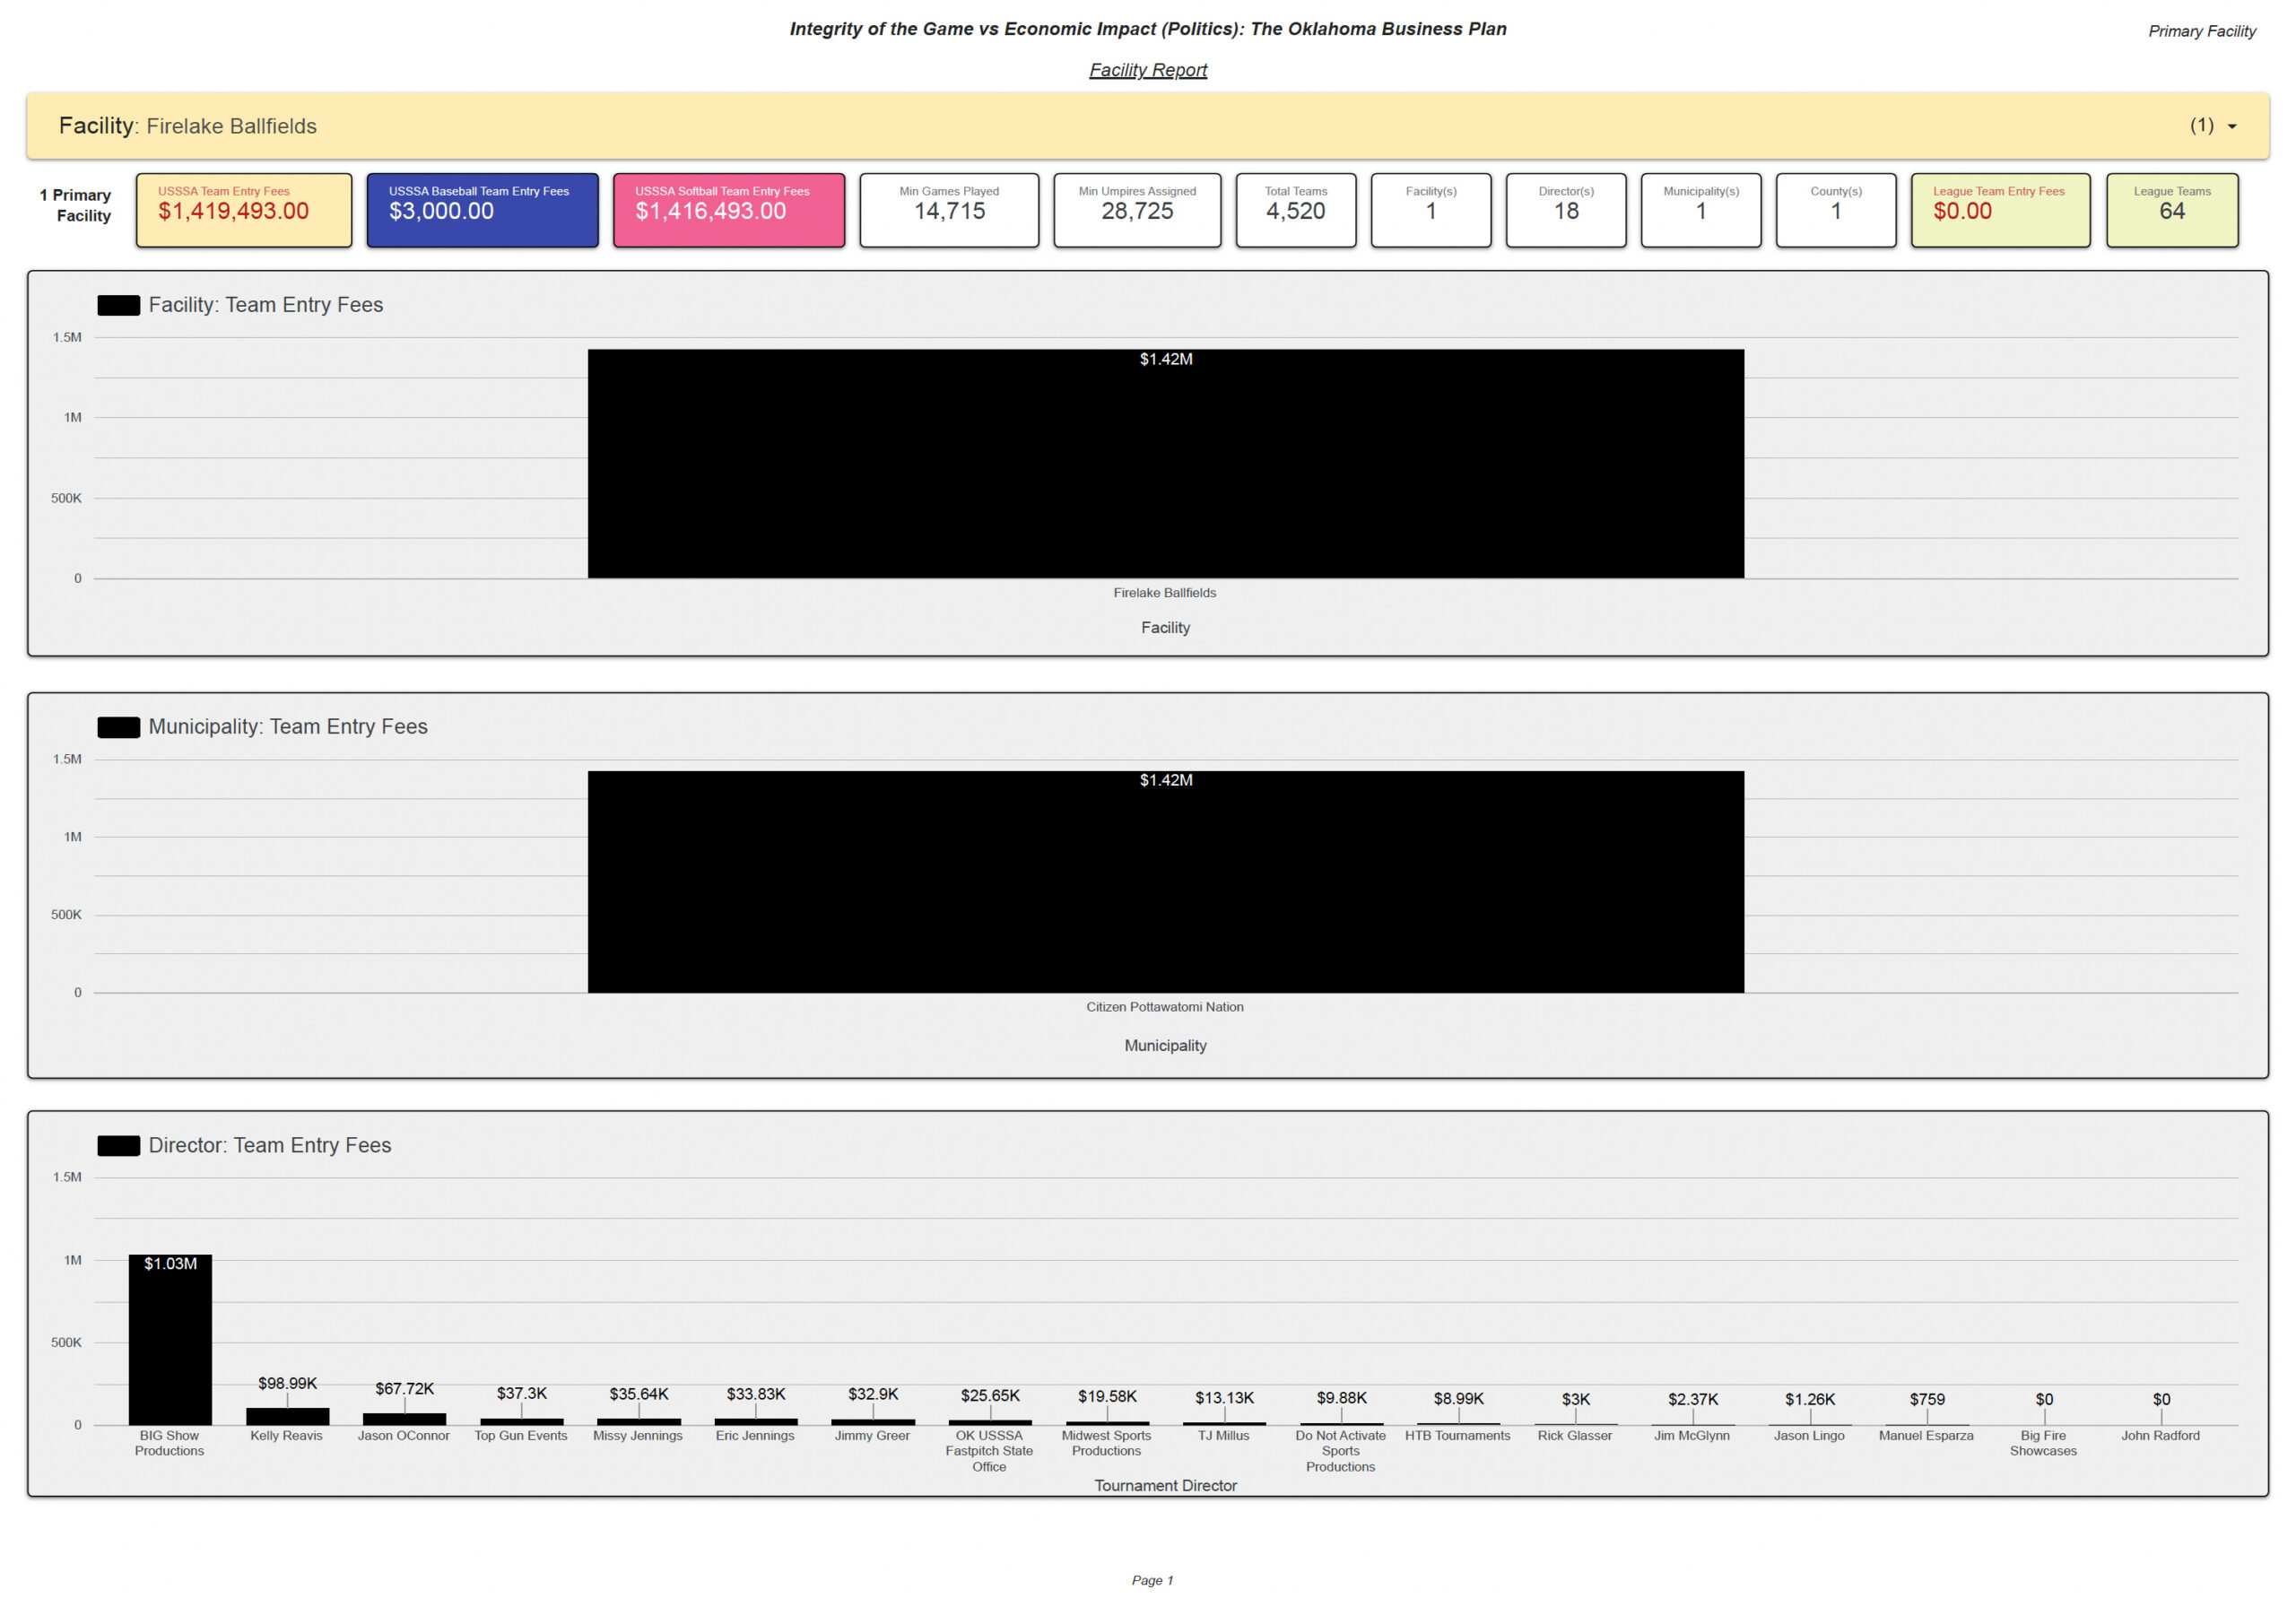
The direct records identify FireLake Ballfields as the sole listed facility and Citizen Potawatomi Nation as the municipality field in the report. The Page 1 director chart is led by BIG Show Productions at approximately $1.03 million, followed by Kelly Reavis at $98.99K, Jason OConnor at $67.72K, Top Gun Events at $37.3K, Missy Jennings at $35.64K, Eric Jennings at $33.83K, and Jimmy Greer at $32.9K.
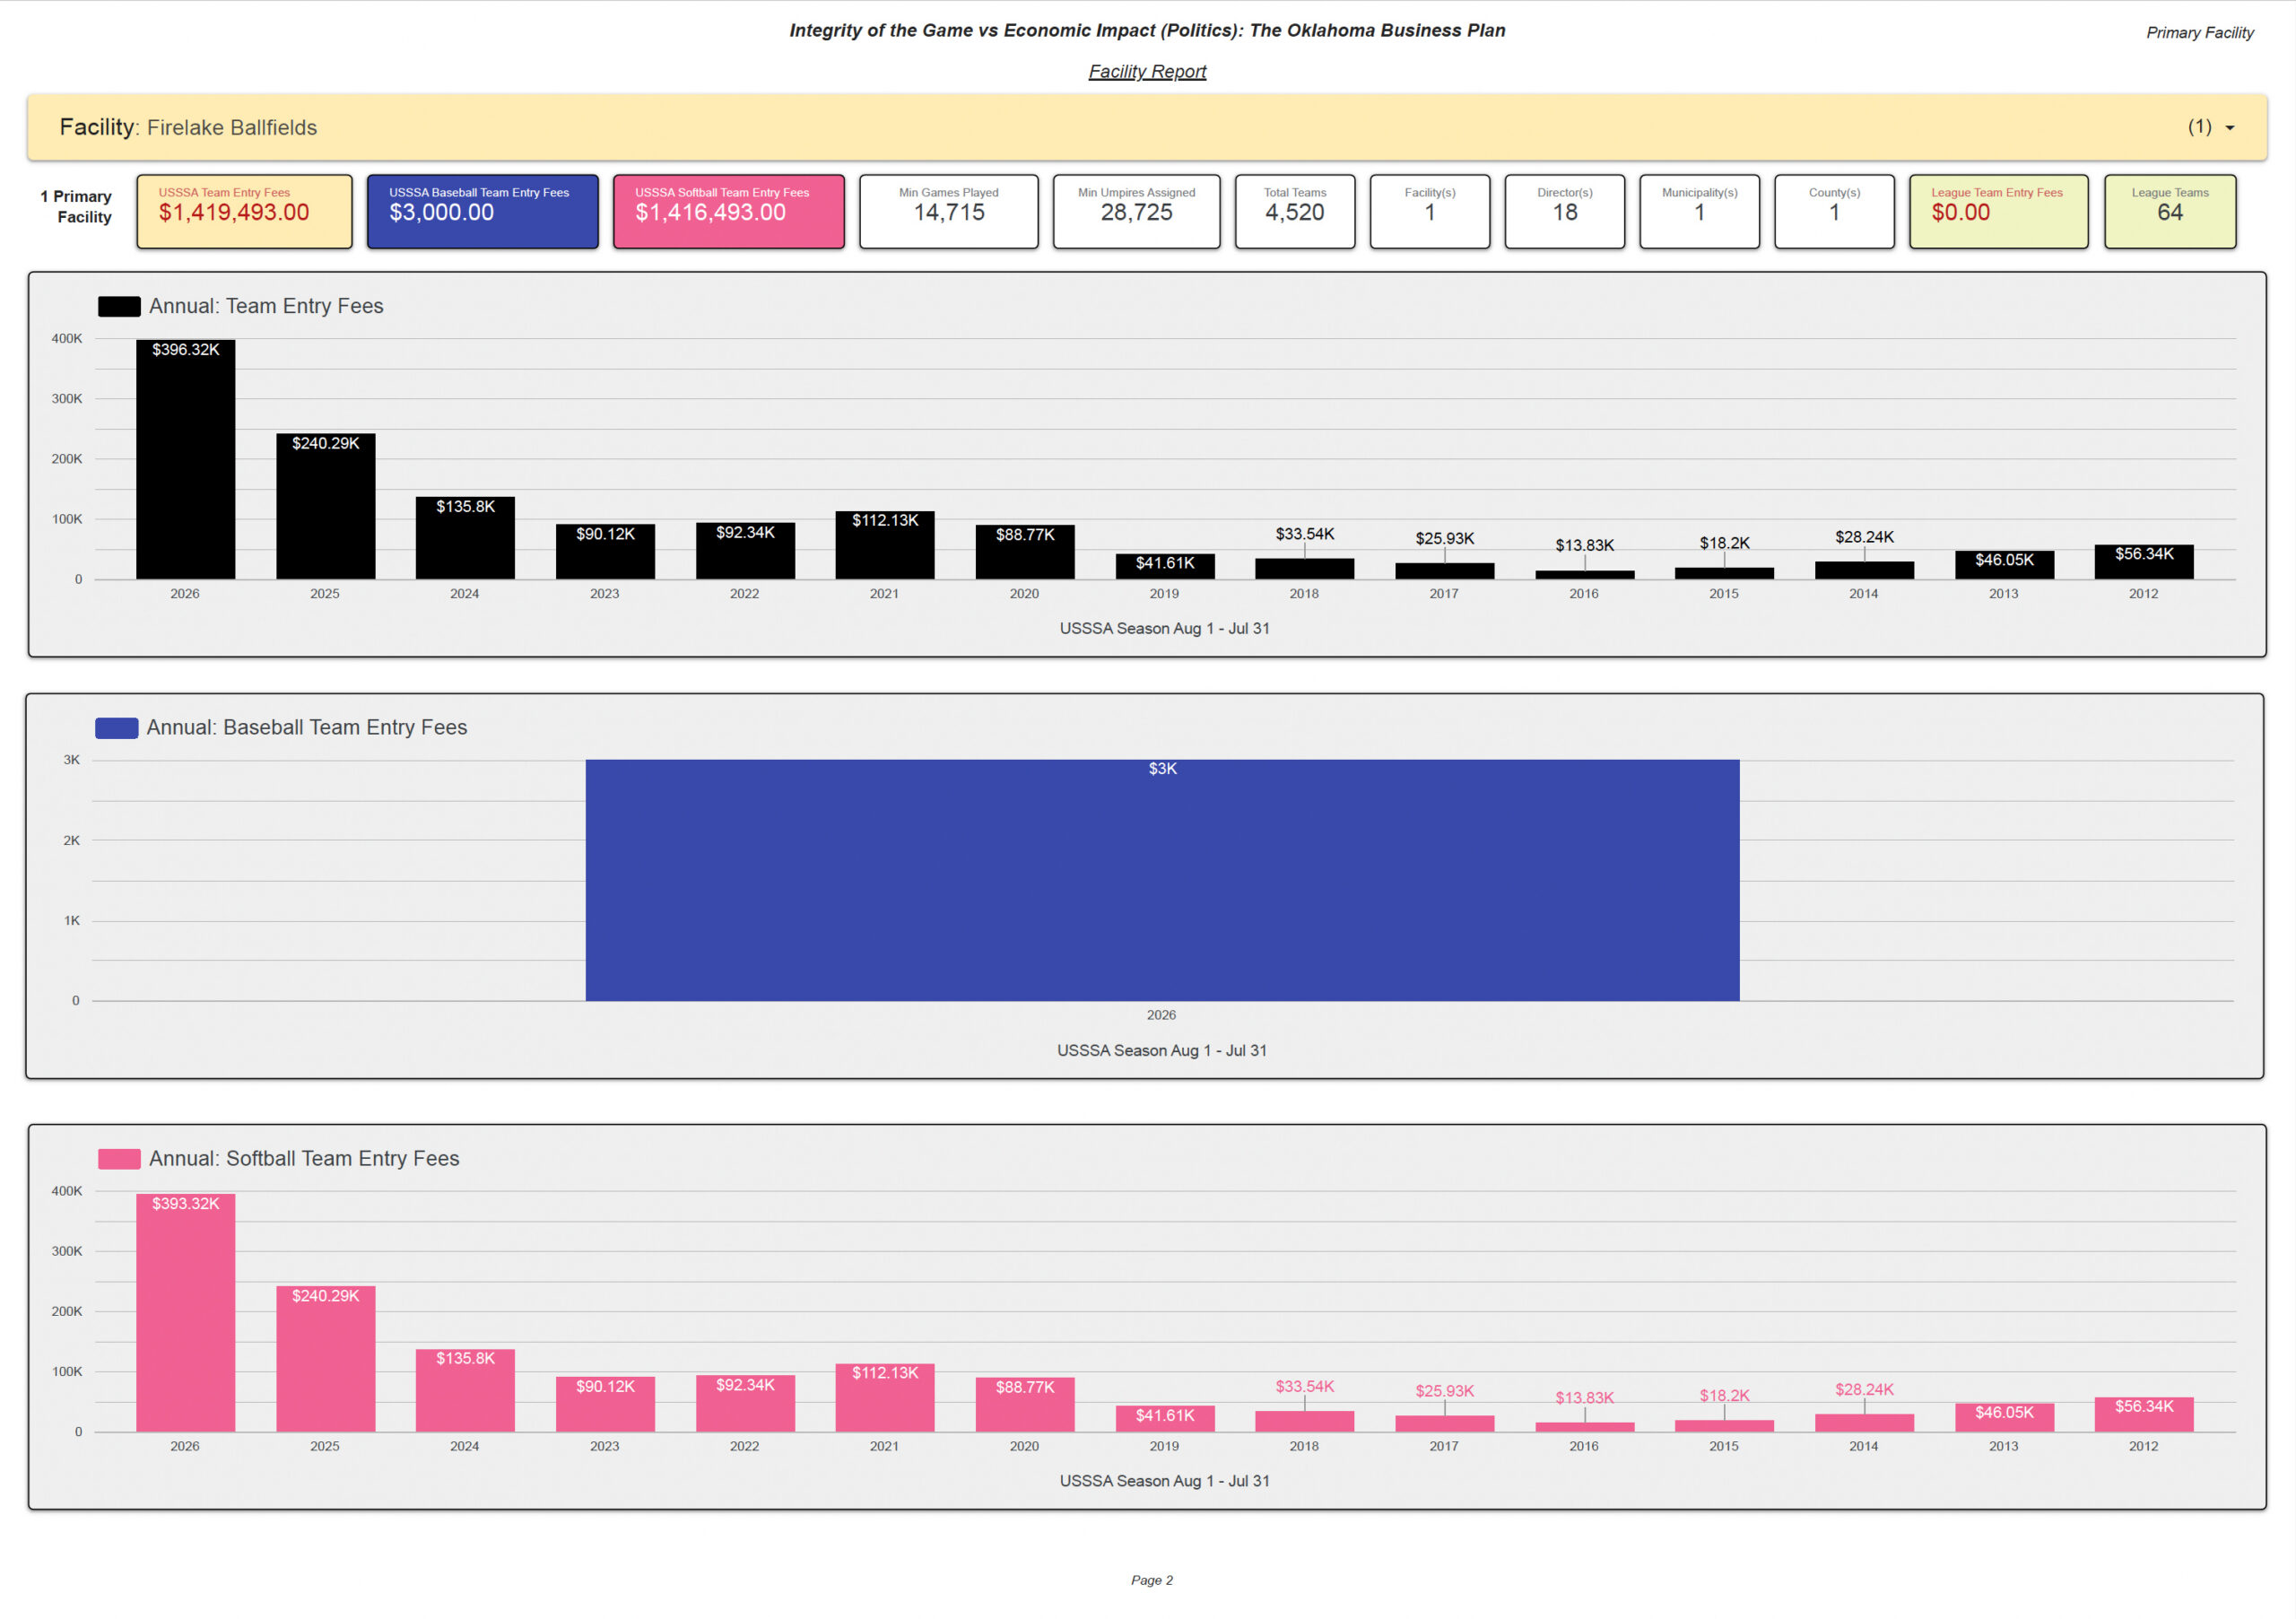
| Season | Total | Baseball | Softball |
|---|---|---|---|
| 2026 | $396.32K | $3.00K | $393.32K |
| 2025 | $240.29K | $0 | $240.29K |
| 2024 | $135.80K | $0 | $135.80K |
| 2023 | $90.12K | $0 | $90.12K |
| 2022 | $92.34K | $0 | $92.34K |
| 2021 | $112.13K | $0 | $112.13K |
| 2020 | $88.77K | $0 | $88.77K |
| 2019 | $41.61K | $0 | $41.61K |
| 2018 | $33.54K | $0 | $33.54K |
| 2017 | $25.93K | $0 | $25.93K |
| 2016 | $13.83K | $0 | $13.83K |
| 2015 | $18.20K | $0 | $18.20K |
| 2014 | $28.24K | $0 | $28.24K |
| 2013 | $46.05K | $0 | $46.05K |
| 2012 | $56.34K | $0 | $56.34K |
The highest displayed direct season is 2026 at $396.32K. The recent sequence increases from $135.80K in 2024 to $240.29K in 2025 and $396.32K in 2026. The direct profile is overwhelmingly softball; only $3,000 of baseball Calculated Team Entry Fees is displayed.
This population excludes the stand-alone Primary Facility records and captures records where FireLake Ballfields appears with one or more additional facilities. It identifies $925,585 in associated Calculated Team Entry Fees, all displayed as softball, involving 1,529 teams, at least 5,198 games, at least 10,313 umpire assignments, 21 facilities, 6 directors, 14 municipalities, and 10 counties.
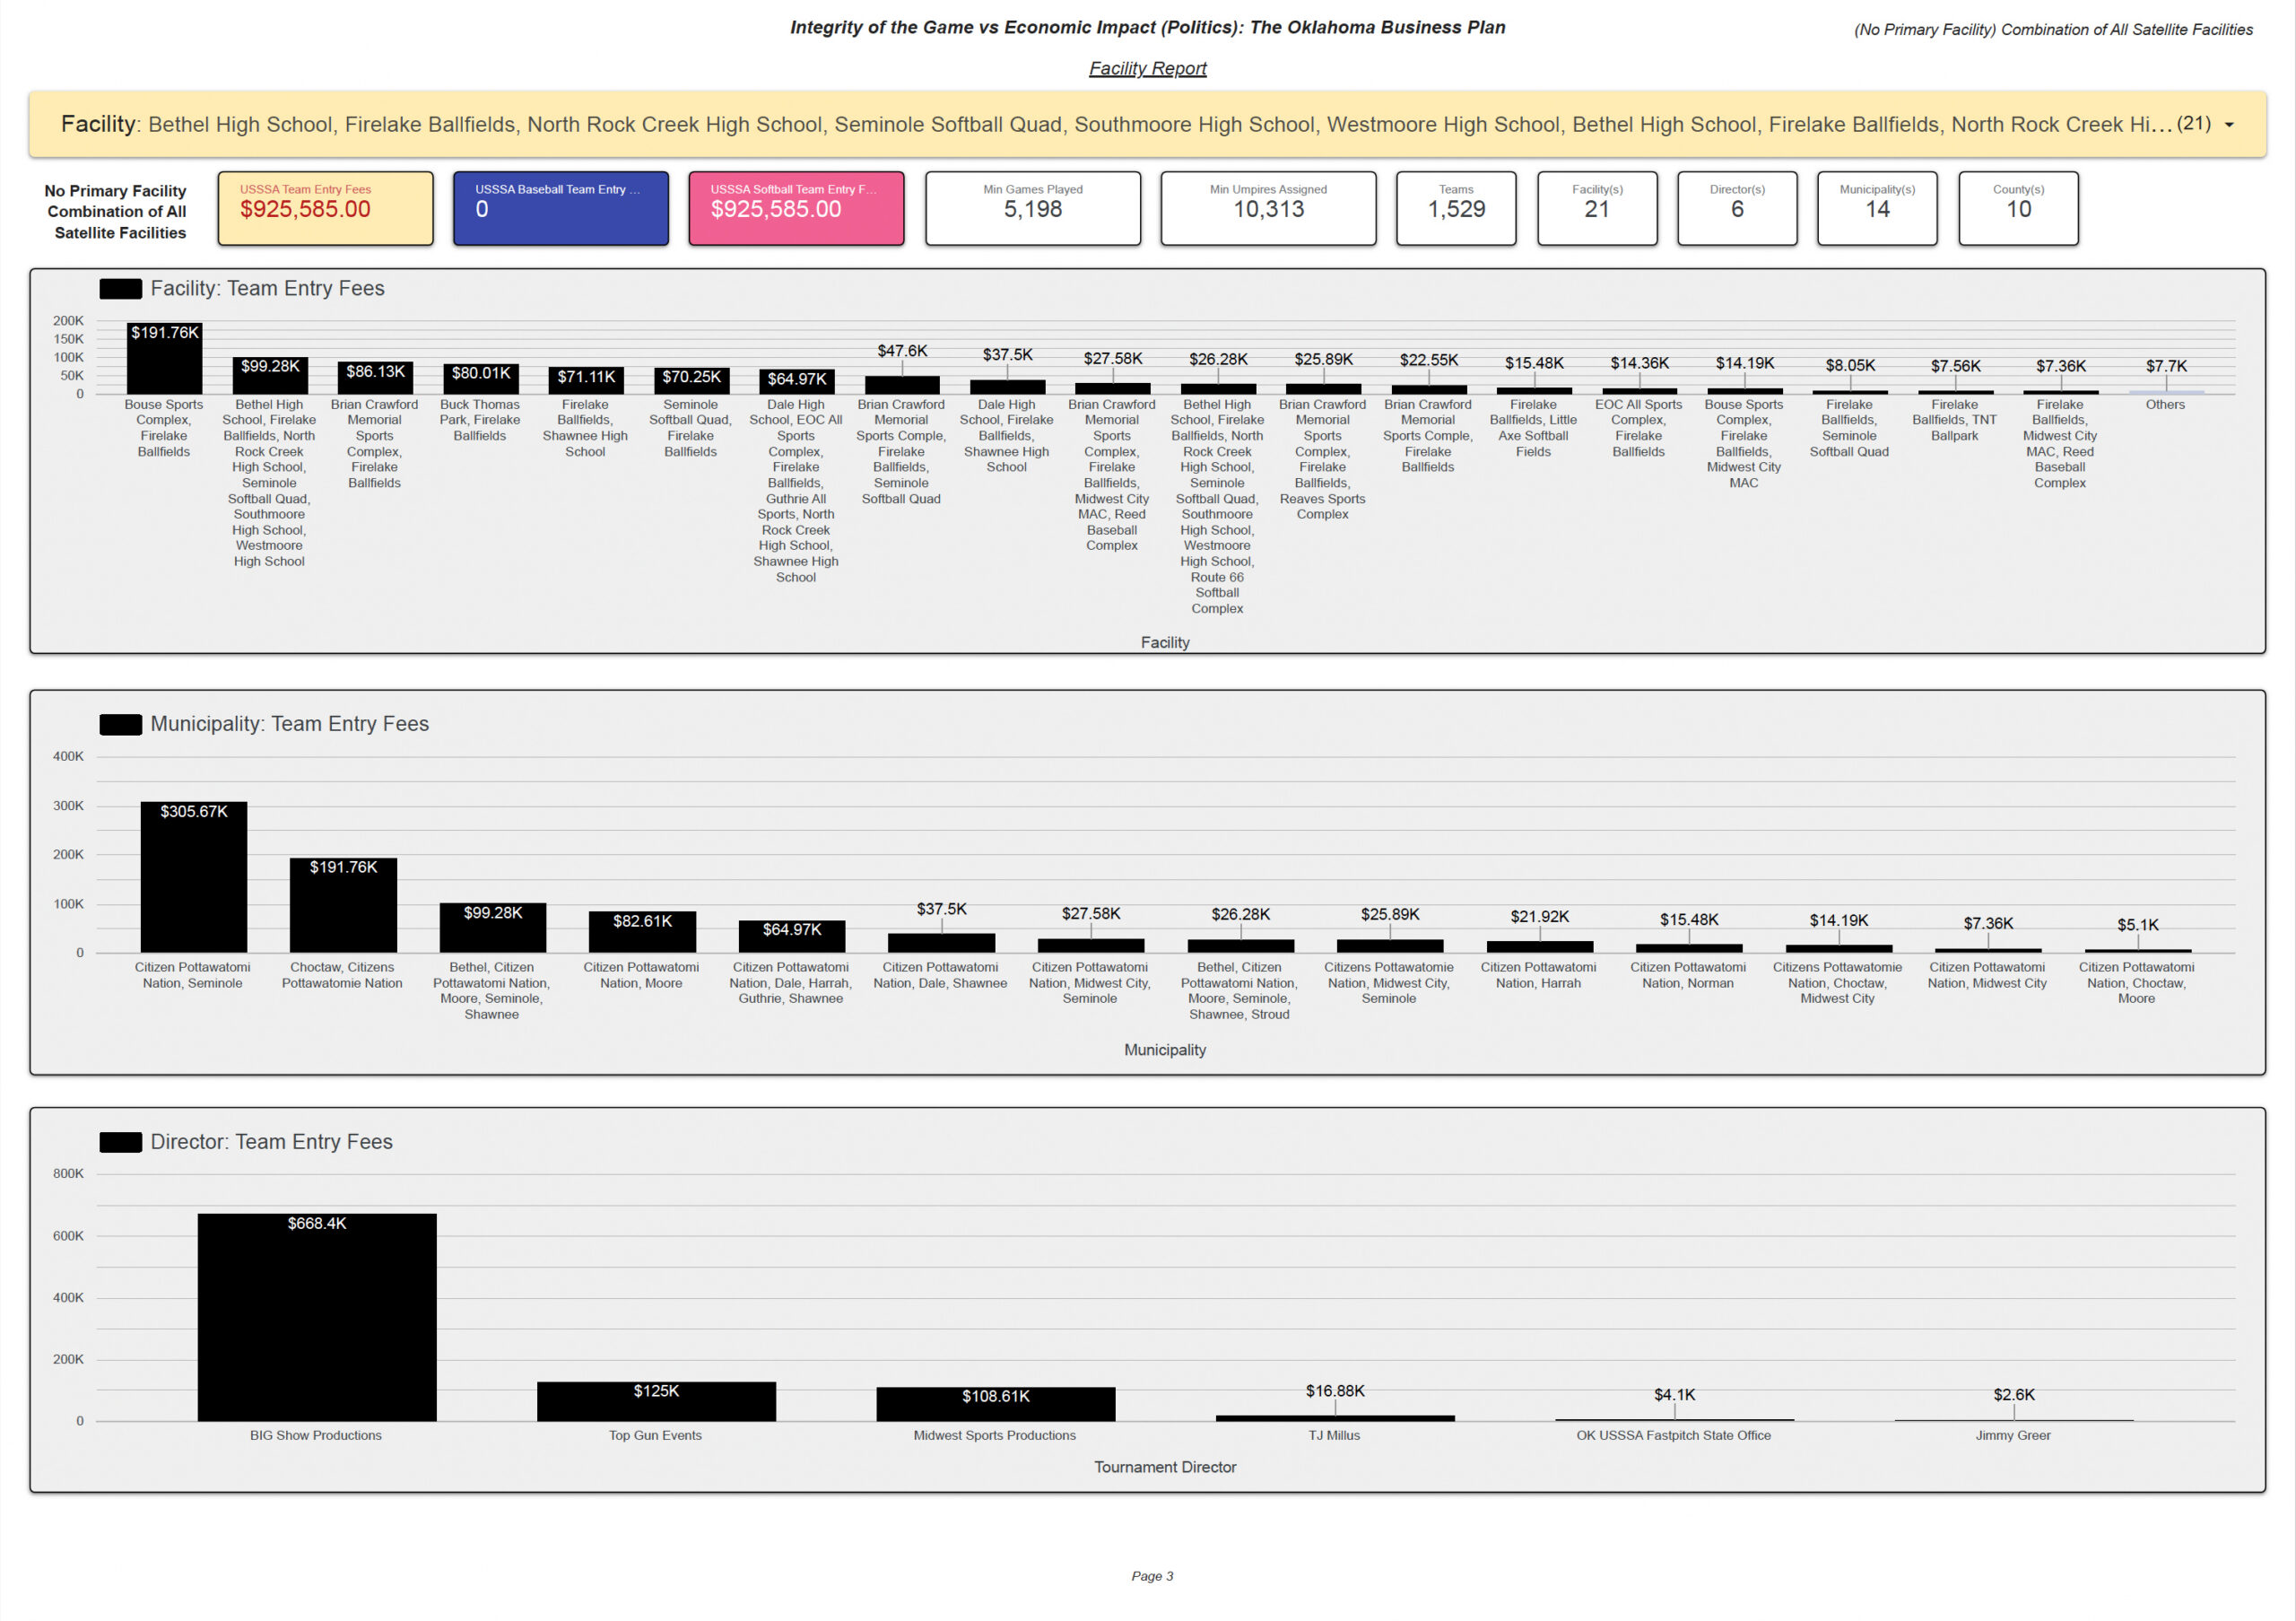
| Facility Combination | Calculated Team Entry Fees |
|---|---|
| Bouse Sports Complex + FireLake Ballfields | $191.76K |
| Bethel High School + FireLake Ballfields + North Rock Creek High School + Seminole Softball Quad + Southmoore High School + Westmoore High School | $99.28K |
| Brian Crawford Memorial Sports Complex + FireLake Ballfields | $86.13K |
| Buck Thomas Park + FireLake Ballfields | $80.01K |
| FireLake Ballfields + Shawnee High School | $71.11K |
| Seminole Softball Quad + FireLake Ballfields | $70.25K |
Page 4 combines direct stand-alone Primary Facility activity with the separate associated multi-facility population. It is the broadest documented activity footprint involving FireLake Ballfields and should not be interpreted as proof that every dollar, team, game, or official occurred exclusively at the physical FireLake Ballfields complex.
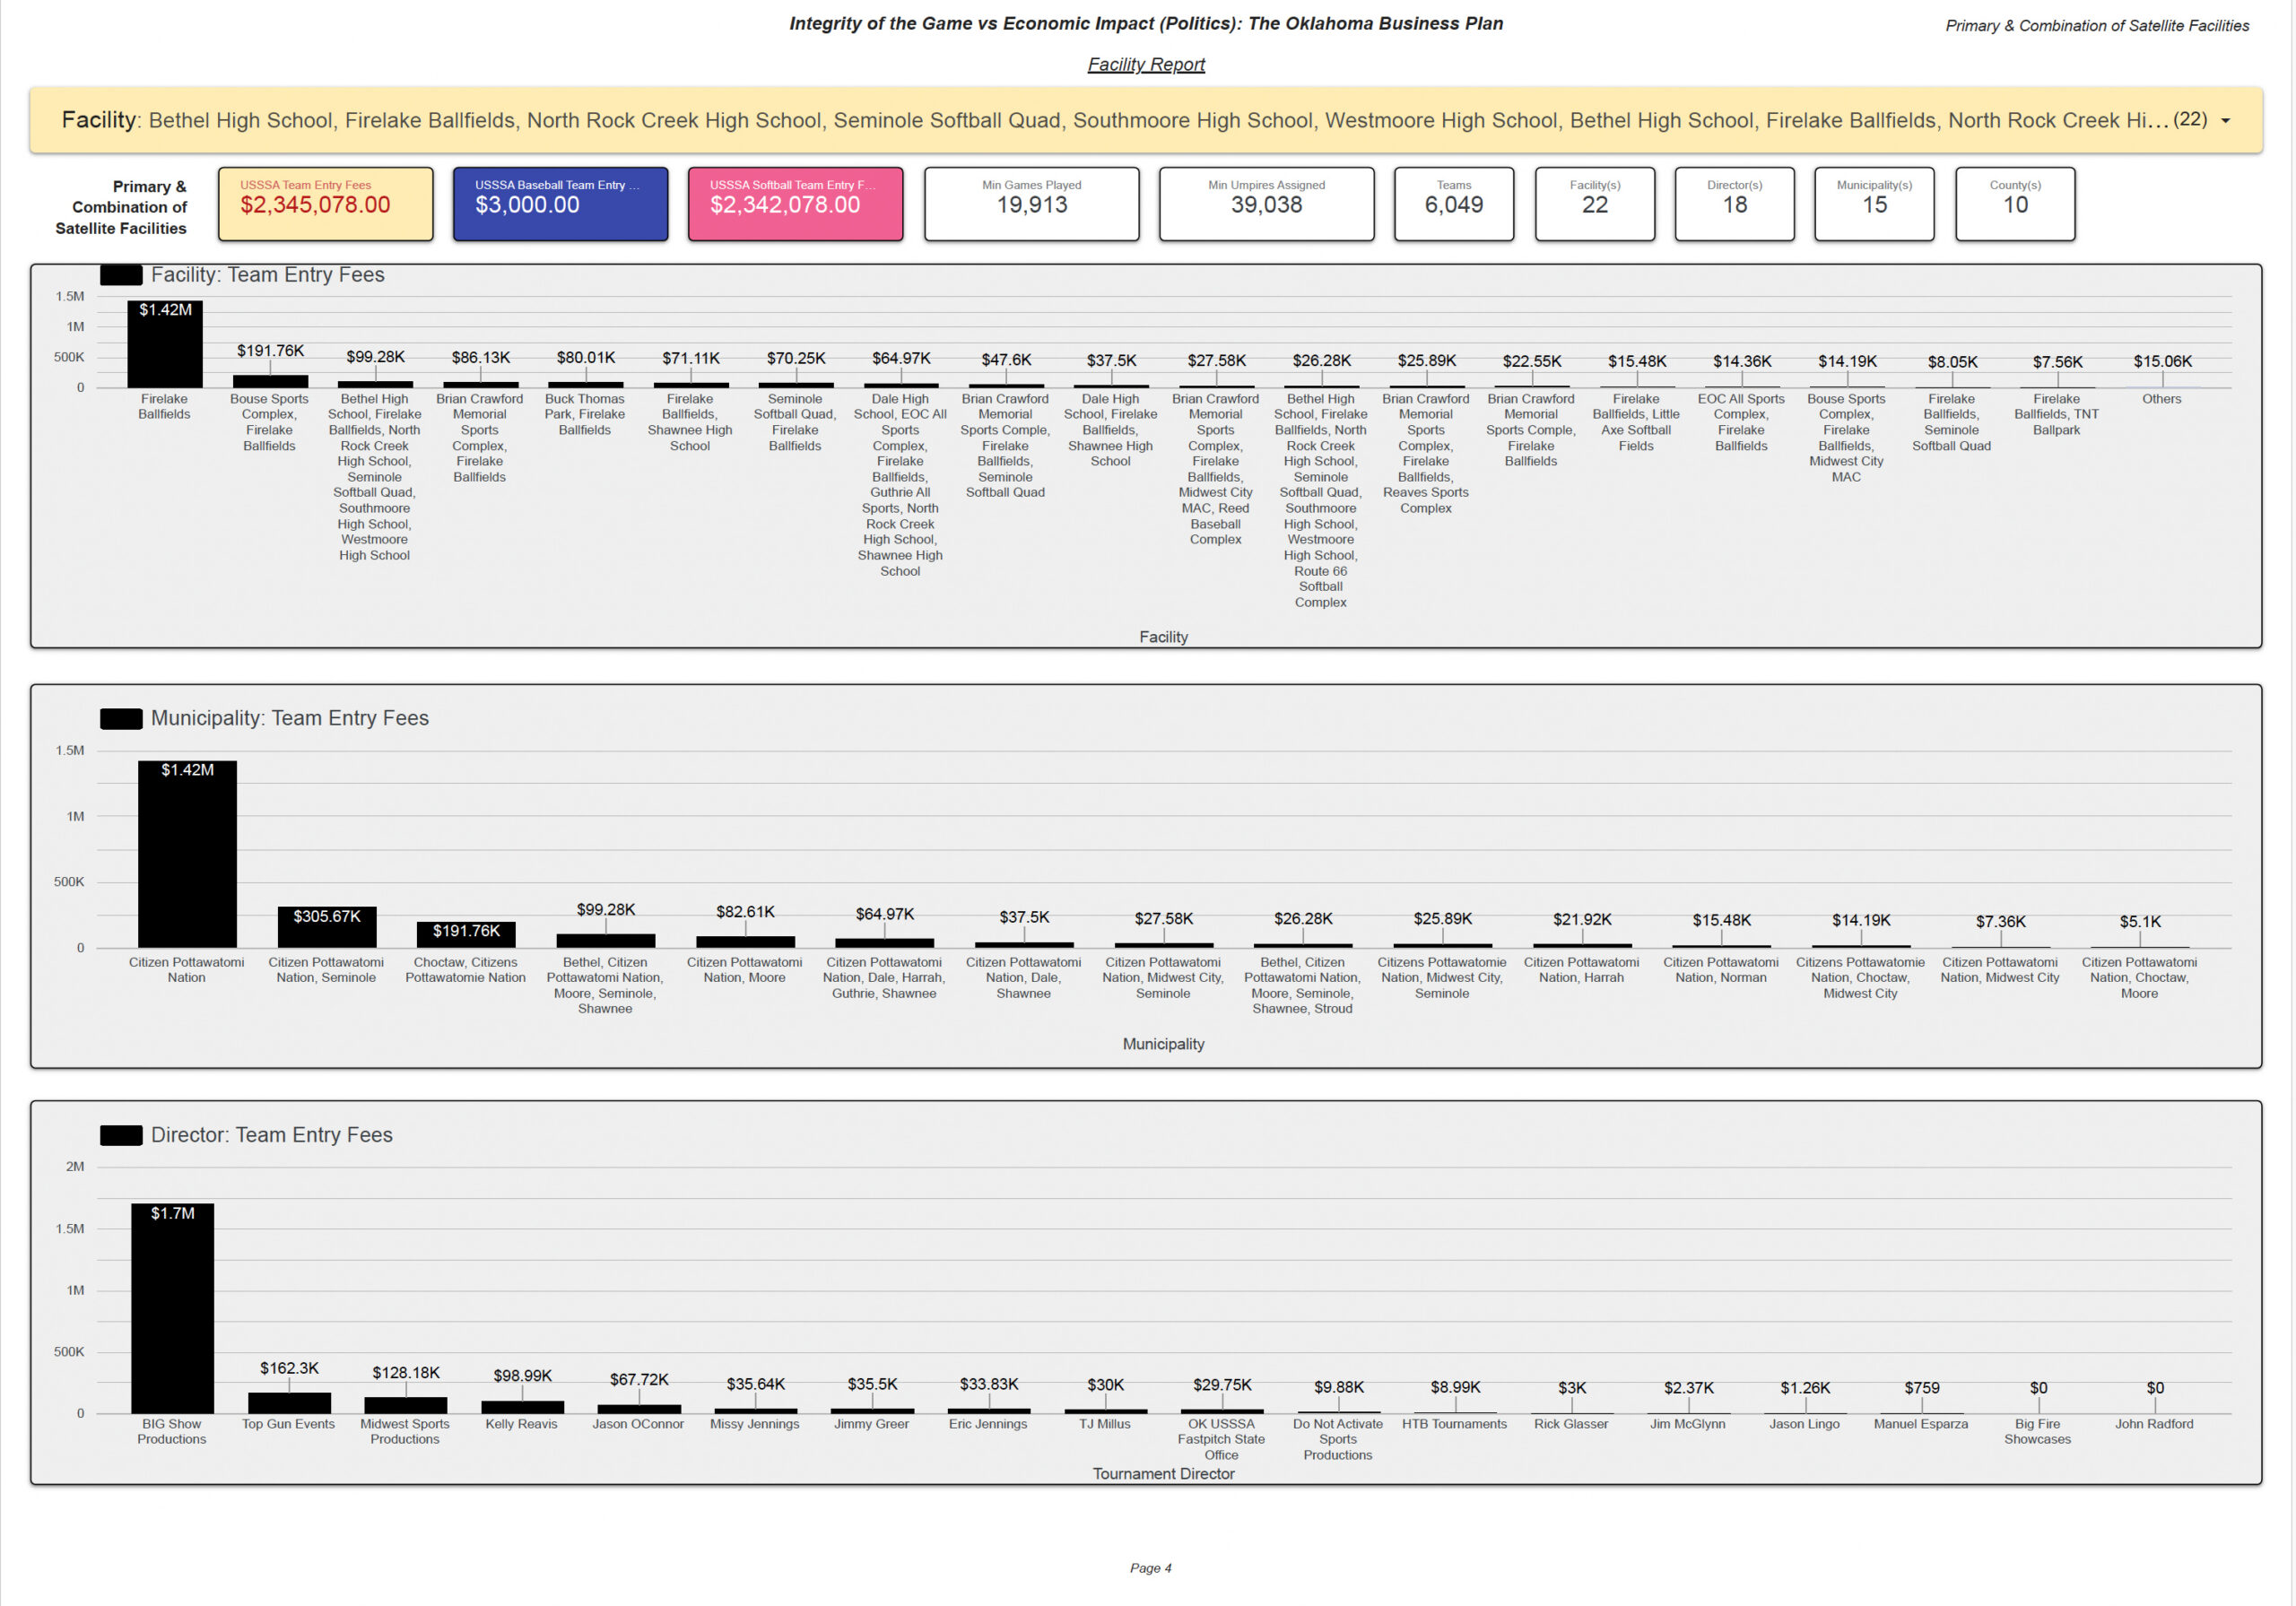
Records listing FireLake Ballfields independently as the Primary Facility. Multi-facility combinations are excluded.
Records where FireLake Ballfields appears as part of a multi-site configuration with one or more other listed facilities.
The broadest documented footprint: Direct Primary Facility activity + Associated Multi-Facility activity.
The annual reports provide a season-by-season view of documented USSSA activity associated with FireLake Ballfields. Beginning in 2017, some annual reports include multi-facility event configurations in addition to records listing FireLake Ballfields alone. For that reason, annual report totals are an associated annual activity footprint and should not automatically be treated as activity occurring exclusively at FireLake Ballfields.
These figures are analytical measurements derived from publicly available USSSA information. They are not, by themselves, verified payments, actual collections, gross receipts, net income, profit, director compensation, USSSA corporate revenue, facility revenue, tribal revenue, bank deposits, taxable income, gate revenue, concession revenue, umpire compensation, or proof of wrongdoing.
The direct FireLake profile displays 64 league teams and $0.00 in League Calculated Team Entry Fees.
A publicly reported $0.00 team entry fee is preserved as $0.00. It should not automatically be interpreted as proving no operational or economic activity, and no unsupported local fee is imputed.
The direct Primary Facility view contains 1 municipality and 1 county. The associated multi-facility population expands to 14 municipalities and 10 counties, while the combined Page 4 footprint contains 15 municipalities and 10 counties. The report identifies multiple directors associated with FireLake-related event records; these associations do not establish employment, ownership, revenue sharing, or contractual relationships.
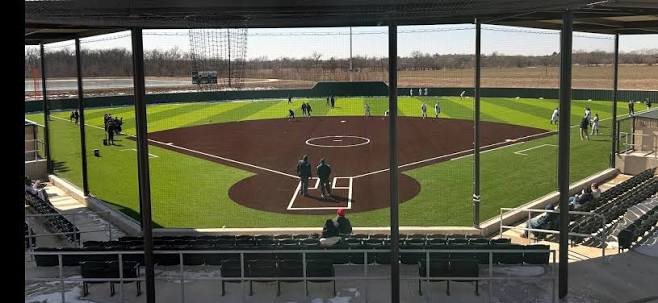


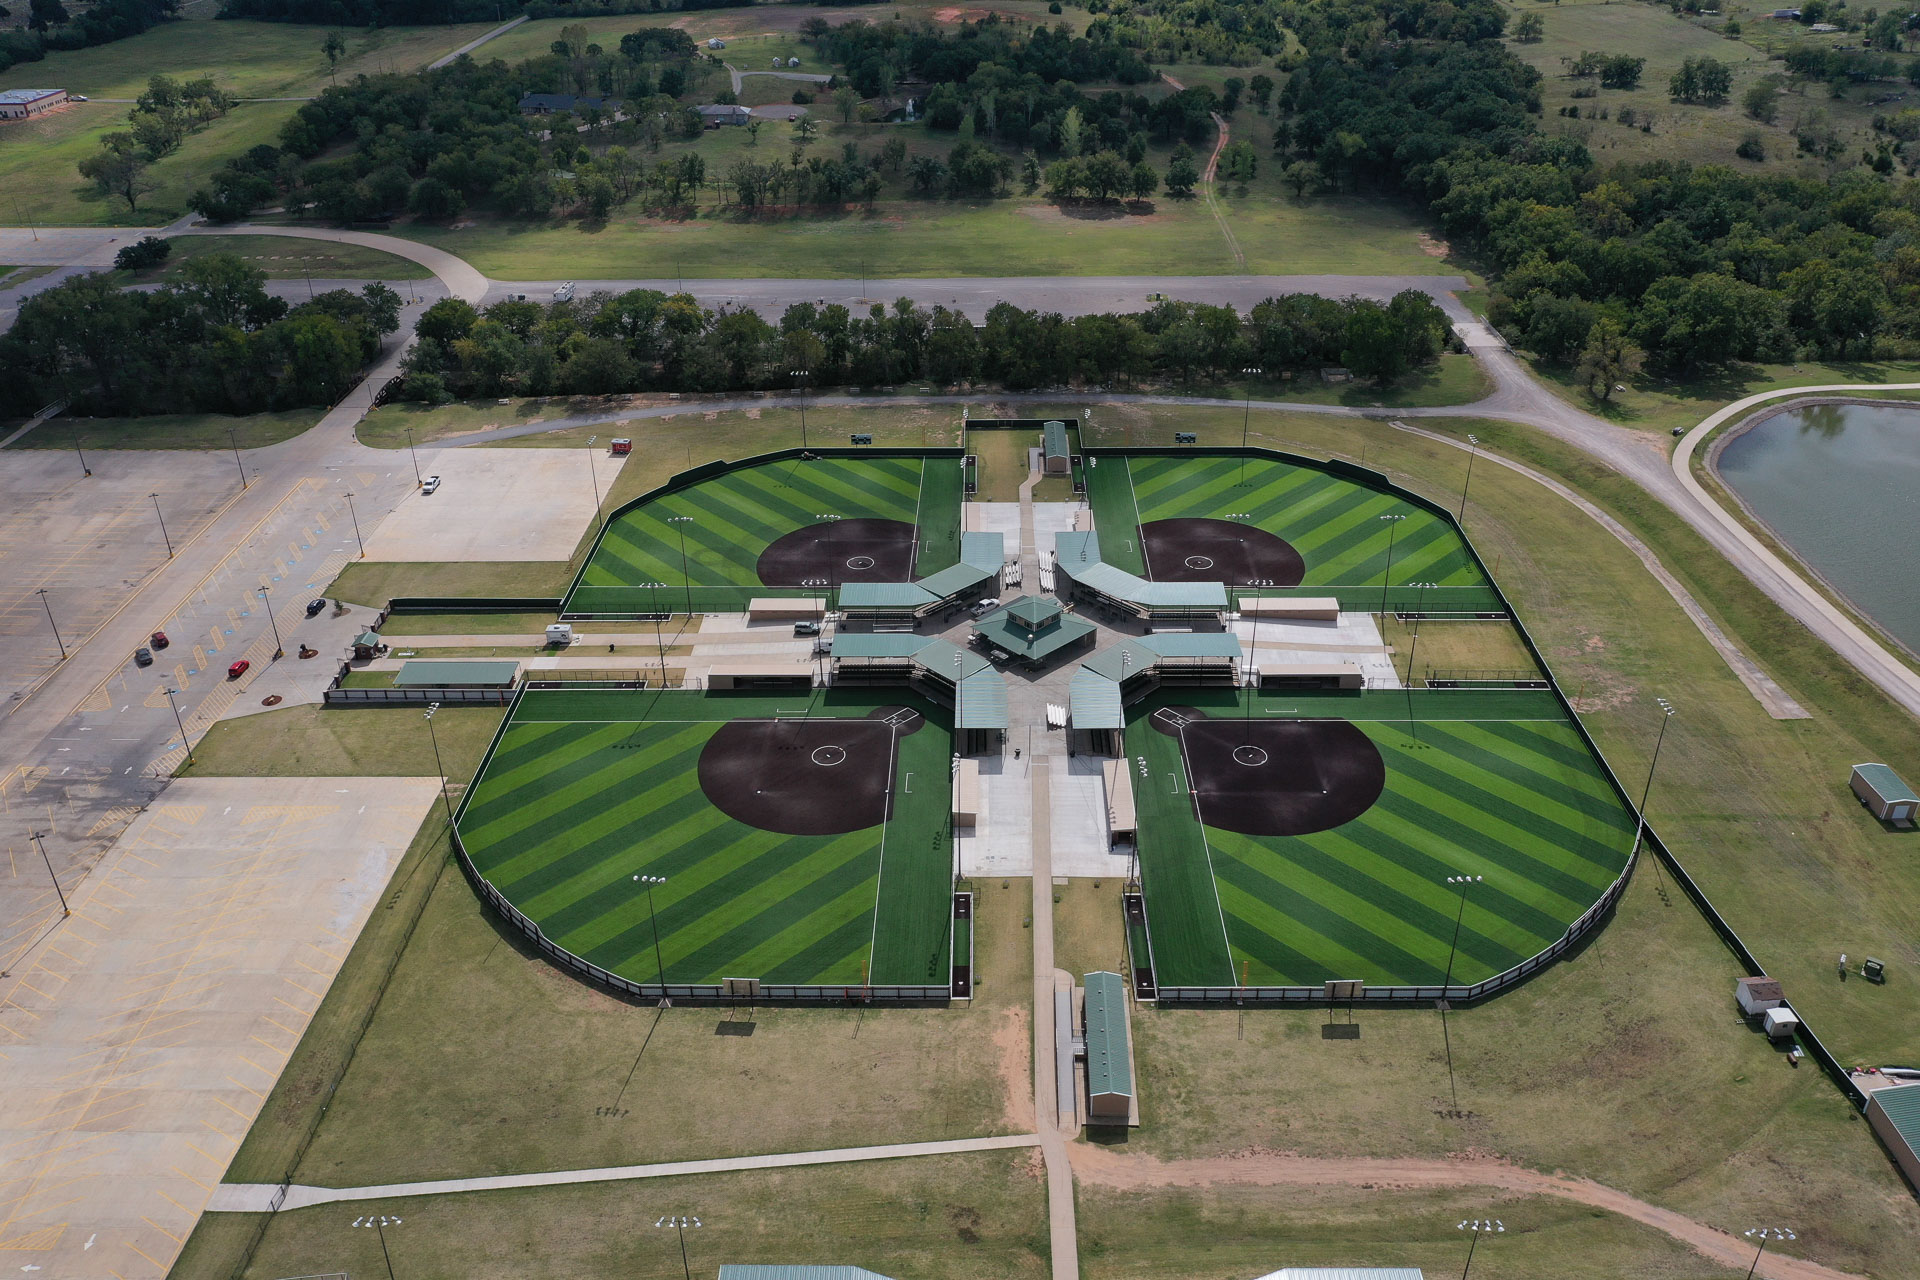
Facility associations, teams, sports, seasons, minimum games, minimum officials, directors, municipalities, counties, publicly posted entry fees, Calculated Team Entry Fees, tournament records, league records, and multi-facility combinations contained in the analyzed source data.
Actual receipts, facility or tribal revenue, director compensation, profit, taxable income, bank ownership, rental payments, revenue sharing, allocation of multi-facility proceeds, locally collected fees, gate or concession revenue, or ultimate disposition of funds.
The FireLake Ballfields direct/stand-alone population identifies $1,419,493 in Calculated Team Entry Fees, consisting of $1,416,493 in softball and $3,000 in baseball. The report documents 4,520 teams, at least 14,715 games, at least 28,725 umpire assignments, 18 directors, one municipality, one county, and 64 league teams with a displayed League Calculated Team Entry Fee of $0.00.
The highest displayed direct season is 2026 at $396.32K. The profile shows a strongly softball-dominant activity pattern across the direct records. The direct director field is led by BIG Show Productions at approximately $1.03 million, followed by Kelly Reavis and Jason OConnor.
A separate associated multi-facility population totals $925,585, involving 1,529 teams, at least 5,198 games, at least 10,313 umpire assignments, 21 facilities, 6 directors, 14 municipalities, and 10 counties. The combined Page 4 footprint totals $2,345,078 with 6,049 teams, at least 19,913 games, and at least 39,038 umpire assignments across 22 facilities, 18 directors, 15 municipalities, and 10 counties.
The combined footprint is a measure of documented activity associated with FireLake Ballfields across both direct and multi-facility records. It should not be interpreted as proof that the entire combined amount, or all teams, games, officials, or other activity, occurred exclusively at FireLake Ballfields.
This page is an independent research and analytical publication created for research, education, transparency, documentation, and public-interest analysis. It is not an official USSSA report and is not represented as prepared, sponsored, endorsed, verified, or approved by USSSA, its directors or affiliates, Citizen Potawatomi Nation, any municipality, county, tribe, school district, facility owner, or other organization appearing in the research.
Calculated Team Entry Fee figures are research estimates derived from publicly available information and the Hidden Valley methodology. They are not audits, tax determinations, forensic-accounting conclusions, legal findings, or allegations that any person or organization received, retained, concealed, misreported, or improperly used the calculated amounts. Identification within the dataset does not itself imply wrongdoing, misconduct, tax noncompliance, criminal activity, or civil liability.