
OKC Boomtown Ballyards
OKC Boomtown Ballyards
A facility-level research profile examining documented USSSA tournament activity, team participation, modeled event finances, event-host concentration, and economic impact associated with this Oklahoma City venue.
OKC Boomtown Ballyards in the Hidden Valley study
OKC Boomtown Ballyards is treated as a distinct facility node within the Hidden Valley Integrity of the Game longitudinal research framework. The facility filter isolates USSSA-related records attributed to the venue so participation, team-entry fees, gate and concession estimates, umpire fees, event-income and net estimates, economic impact, and event-host patterns can be reviewed together.
This page preserves the facility research graphics and supporting executive summary in one public-facing record. The financial measures are research-model estimates derived from the underlying tournament dataset and should not be interpreted as audited financial statements, verified receipts, or proof that any particular person or entity received the modeled amounts.
Research metrics at a glance
Aggregate facility-filtered team entries.
Modeled entry-fee activity.
Modeled event-gate activity.
Modeled concession activity.
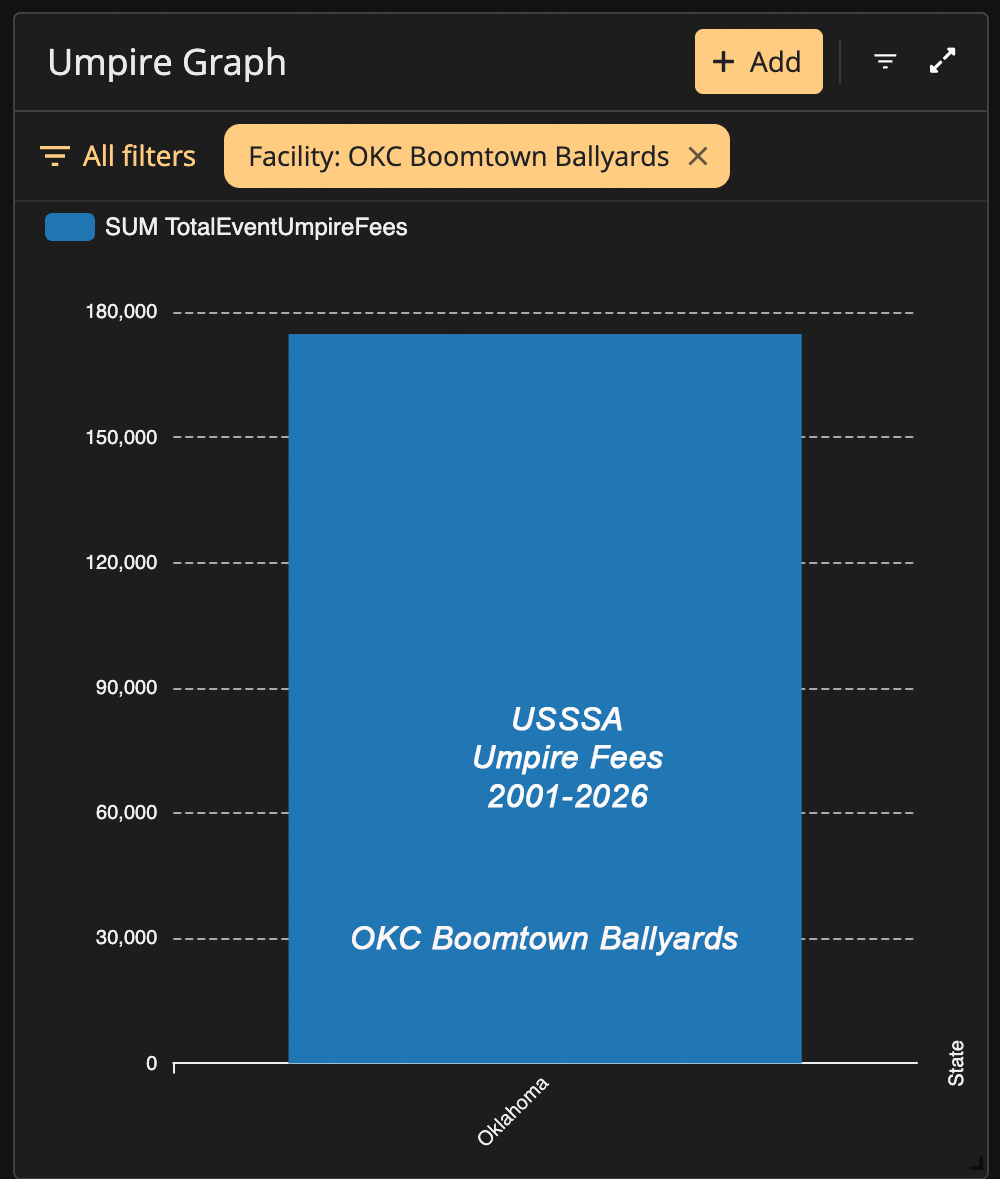
Estimated officiating expense.
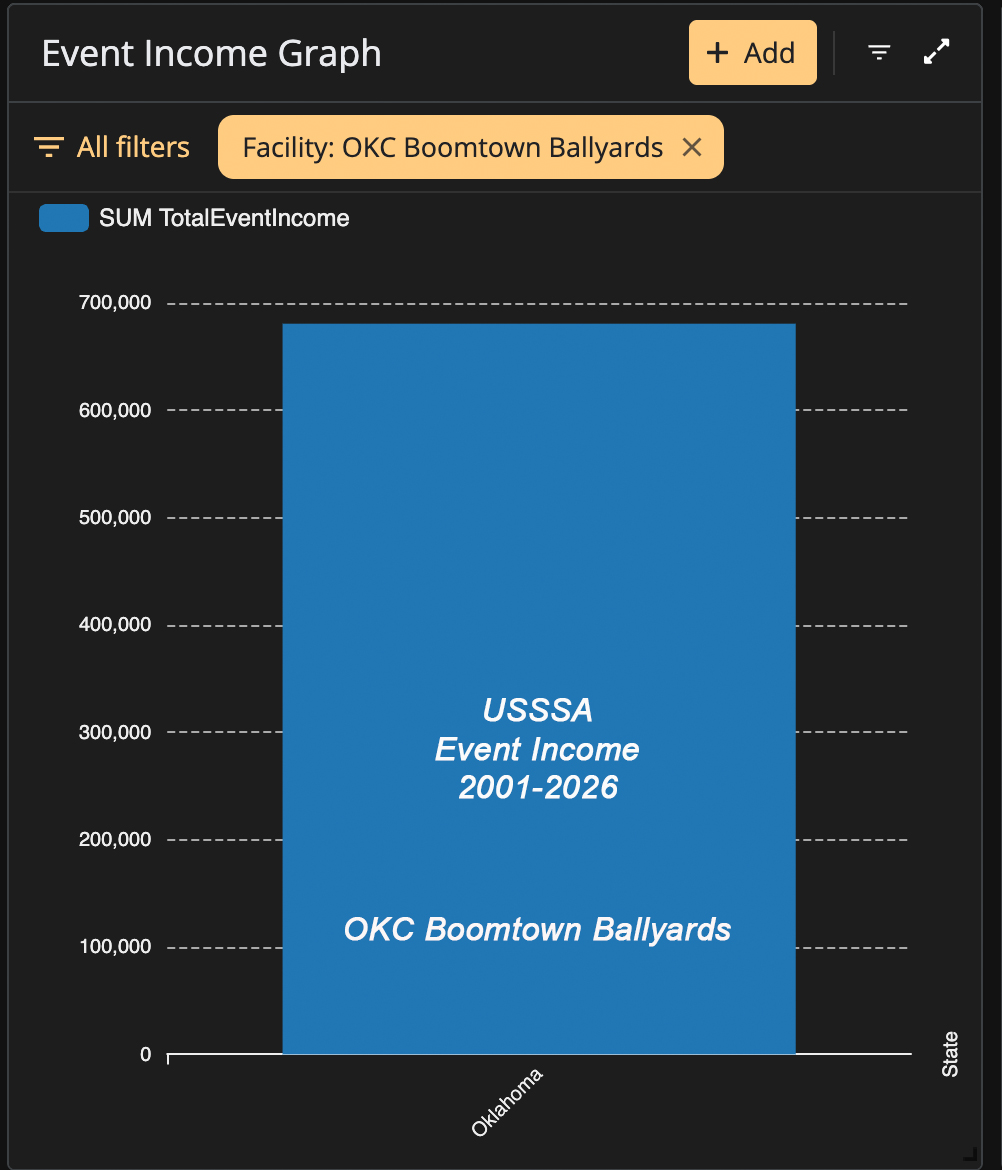
Modeled combined event-income measure.
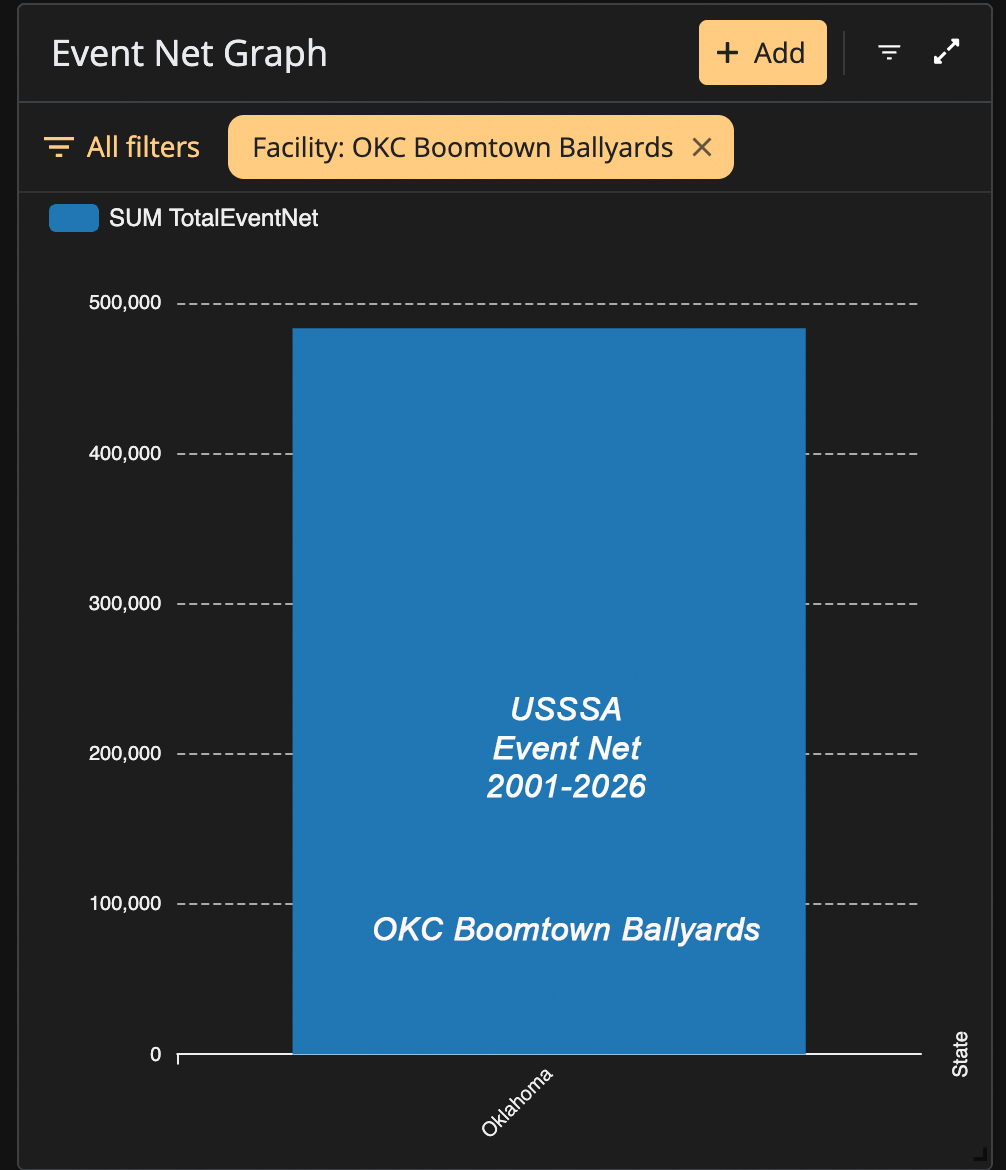
Modeled net-event measure.
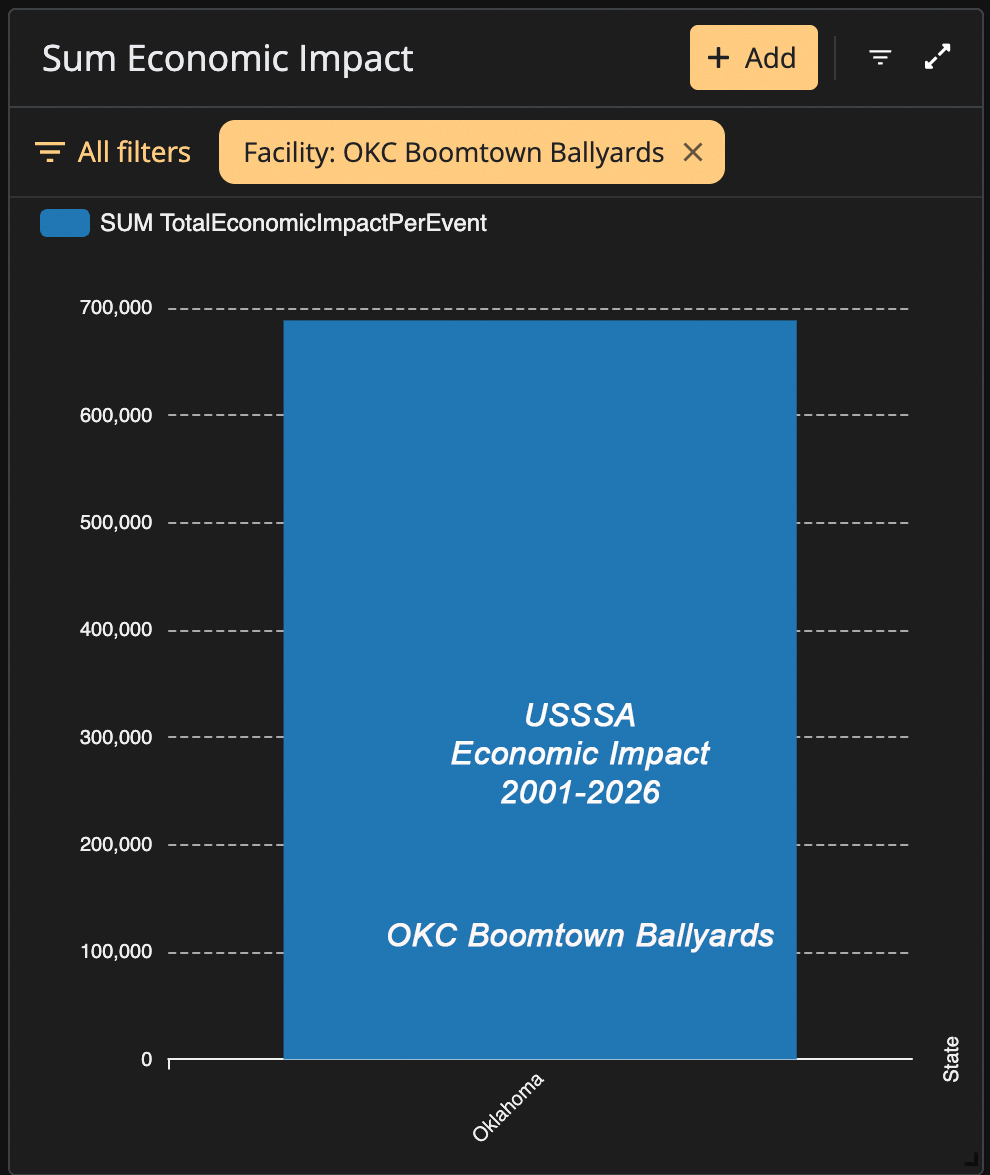
Estimated economic-impact measure.
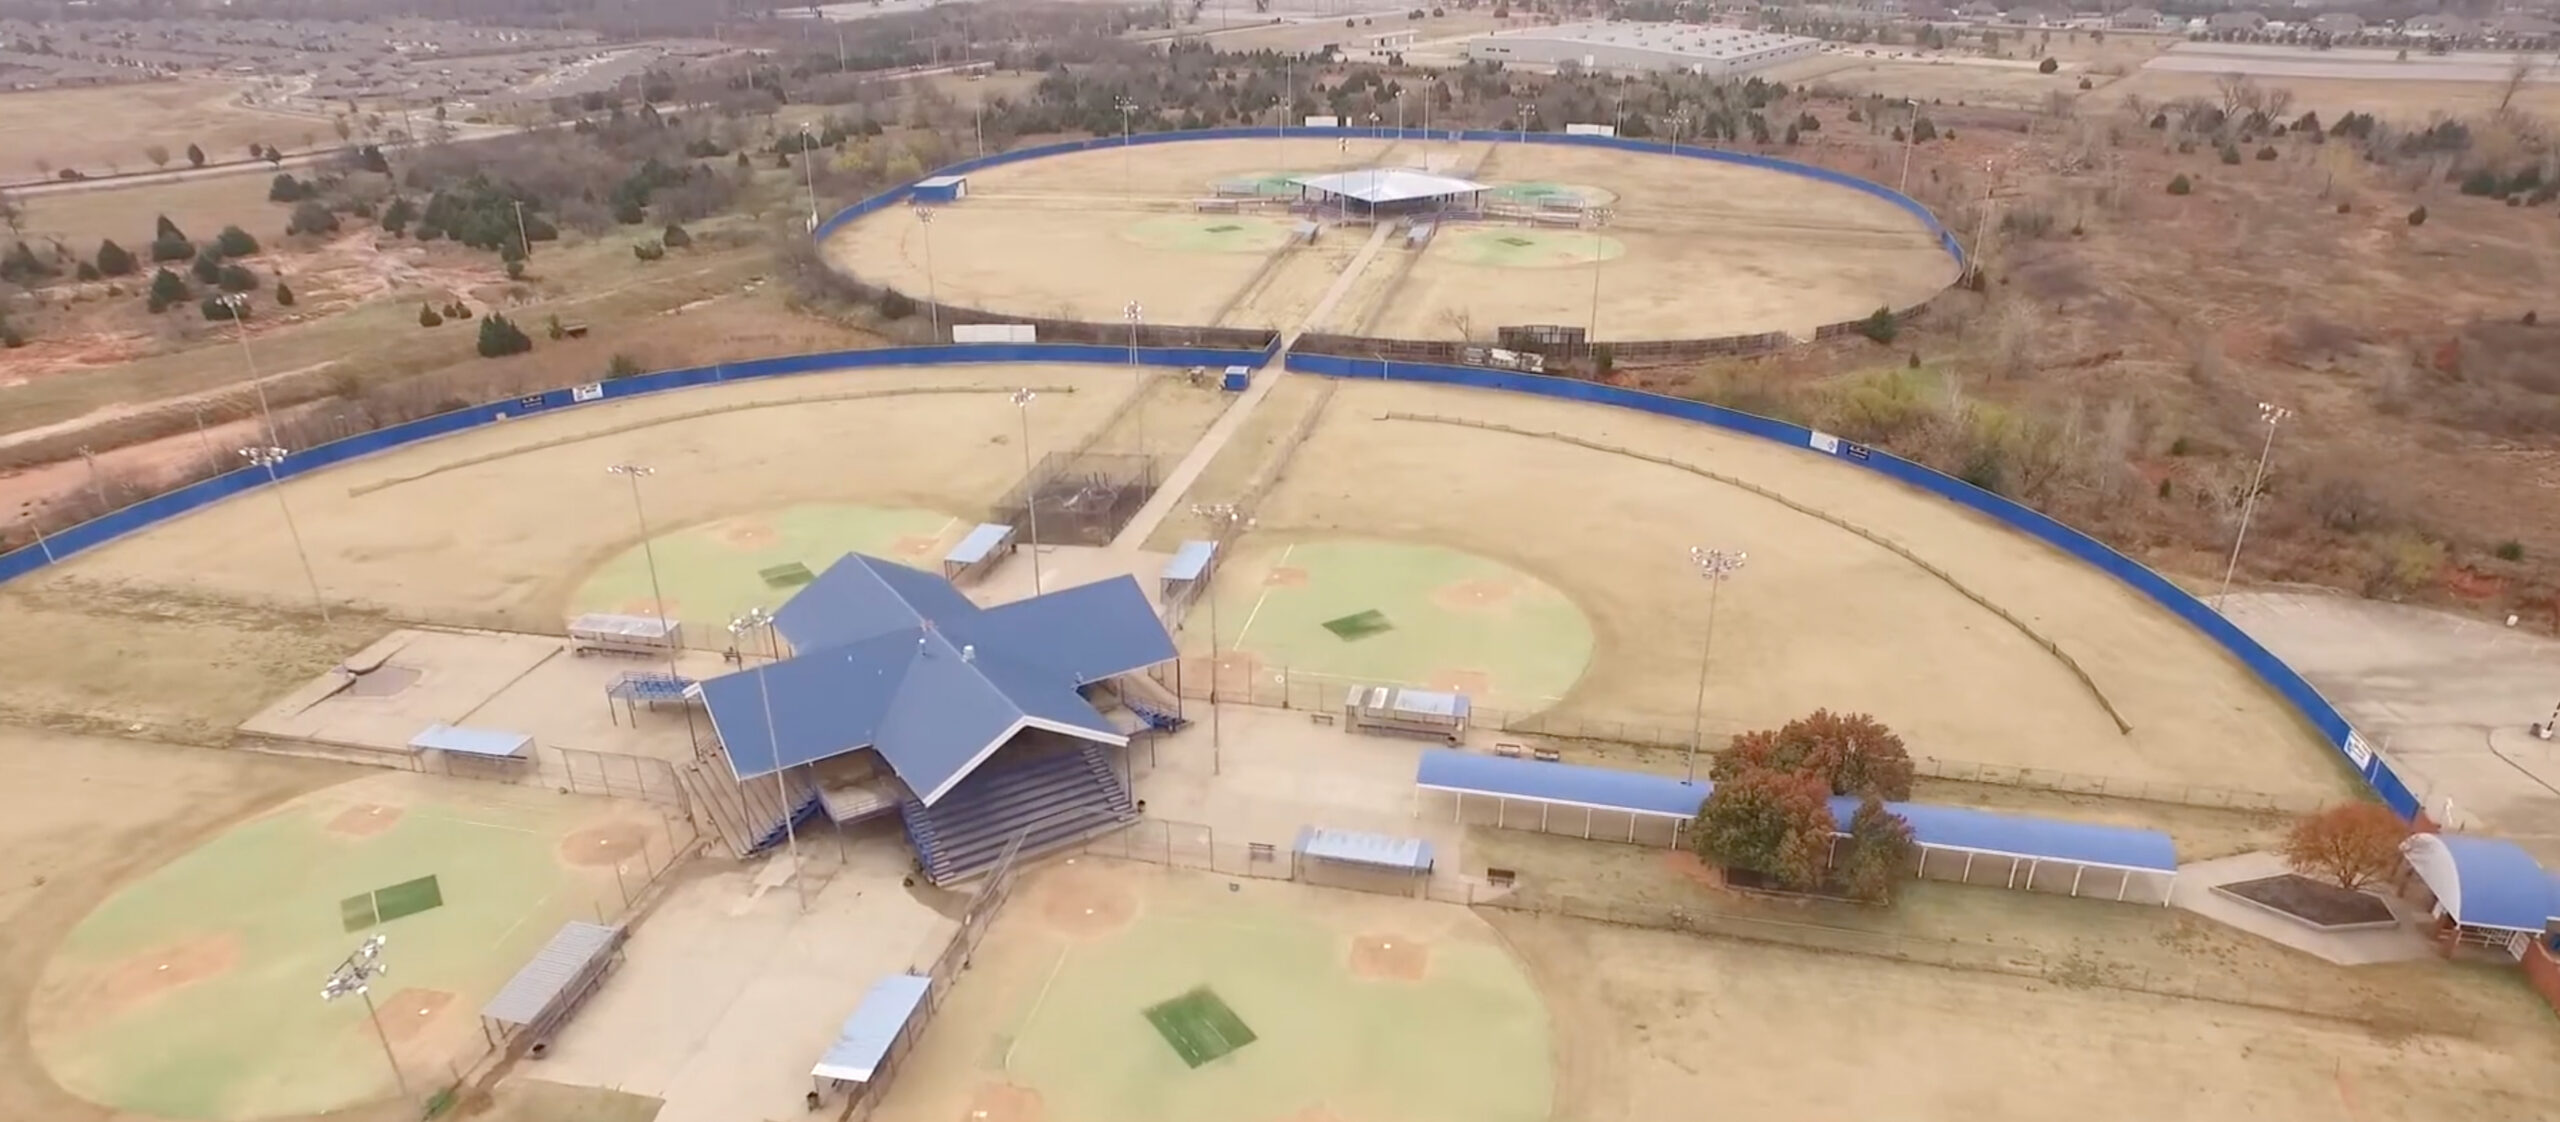
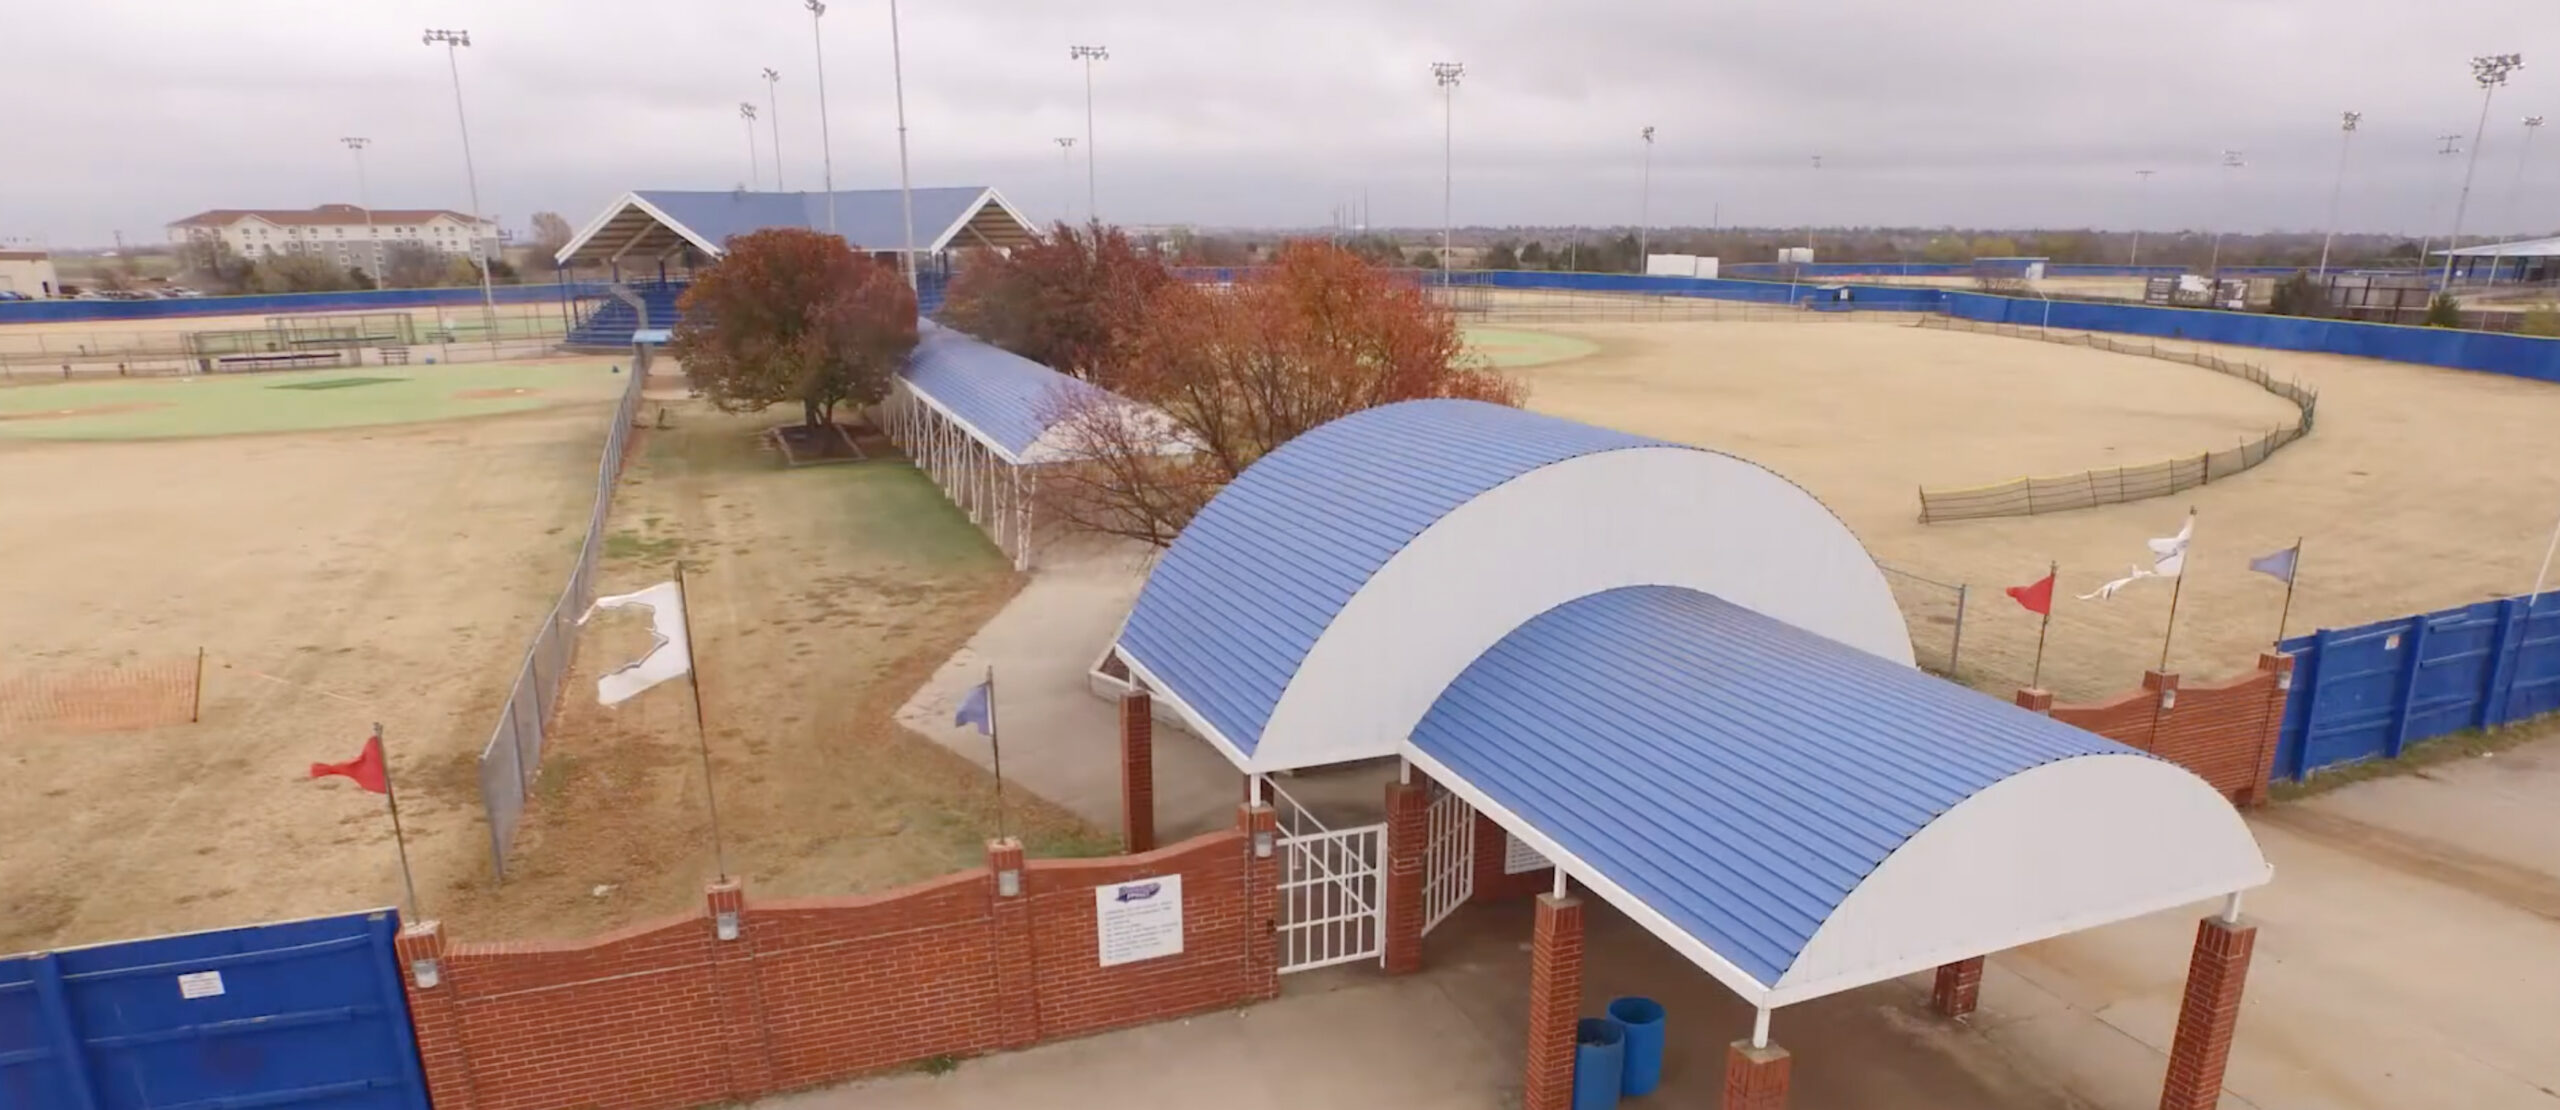
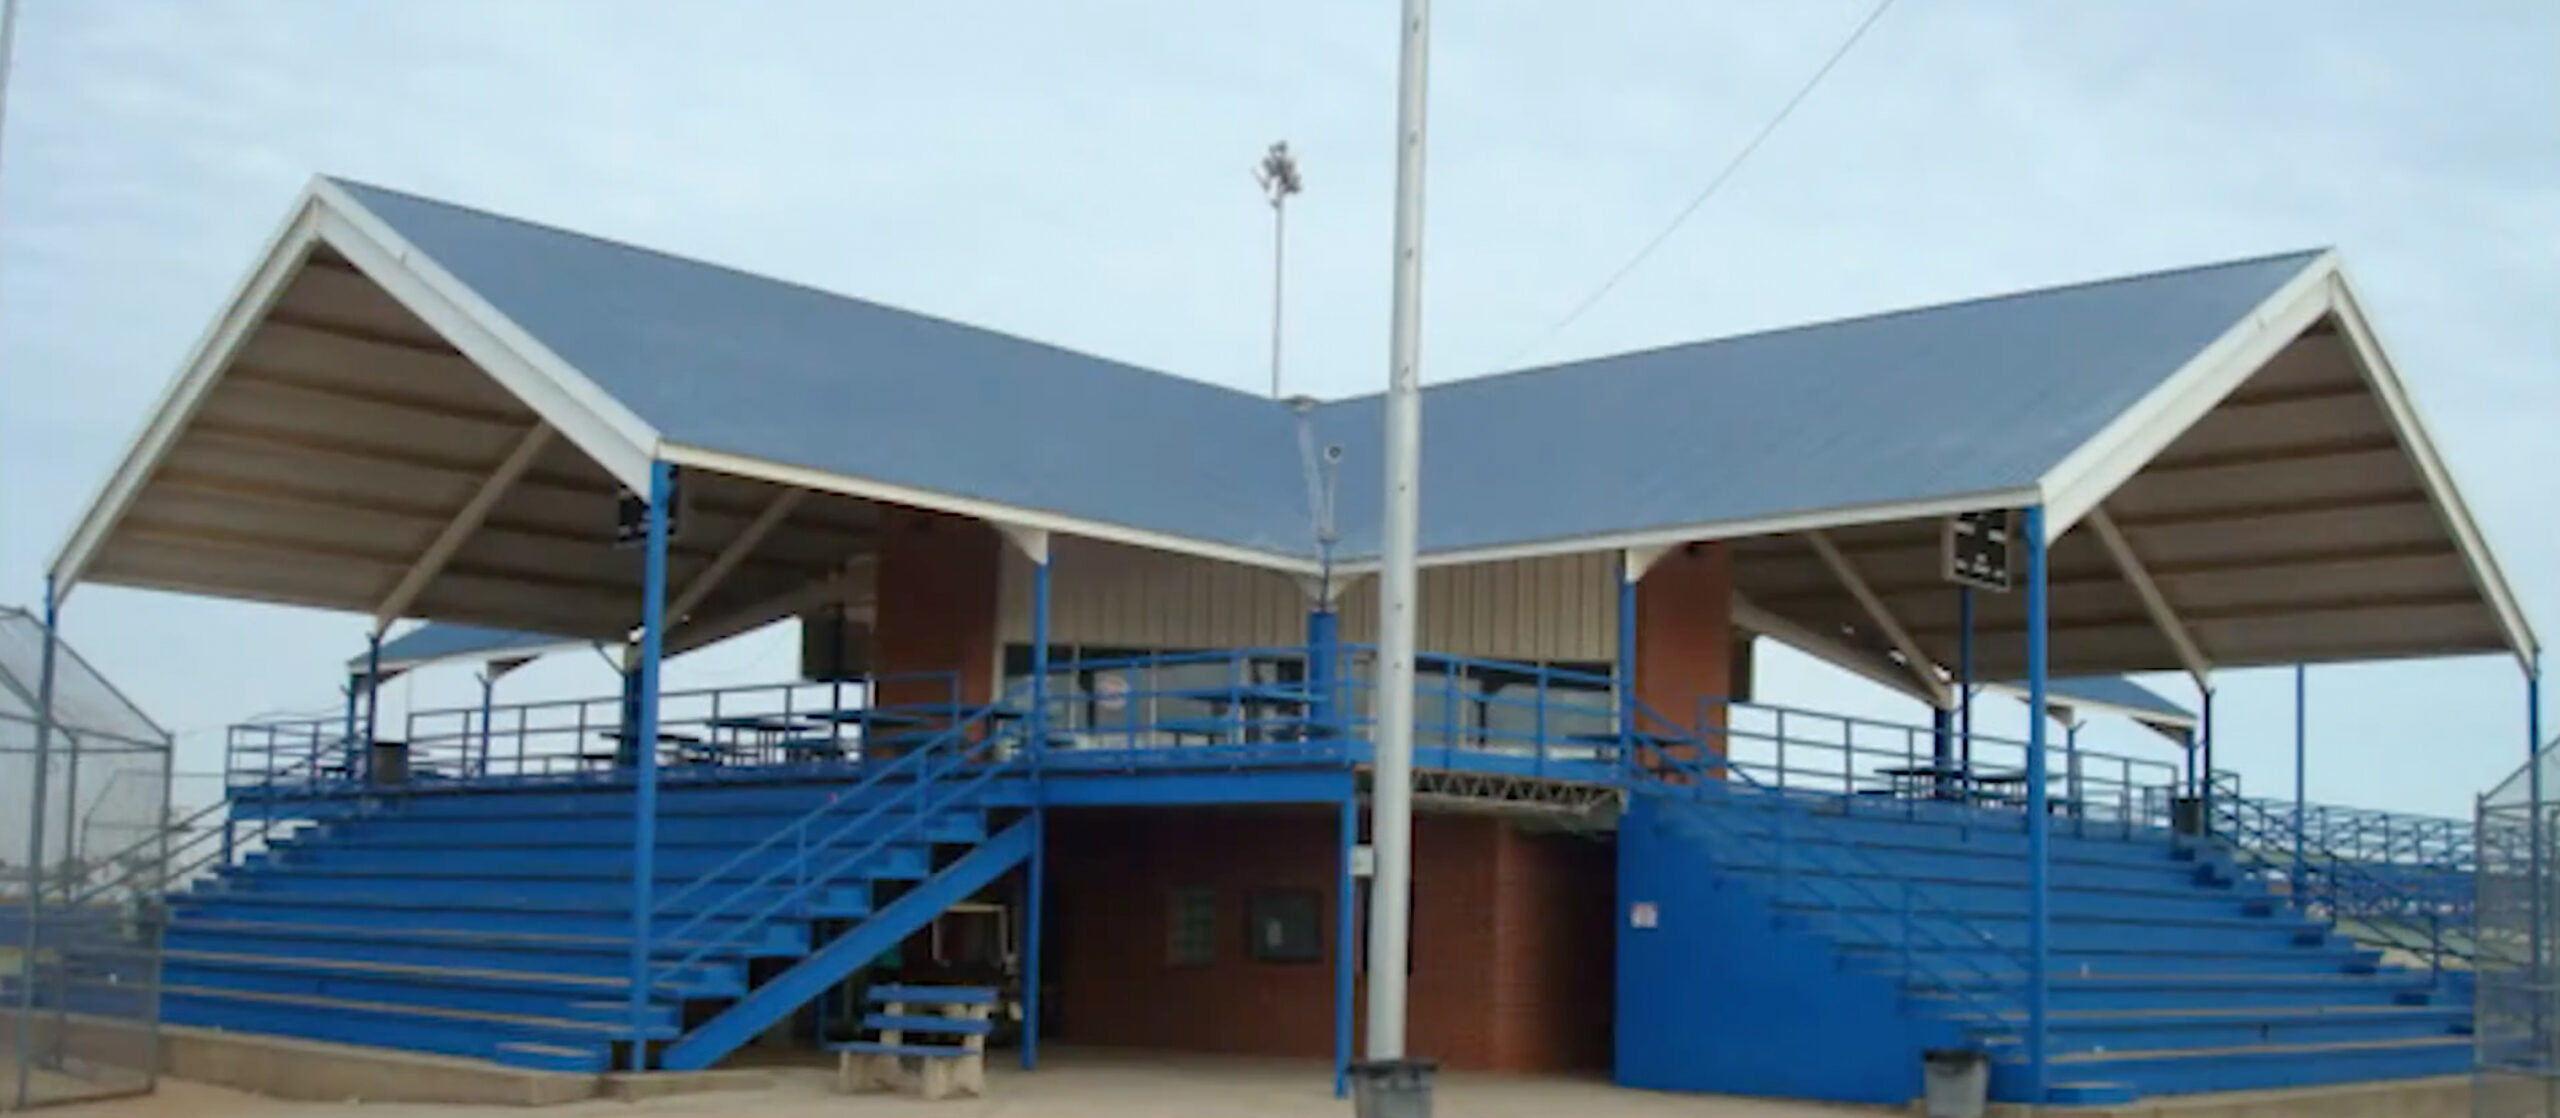
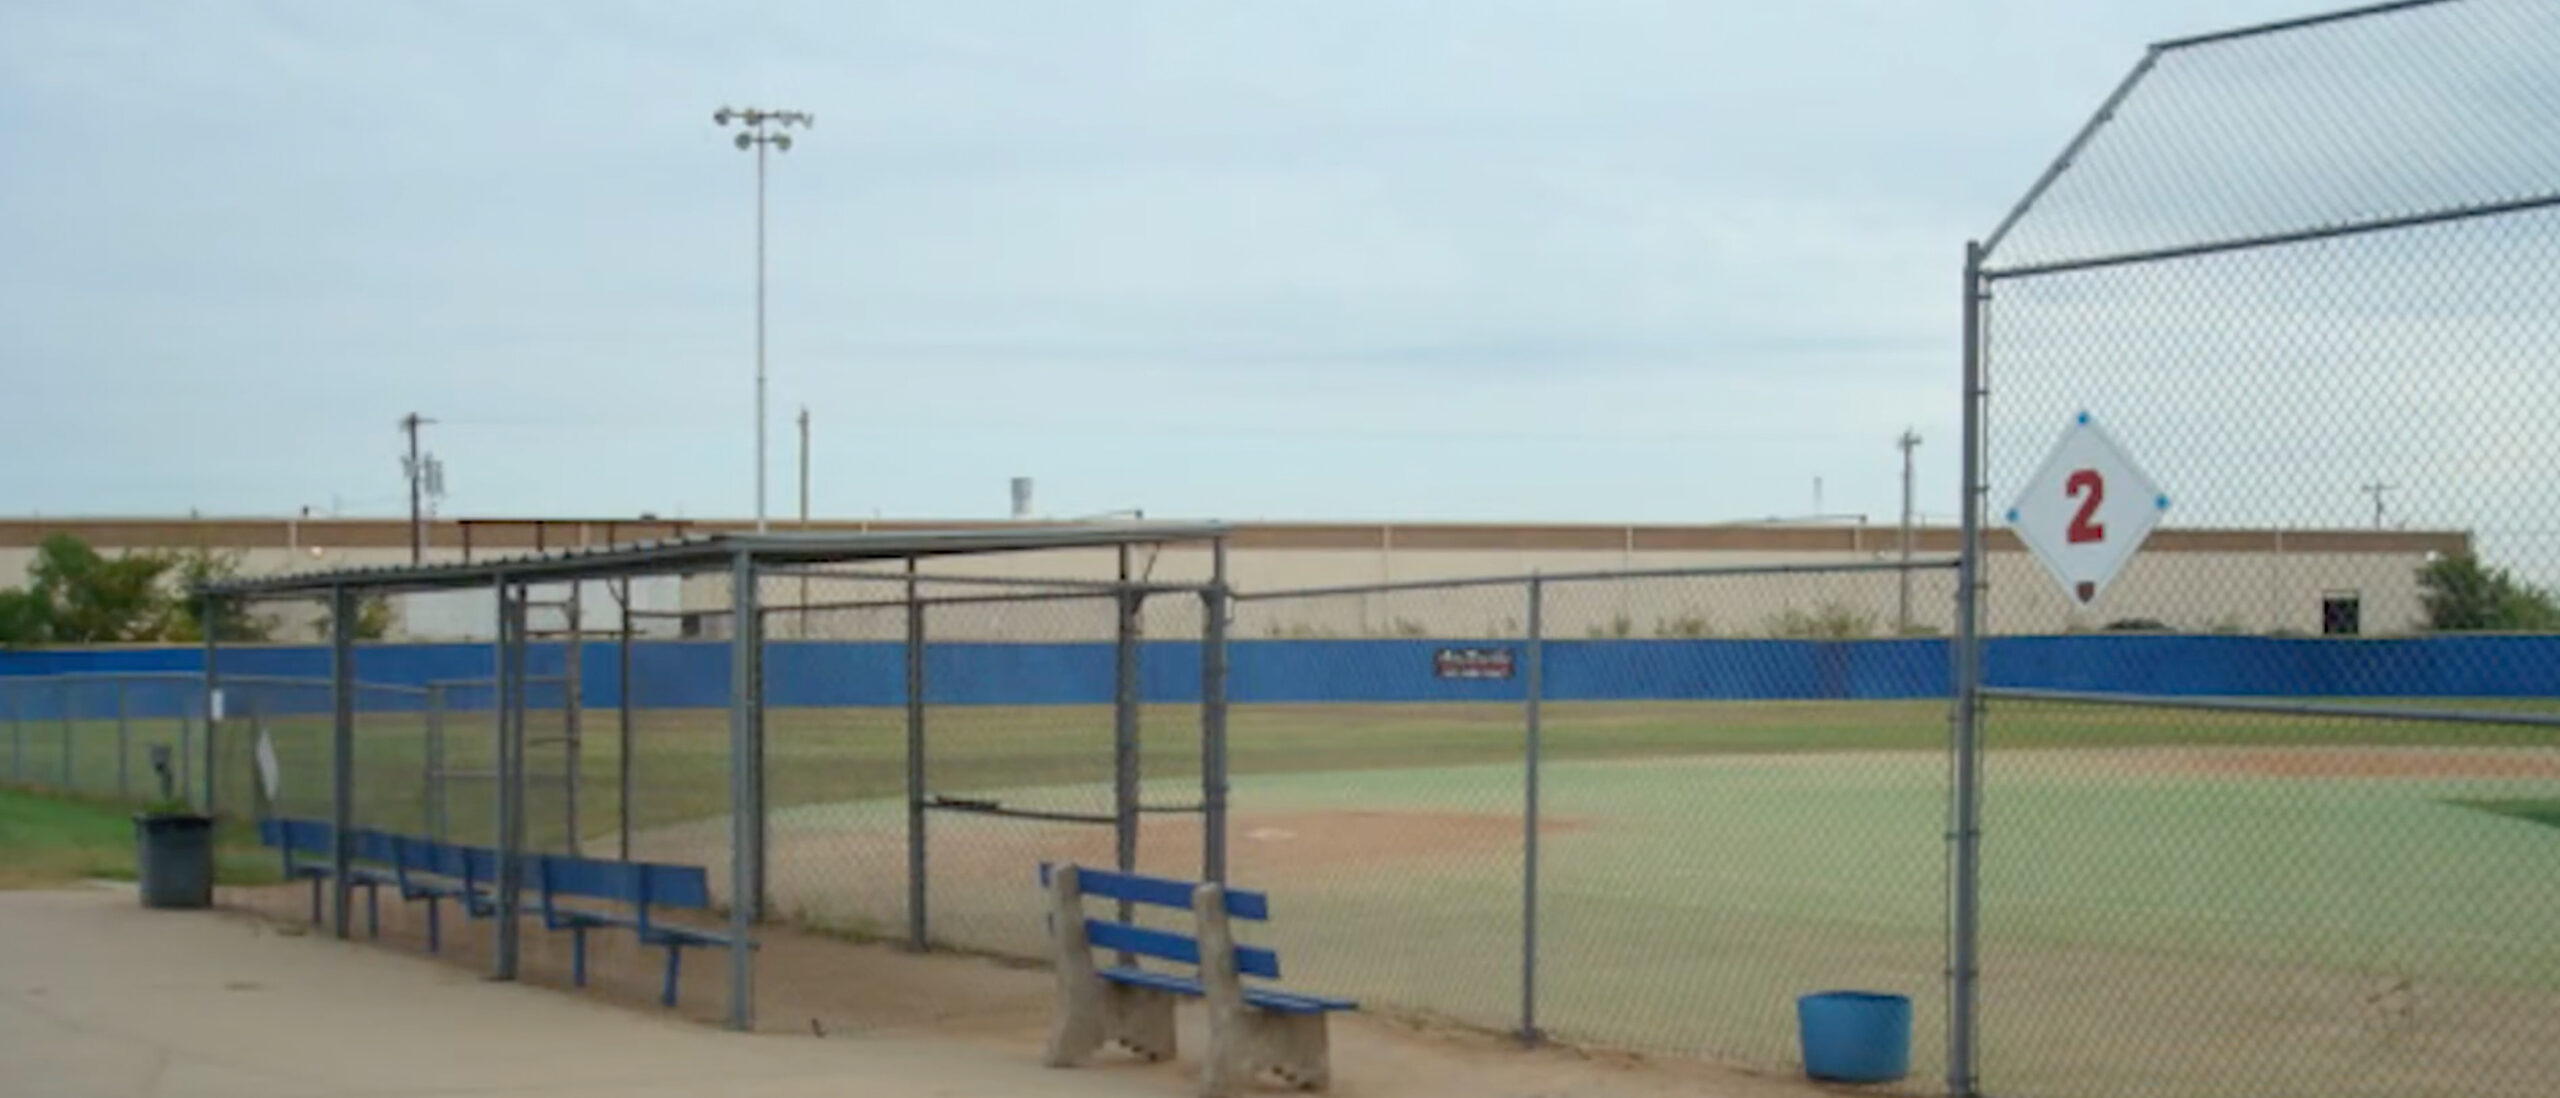
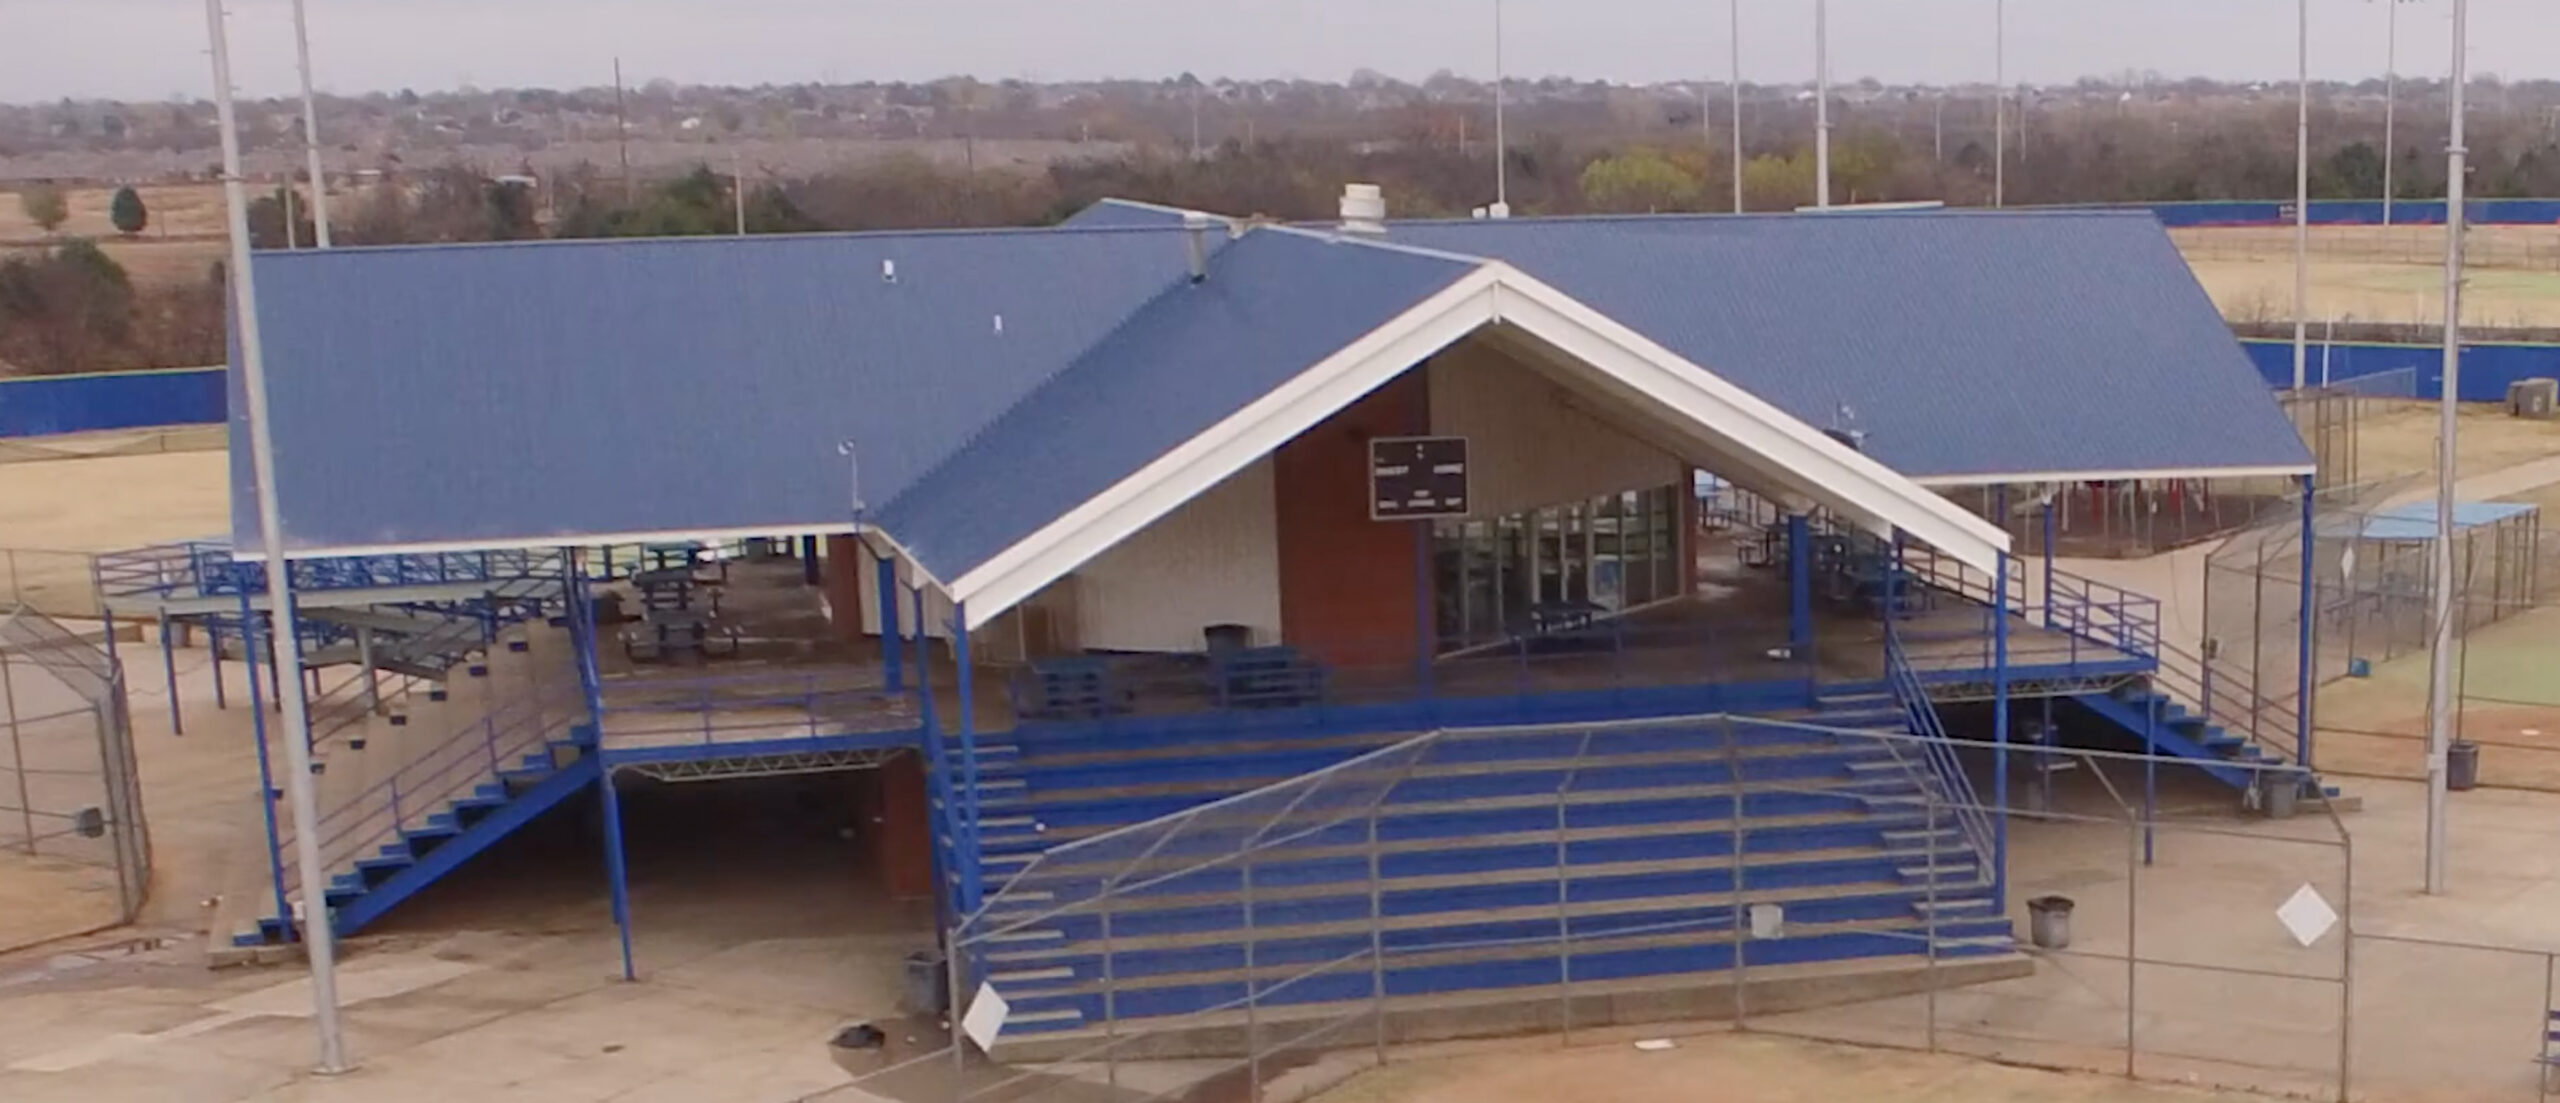
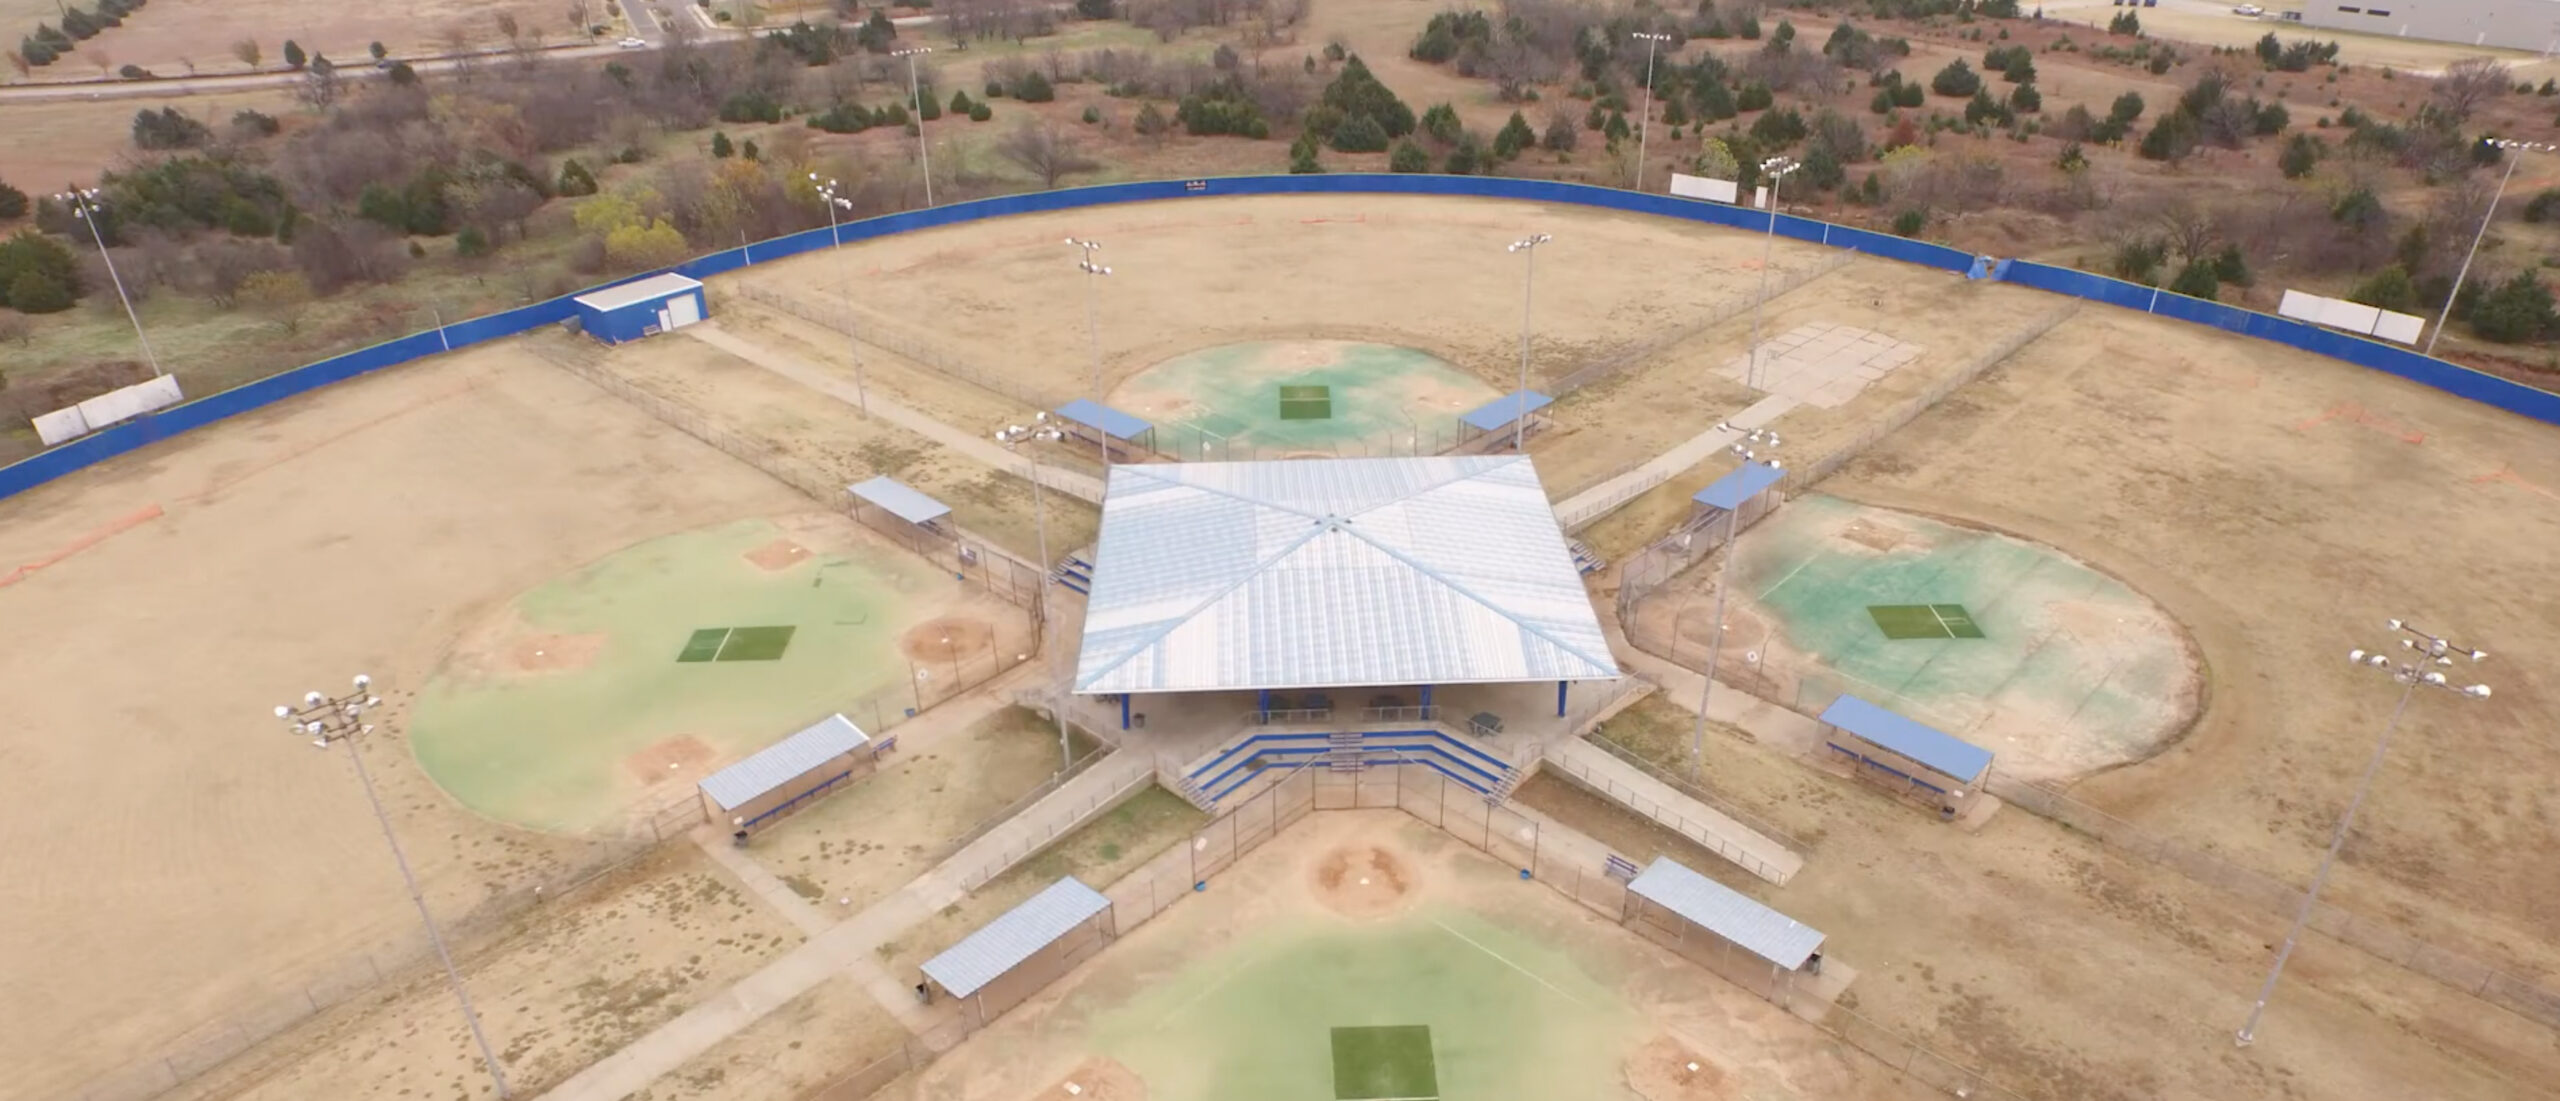
Visual record of the Ballyards
The facility photographs provide physical context for the venue represented in the tournament dataset. Select any image to open the full-size source graphic.
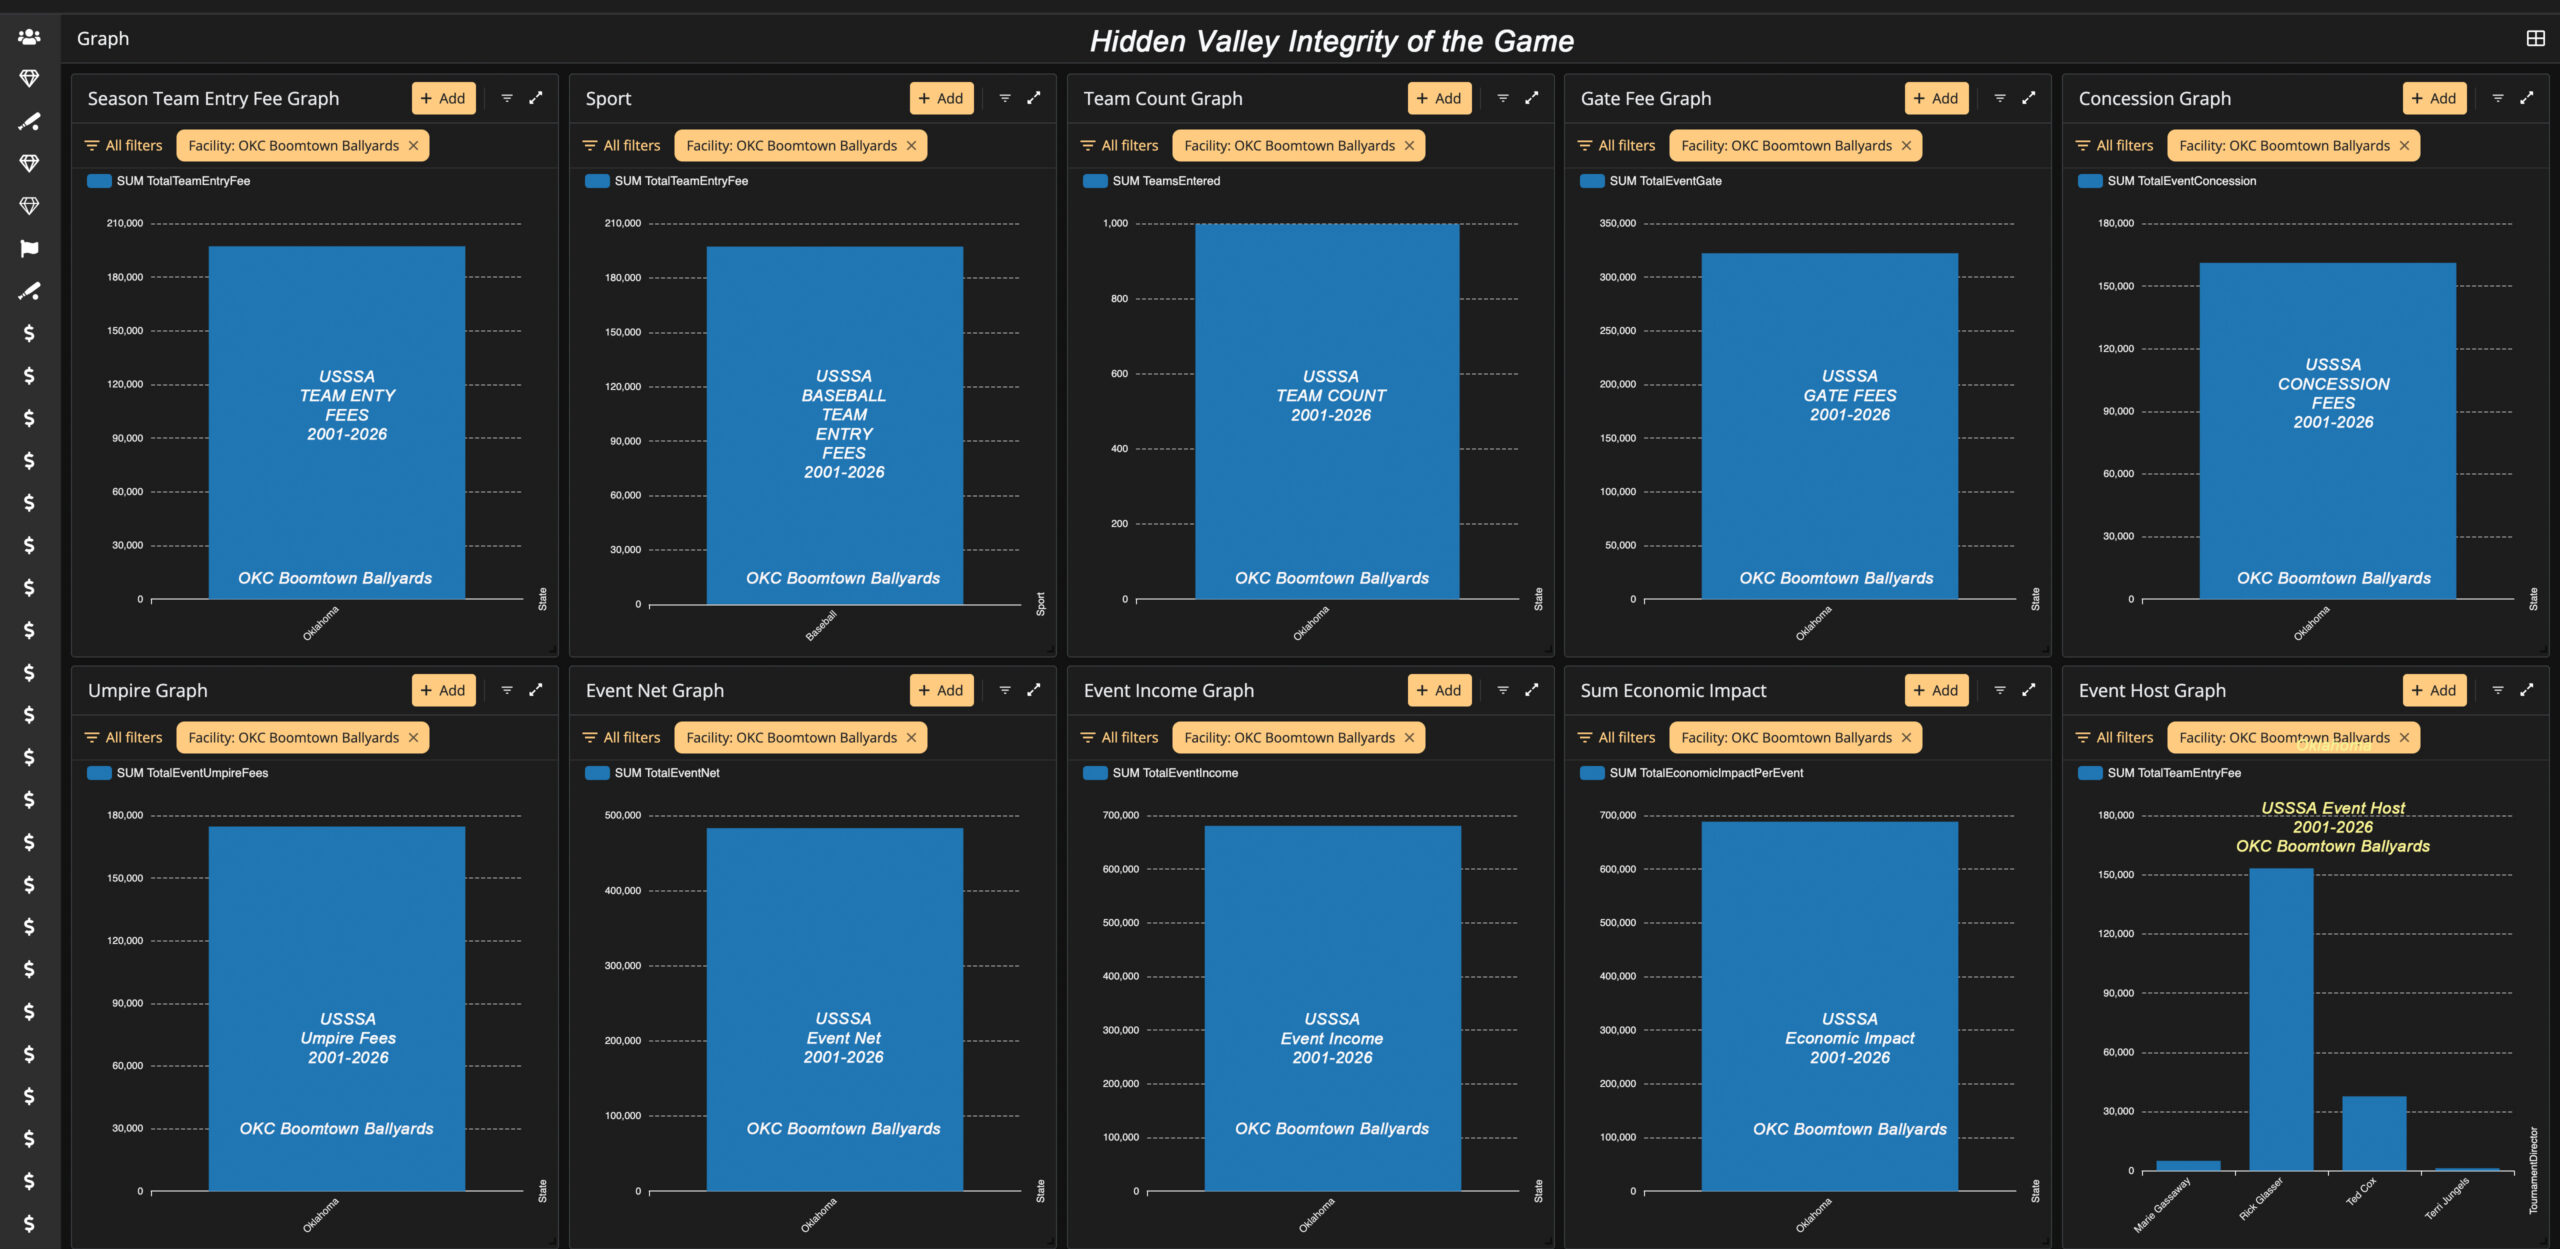
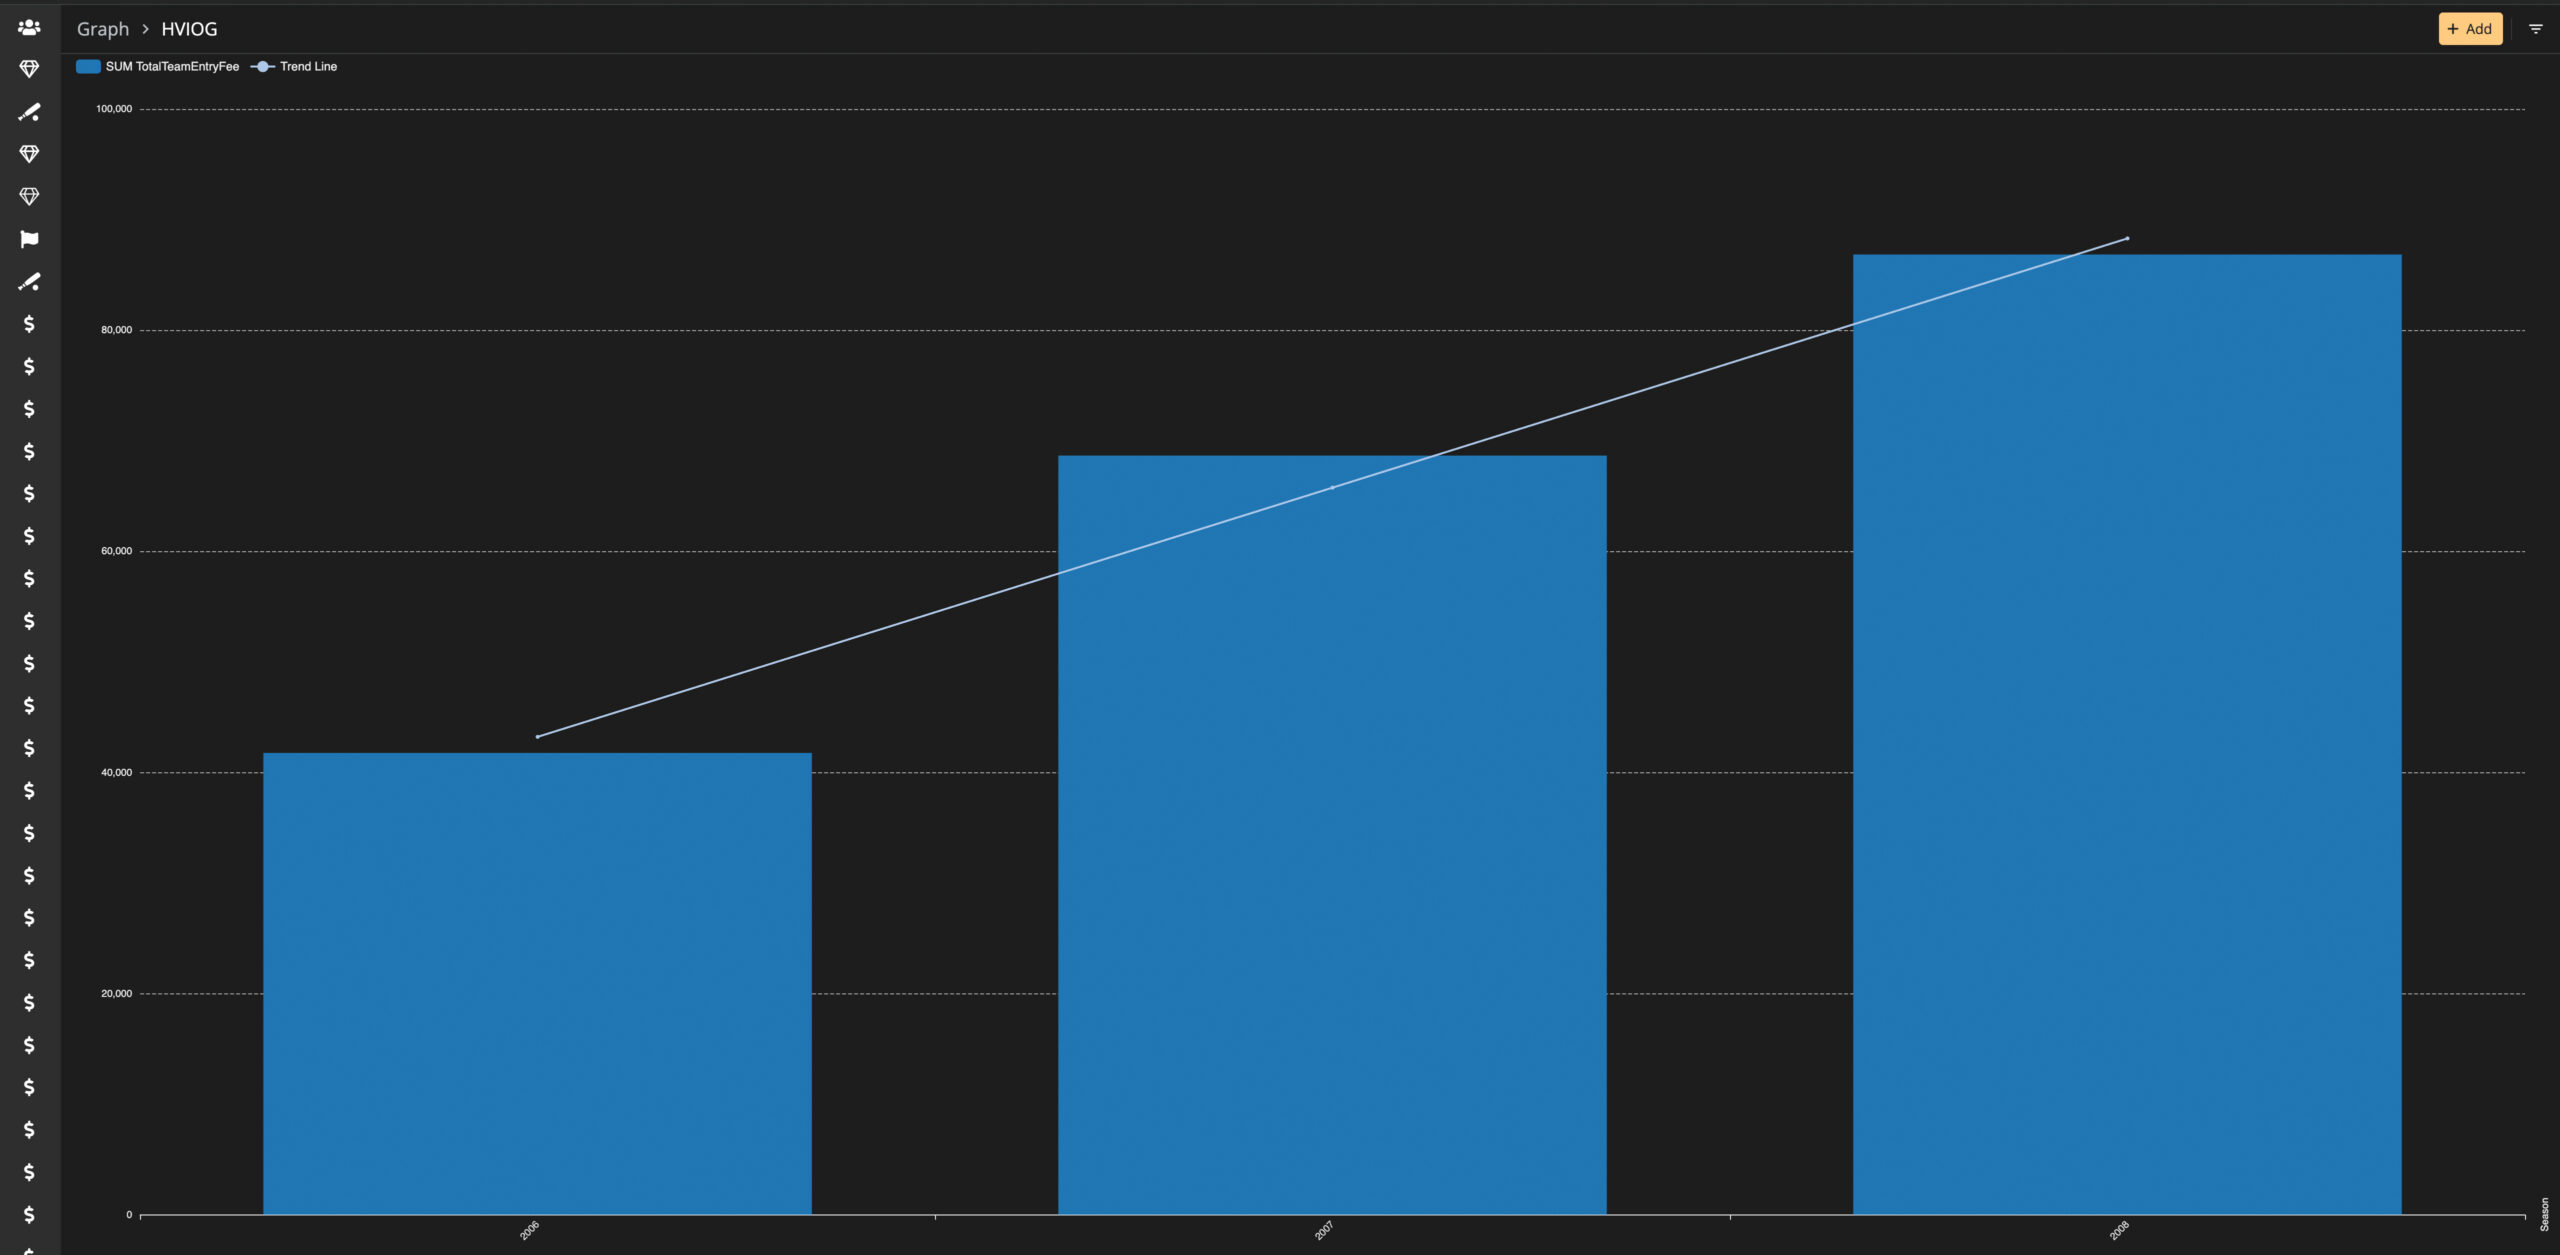
USSSA participation and financial graphics
The gallery below preserves the principal facility-filtered graphics used to communicate the research findings. Each graphic can be opened individually for closer review.
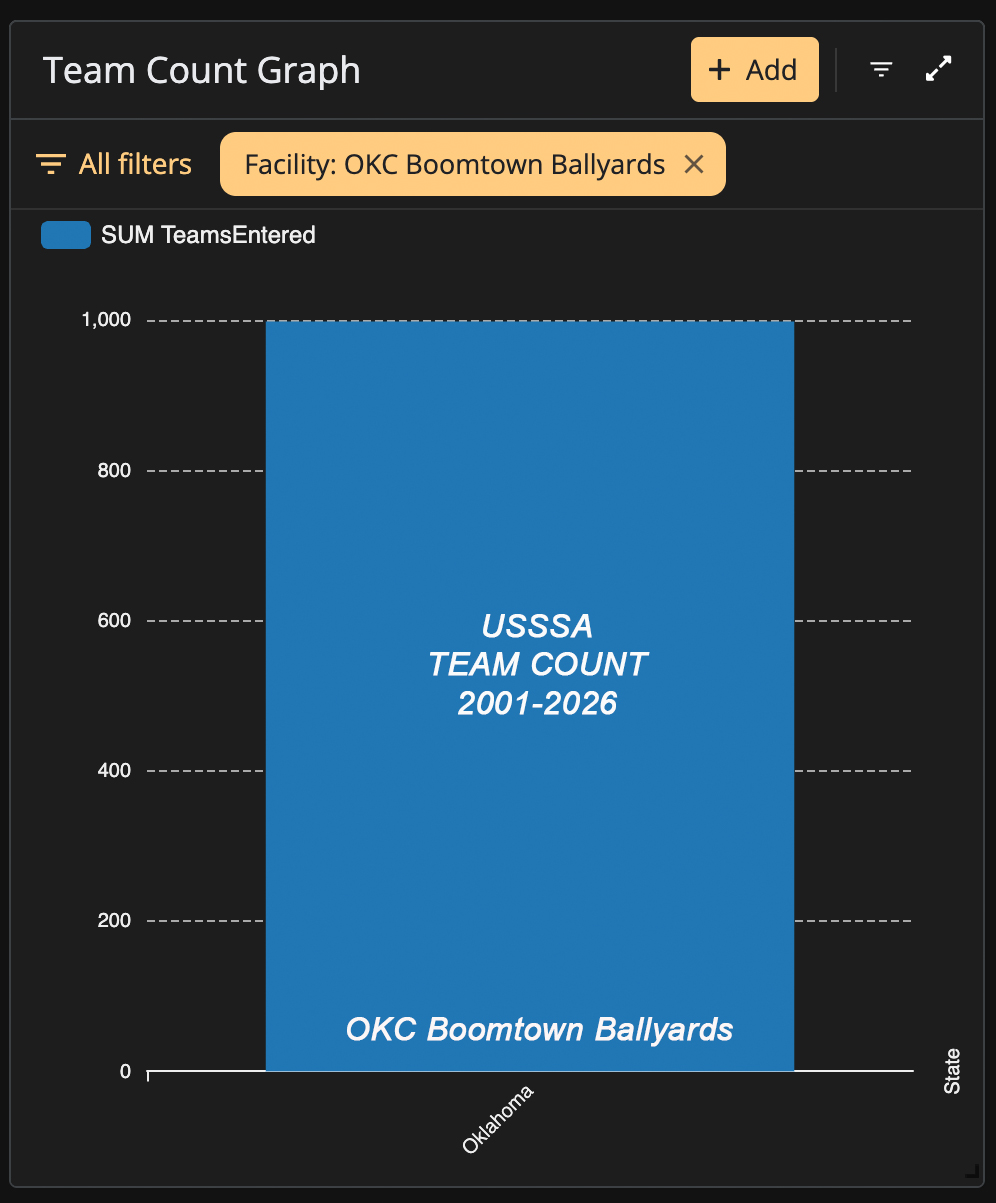
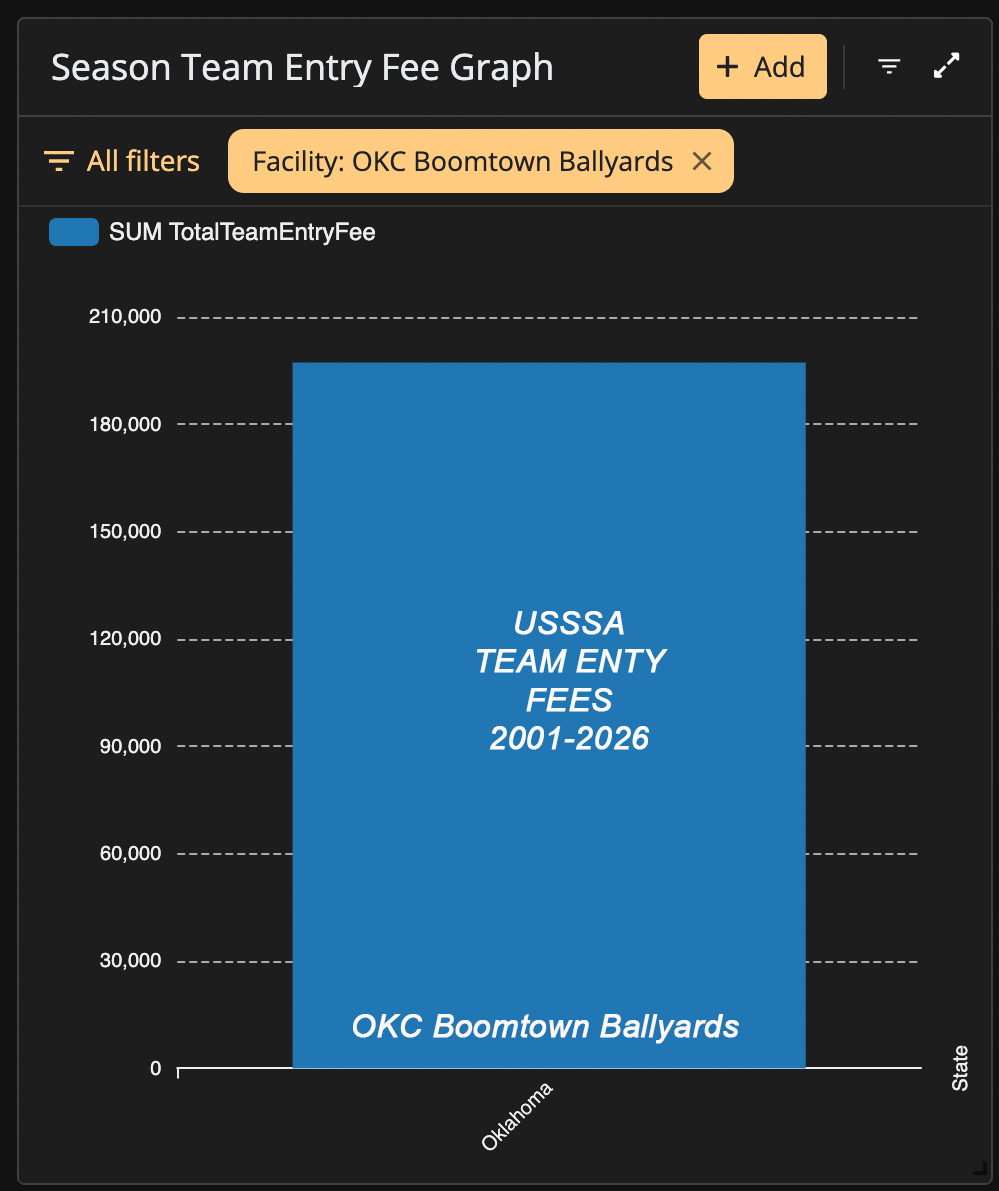
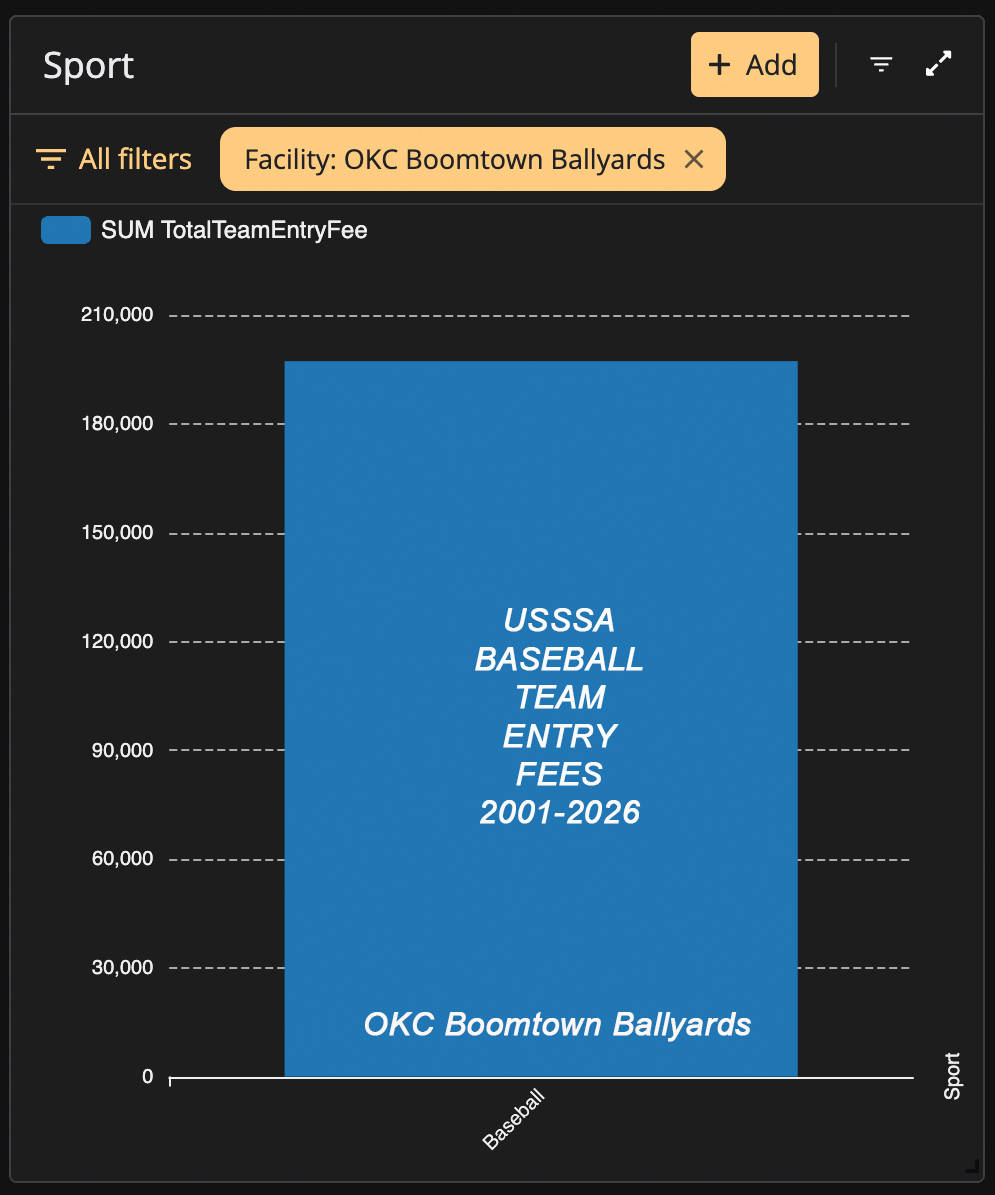

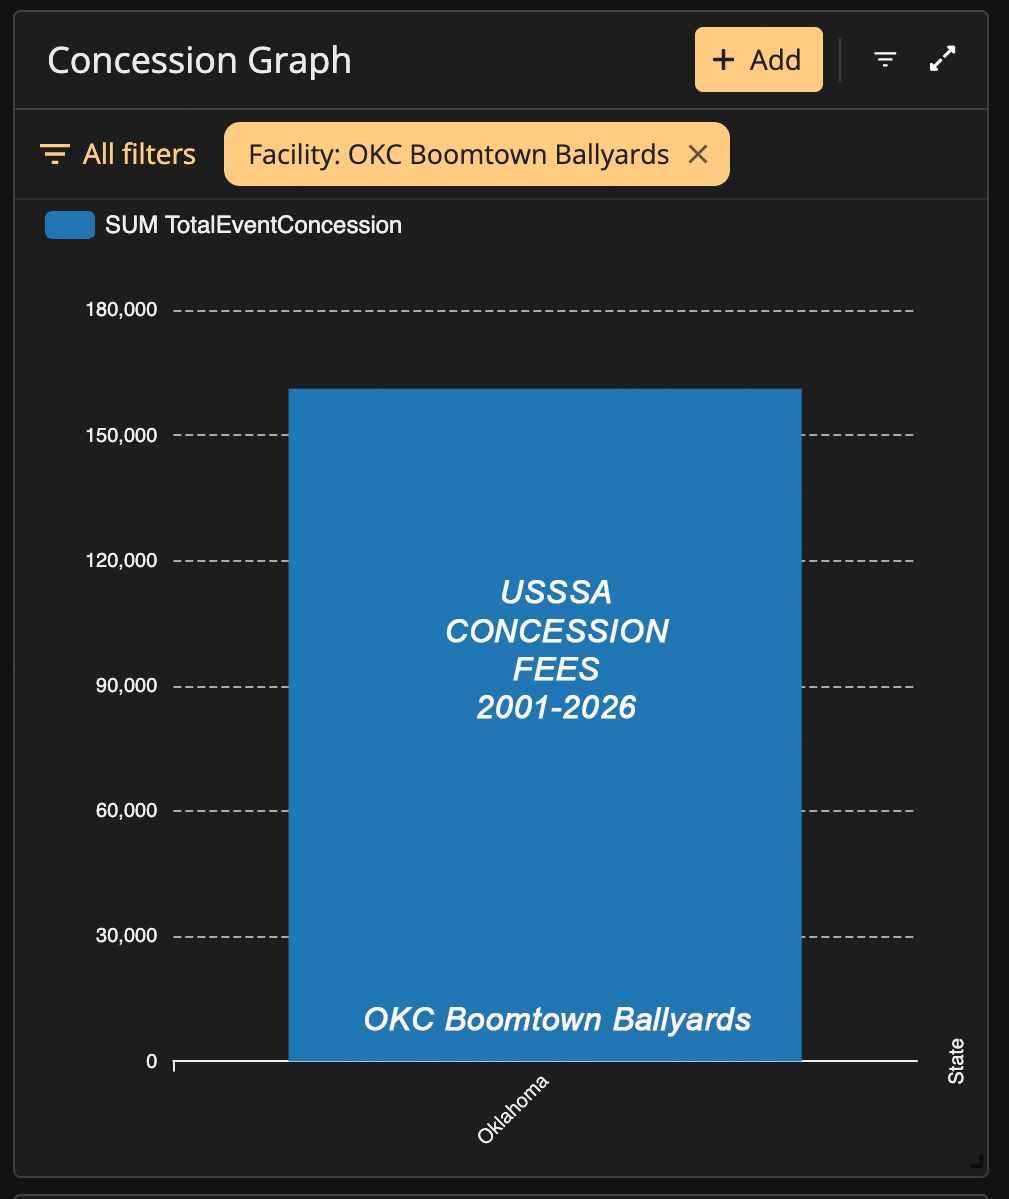
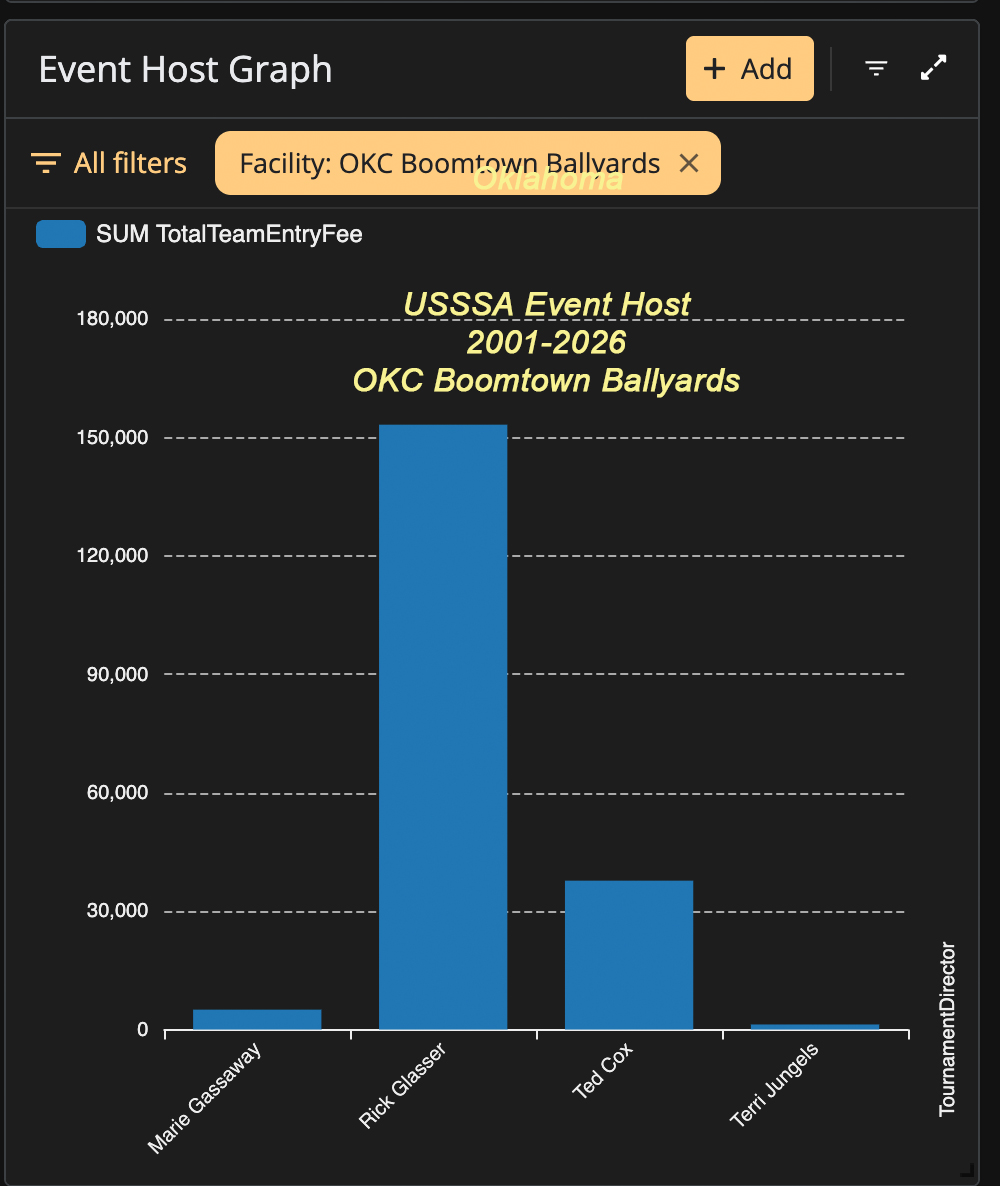
Event-host concentration
The event-host graphic adds an administrative dimension to the facility analysis by showing how recorded team-entry-fee activity is distributed among tournament directors or event hosts associated with the facility records. This is analytically different from alleging ownership of facility revenue: the chart identifies patterns within the research dataset and is intended to support transparency, cross-comparison, and follow-up source review.
OKC Boomtown Ballyards USSSA 2001–2026 Executive Research Summary
The Executive Research Summary consolidates the facility-level findings, explains the research framing, and places the participation and financial indicators into the broader Hidden Valley Integrity of the Game initiative.
Methodology, interpretation, and public-use disclaimer
The Hidden Valley Integrity of the Game project is an independent research initiative. Its facility-level financial figures are analytical estimates produced from the research dataset and defined assumptions. They are not audits, tax determinations, accounting opinions, or findings by USSSA, the City of Oklahoma City, a court, a regulator, or another governmental authority.
Event-host associations shown in the graphics identify relationships contained in the research data and should not, standing alone, be interpreted as proof of personal receipt of revenue, misconduct, ownership, liability, or wrongdoing. Readers should distinguish documented source facts from modeled estimates and research interpretation.
For the full methodological framework, assumptions, validation procedures, and limitations, consult the Hidden Valley research methodology and the statewide research portal.