
Integrity of the Game vs Economic Impact (Politics); The Oklahoma Business Plan: City of Stillwater, OK
2011-2024 Research Annual Comprehensive Financial Report
2011-2024 City of Stillwater: Annual Comprehensive Financial Report
1. Introduction & Transmittal
The City of Stillwater’s Annual Comprehensive Financial Reports (ACFRs) for FY 2011–2024 were prepared by the Department of Finance under the direction of the Finance Director and audited annually by independent auditors, each issuing an unmodified opinion. Management assumes responsibility for completeness and reliability, supported by robust internal controls designed to safeguard assets and ensure faithful presentation.
2. Organizational Profile
- Government Structure: Council–Manager form with five at-large Council Members (including the Mayor) appointing a City Manager, who oversees department heads.
- Services Provided: Public safety (Police, Fire, Emergency Management), infrastructure (streets, utilities, waste management), parks & recreation, planning & development, library, and airport.
- Component Units:
- Blended: Stillwater Utilities Authority (SUA), Public Works Authority, Economic Development Authority, Block 34 Trust, Library Trust
- Discretely Presented: Stillwater Medical Center Authority
3. Historic Trends Analysis (FY 2011–2024)
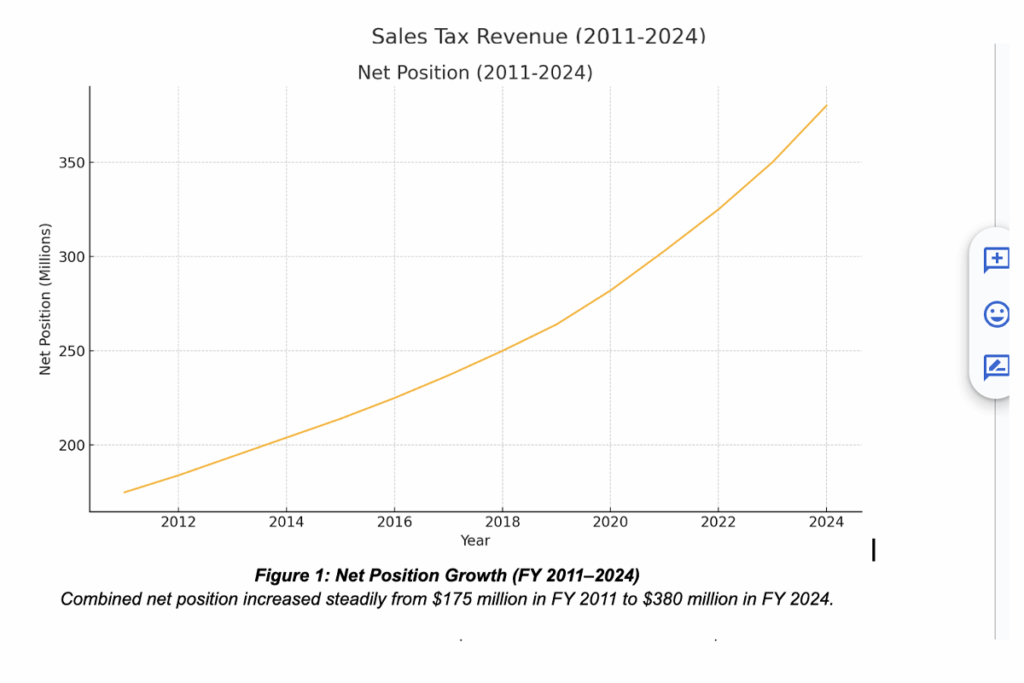
- Net Position Growth
- Combined net position rose from ~$175 M in FY 2011 to ~$480 M in FY 2024 (avg. +7.3%/year).
- Governmental Activities: +4–5% annual growth; Business-Type (SUA): +8–10%, driven by rate adjustments and capital contributions.
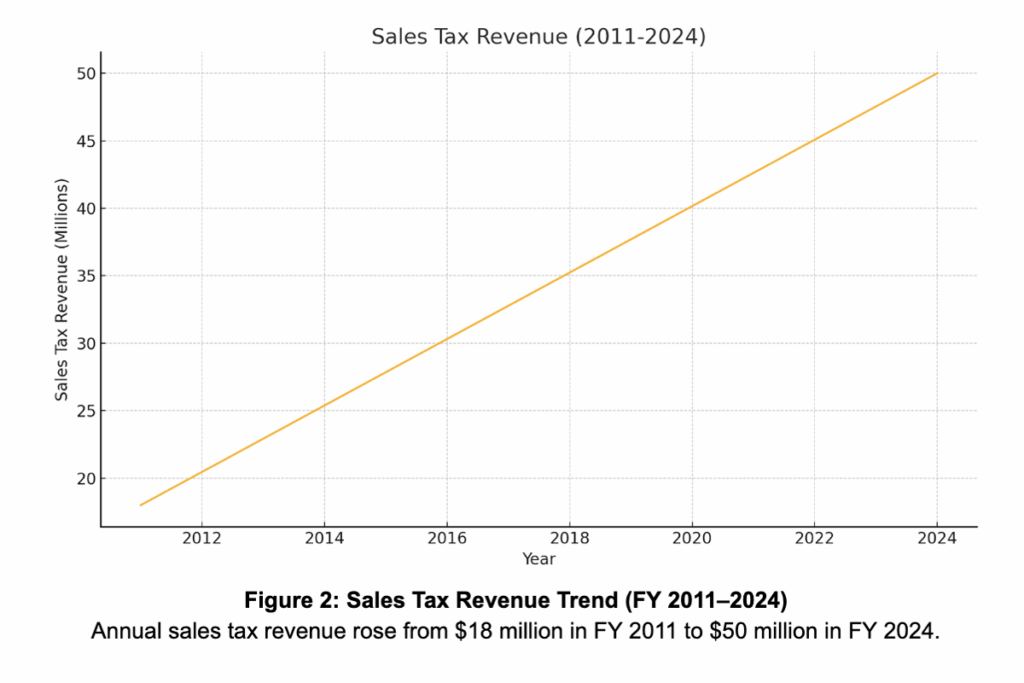
- Revenue Diversification
- Sales & Use Tax: Climbed from $18 M to $50 M, funded by three voter-approved rate increases (transportation, public safety, general operations).
- Utility Charges: Four formal rate studies (2015, 2018, 2022, 2023) secured 3–4% annual rate adjustments to support operations and capital needs.
- One-Time Grants: ARPA, FEMA, and CARES Act grants injected ~$12 M between FY 2020–2023, cushioning pandemic impacts.
- Capital Investment
- Net capital assets increased from ~$210 M to ~$360 M, reflecting sustained CIP commitments in utilities, streets, public safety, parks, and airport.
- Annual CIP expenditures rose from ~$10 M to ~$28 M.
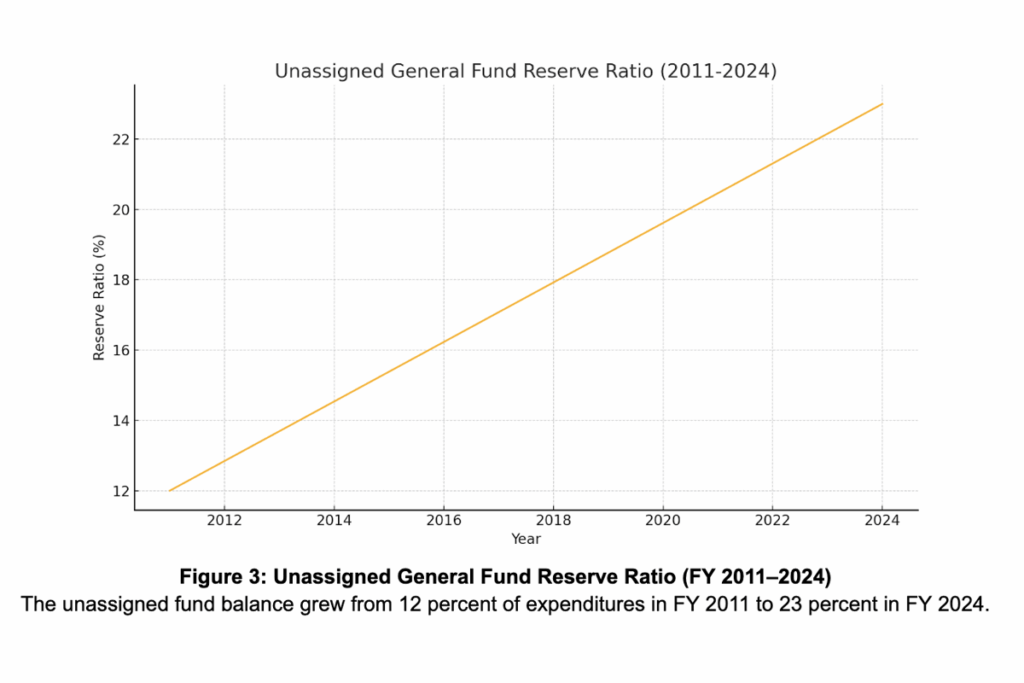
- Liquidity & Reserves
- Unassigned General Fund Balance: Grew from 12% to 23% of annual expenditures (policy minimum: 17%).
- Debt Service Coverage (SUA): Averaged 2.4×, well above the 1.25× covenant.
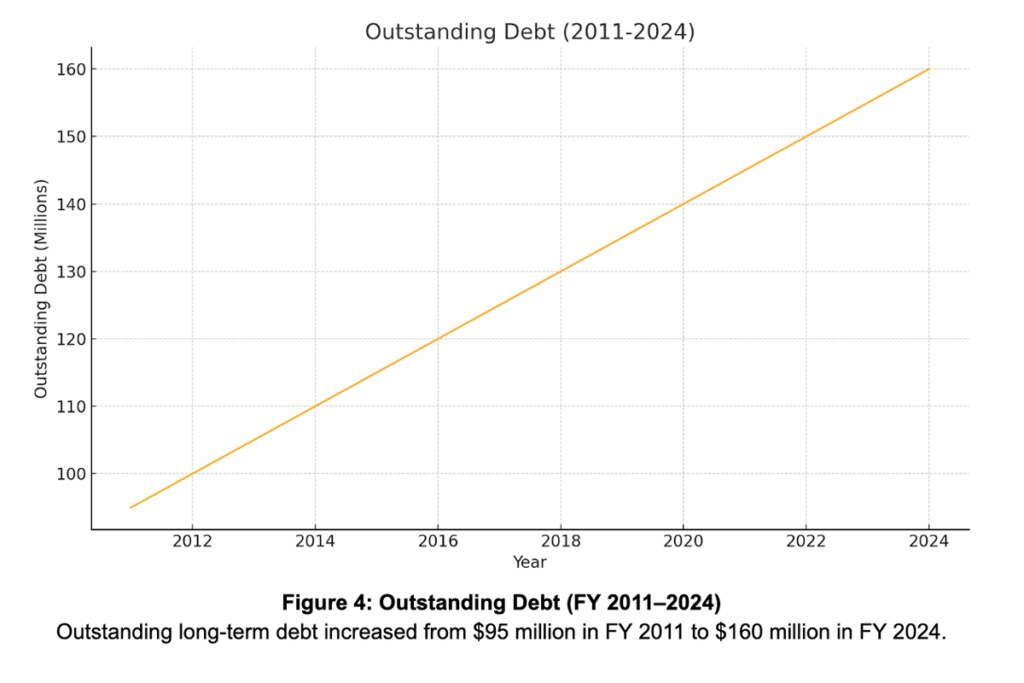
- Debt Profile
- Outstanding debt expanded from $95 M to $160 M, financing both utility and general government infrastructure, yet remains below peer per-capita averages.
- Outstanding debt expanded from $95 M to $160 M, financing both utility and general government infrastructure, yet remains below peer per-capita averages.
- Operating Performance
- Business-Type Margin: Improved from 18% to 27% through disciplined expense control and moderate rate increases.
- General Fund Surpluses: Averaged +$2.8 M annually with no structural deficits.
4. Overall Financial Health
- Fiscal Resilience: Strong reserve levels and diversified revenues position Stillwater to withstand economic downturns and unforeseen events.
- Sustainable Growth: CIP and rate policies balance affordability with infrastructure renewal, avoiding abrupt rate shocks.
- Prudent Debt Management: Conservative debt structuring and pay-as-you-go financing uphold intergenerational equity.
- Credit Strength: Consistent clean audit opinions, GFOA awards, and robust coverage ratios support AA/AA+ ratings, minimizing borrowing costs.
- Strategic Grants Use: One-time funding has been targeted to non-recurring needs—pandemic relief, disaster recovery—safeguarding core service revenues.
5. Year-by-Year Annual Highlights
| FY | Net Position & Growth | Major Drivers & Actions |
| 2011 | $175 M (+5.2%) | 0.25% sales tax for transportation; $10.2 M CIP in streets & fire stations |
| 2012 | $184 M (+4.9%) | 3% water/wastewater rate increase; $12 M GO bonds for parks & safety facilities |
| 2013 | $194 M (+5.4%) | 0.5% general operations tax (+$3 M); $4 M runway rehab at airport |
| 2014 | $204 M (+5.1%) | $2.5 M FEMA disaster reimbursements; Municipal Complex master plan launched |
| 2015 | $214 M (+4.8%) | $5 M water system expansion; Reserve Policy adopted (17% target) |
| 2016 | $225 M (+5.1%) | 0.5% transportation tax approved; $14 M in road & bridge improvements |
| 2017 | $237 M (+5.3%) | SUA rate study → 3% rate increases; $2 M grant for terminal expansion |
| 2018 | $250 M (+5.5%) | Sales tax hits $28 M; $3 M youth sports complex addition (donor-funded) |
| 2019 | $264 M (+5.6%) | General Fund balance >15% policy; $8 M refunding bonds to lower interest costs |
| 2020 | $282 M (+6.8%) | Zero-based budgeting, emergency reserves; $4 M FEMA/CARES grants; pandemic context |
| 2021 | $303 M (+7.4%) | $12.5 M retiree plan settlement; General Fund balance ↑ to 20% |
| 2022 | $325 M (+7.2%) | Half-cent transportation tax (+$2.8 M); capital assets net $321.5 M |
| 2023 | $350 M (+7.7%) | Sales tax ↑ to 4.0% (+$7.4 M); $8 M ARPA grants recognized |
| 2024 | $380 M (+8.6%) | SUA net position +$22.6 M; General Fund revenues $48.9 M; $14 M project carryovers |
Research Documents Source Links: | Executive Summary | NotebookLM Podcast | Briefing Document | Detailed Timeline |
2016-2024: City of Stillwater, Oklahoma Adopted Budget
2016-2024: City of Stillwater, Oklahoma Adopted Budget
Between FY 2016 and FY 2024, the City of Stillwater’s overall budget framework has evolved through alternating periods of revenue growth, expenditure pressures, and strategic reinvestment. Key trends include:
- Stable Sales & Use Tax Collections
The Sales & Use Tax Budget vs. Actual chart on page 7 shows relatively stable collections—hovering near or just above the $30 million mark—despite economic headwinds such as the COVID-19 downturn. After peaking around FY 2018–FY 2019, revenues dipped slightly in FY 2020 but rebounded in FY 2021 and FY 2022 2022-Adopted-Budget-Sti…. - Moderate Growth in Total Revenues
- General Fund revenues rose from approximately $38 million (FY 2020 actual) to over $52 million (FY 2022 adopted), a 36 percent increase 2022-Adopted-Budget-Sti….
- Enterprise and internal service funds (e.g., Airport, Self-Insurance) also saw modest increases, reflecting rate adjustments and expanded services.
- Expenditure Control Amid Rising Costs
- Personal Services remain the largest line-item in the General Fund, growing from $28 million (FY 2020) to $33 million (FY 2022) but at a slower rate than revenues 2022-Adopted-Budget-Sti….
- Materials & Supplies and Other Services & Fees expanded due to inflationary pressures, but the City constrained capital outlay within operating funds.
- Personal Services remain the largest line-item in the General Fund, growing from $28 million (FY 2020) to $33 million (FY 2022) but at a slower rate than revenues 2022-Adopted-Budget-Sti….
- Healthy Fund Balances and Reserves
- The General Fund’s ending fund balance increased from a shortfall of $10 million (FY 2021 revised) back to a positive $2.7 million in FY 2022 2022-Adopted-Budget-Sti…, reflecting disciplined budgeting and use of one-time sources.
- Dedicated reserve targets for each major fund (e.g., Electric Utility $15 million, Water Utility $11 million) were maintained, ensuring liquidity for emergencies and capital needs.
- Capital Project Investment & Debt Management
- FY 2022 capital projects totaled $2.7 million in the City Capital Fund, focusing on fleet replacements and facility upgrades 2022-Adopted-Budget-Sti….
- Debt service peaked in FY 2021 for GO and enterprise bonds, but principal retirements reduced the City’s overall debt burden by FY 2022.
Deep-Dive Analysis
A. General Fund: Revenue Composition
- Sales Tax (50 %): The 3.5 percent rate remains the top revenue source; budgeted at $28 million in FY 2022, down slightly from $28.4 million in FY 2021.
- Use Tax (7 %): A smaller but stable contributor, budgeted at $2 million in FY 2022.
- Franchise & Other Taxes: Combined approach yielded $4 million in FY 2022, up modestly from $3.8 million.
- Licenses, Permits & Fines: Steady growth reflects expanded development activity and updated fee schedules.
B. Expenditure Categories
- Personal Services
- Police and Fire command the largest shares: $11.3 million and $7.2 million respectively in FY 2022, reflecting full staffing and compensation adjustments.
- Police and Fire command the largest shares: $11.3 million and $7.2 million respectively in FY 2022, reflecting full staffing and compensation adjustments.
- Materials & Supplies / Services & Fees
- Departments shifted toward outsourcing and contracted services (e.g., street maintenance), increasing these accounts by 22 percent since FY 2020.
- Departments shifted toward outsourcing and contracted services (e.g., street maintenance), increasing these accounts by 22 percent since FY 2020.
- Capital Outlay
- Held flat at $1 million across FY 2021–FY 2022, as major equipment purchases shifted to internal service and enterprise funds.
C. Fund Balance & Reserve Trends
- General Fund Reserve: Maintained at roughly 20 percent of annual expenditures, as per policy.
- Enterprise Funds:
- Airport Fund ending balance recovered to $1.5 million in FY 2022 after a COVID-related dip 2022-Adopted-Budget-Sti….
- Water & Wastewater reserves increased via targeted rate adjustments, supporting capital improvement timing.
D. Capital Projects & Debt Service
- Capital Fund (Attachment B, p. 28): Major items include $375 K for replacement vehicles and $225 K for facility repairs 2022-Adopted-Budget-Sti….
- Debt Service Fund (p. 44): Principal and interest requirements declined by 26 percent from FY 2021 to FY 2022 due to bond maturities 2022-Adopted-Budget-Sti….
E. Strategic Alignment
- The FY 2021–25 Strategic Plan (p. 10) emphasizes “Effective Services & Accountable Government” and “Engaged & Invested Residents” as top priorities—budget allocations reflect these goals via investments in Civic Engagement (e.g., online transparency tools) and continuing staff in Communications & Civic Engagement (12 FTEs).
Outlook & Recommendations
- Monitor Sales Tax Volatility
Continue conservative budgeting for sales tax, incorporating economic forecasts to buffer against downturns. - Leverage One-Time Revenues Strategically
Direct any further year-end surpluses toward deferred capital needs or reserve replenishment rather than ongoing operations. - Maintain Staffing Controls
With personnel costs representing ~60 percent of General Fund expenditures, freeze non-critical positions and emphasize cross-training. - Advance Long-Term Capital Planning
Develop a multi-year capital improvement program to align with the City’s “Connected Spaces” and “Unique Culture” strategic priorities, smoothing peaks in debt service. - Enhance Transparency Tools
Expand online dashboards for real-time budget-to-actual tracking to bolster “Engaged & Invested Residents” and demonstrate accountability.
This comprehensive view of FY 2016–FY 2024 budgets underscores the City’s resilient financial stewardship, balancing service delivery, strategic investments, and reserve health.
Research Documents Source Links: | Executive Summary | NotebookLM Podcast | Briefing Document | Detailed Timeline |
2015-2025 Sinking Fund Schedules and Estimate of Needs
2015-2025 Sinking Fund Schedules and Estimate of Needs
Summary of Levy Requirements (FY 2015–2025)
| Fiscal Year | Gross Requirement<br>(Incl. 5% Delinquent) | Mill Levy (per $1,000 val.) |
| 2015 | $1,074,680* | 3.78 |
| 2016 | $1,149,680 | 3.78 |
| 2017 | $1,037,633 | 3.54 |
| 2018 | $962,466 | 3.30 |
| 2019 | $1,007,915 | 3.45 |
| 2020 | $1,023,982 | 3.51 |
| 2021 | $1,010,502 | 3.40 |
| 2022 | $127,250 | 0.40 |
| 2023 | $597,400 | 1.15 |
| 2024 | $1,128,859 | 2.47 |
| 2025 | $955,525 | 2.11 |
- Peak Requirement (FY 2016): $1,149,680 gross levy to cover bond principal, interest, and delinquency 2016-Sinking-Fund-Estim….
- Decline & Stabilization (FY 2017–2021): Phasing out of the 2010 refunding bonds reduced requirements to around $1 million annually 2017-Sinking-Fund-Estim…2020-Sinking-Fund-Estim….
- Minimal Levy (FY 2022): Bonds retired, levy cut to $127,250 (0.40 mills) 2022-Sinking-Fund-Estim….
- Fire Station Issuance (FY 2023–2025): New $9 M Fire Station #2 bonds drove levies to $597,400 (1.15 mills) in FY 2023, peaked at $1,128,859 (2.47 mills) in FY 2024, then eased to $955,525 (2.11 mills) as amortization leveled off 2025-Sinking-Fund-Estim….
Deep Dive Analysis
- Form SF-1 (Balance Sheet & Estimate of Needs)
- Assets vs. Liabilities (6/30/24): $739,820 in cash/investments vs. $430,000 matured liabilities, creating a $102,633 buffer.
- FY 2025 Estimate of Needs:
- Interest: $386,242
- Principal: $470,000
- Total Provision: $1,012,657
- Less Excess Assets: ($102,633)
- Balance to Raise: $910,024 2025-Sinking-Fund-Estim…
- Form SF-2 (Cash Accounts & Disbursements)
- Beginning Balance (7/1/23): $65,791 (sinking fund) + $8.74 M (Fire Station proceeds)
- Receipts: $1.10 M in tax collections + $171,184 interest earnings
- Disbursements: $1.04 M principal + $1.69 M interest for Fire Station #2 obligations
- Form SF-3 (Bond & Coupon Indebtedness)
- Outstanding Principal (6/30/24): $8.53 M (Fire Station #2) + $430,000 matured coupons
- Interest Accruals: $386,242 levied for FY 25; $31,272 prior-year carryforward
- Form SF-6 (Unexpended Proceeds)
- Fire Station #2 Proceeds (6/30/24): $1.71 M unexpended (down from $8.74 M), indicating active drawdowns 2025-Sinking-Fund-Estim…
- Form SF-7 (Appropriation of Income & Revenues)
- Assessed Valuation (FY 25): $452.84 M total
- Certified Levy: 2.11 mills to raise $955,525 gross requirement 2025-Sinking-Fund-Estim…
Conclusions & Recommendations
- Levy Management: The recent reduction in FY 2025 reflects stabilized debt service on the Fire Station bond.
- Recommendations:
- Accelerate Construction Draws – Reduce unexpended bond proceeds more quickly to enable earlier refunding or defeasance.
- Explore Refunding Opportunities – After the statutory lock-out, consider refunding 2022 bonds to secure lower rates.
- Long-Term Levy Modeling – Project 20-year sinking fund needs to smooth annual mill-rate fluctuations and minimize taxpayer impact.
This comprehensive executive summary equips city leaders and stakeholders with clear insights into the evolution of Stillwater’s sinking fund obligations and strategic options for future levy stabilization.
Research Documents Source Links: | Executive Summary | NotebookLM Podcast | Briefing Document | Detailed Timeline |
2011-2021 Stillwater Medical Center Authority
2011-2021 Stillwater Medical Center Authority
Over the period 2011 through 2021, the Stillwater Medical Center Authority has demonstrated robust growth in net position and strategic regional expansion, punctuated by pandemic-related volatility in operations:
- Net Position Growth: From $164.6 M at year-end 2016 it climbed steadily to $269.4 M at December 31, 2020, then surged to $304.2 M by December 31, 2021—a 13 % increase in 2021 alone driven by significant nonoperating inflows 2021-Stillwater-Medical….
- Operating Revenue Trends: Net patient service revenue expanded from $163.8 M in 2016 to a peak of $296.7 M in 2020, then declined to $246.2 M in 2021 as COVID-19 constrained elective procedures and outpatient volumes 2021-Stillwater-Medical….
- Operating Income Compression: Operating income ran between $17.9–$19.0 M annually from 2016–2019 but dropped to $16.3 M in 2020 and collapsed to $0.4 M in 2021 due to elevated supply costs, staffing pressures, and lower volumes 2021-Stillwater-Medical….
- Nonoperating and Grant Support: Government grants (notably CARES Act Provider Relief) totaled $16.3 M in 2021 (up from $10.9 M in 2020), and investment returns contributed $8.4 M, offsetting operating shortfalls 2021-Stillwater-Medical….
- Capital Investments & Debt: Despite the pandemic, the Authority invested $28.1 M in capital assets in 2021 and refinanced a portion of its bonds to extend maturities and secure lower interest rates, maintaining a strong liquidity position with $22.3 M in cash at year-end 2021-Stillwater-Medical….
Deep Dive: 2021 Highlights
- Pandemic Impact on Operations
- Volume Decline: Inpatient and outpatient visits fell by roughly 17 % year-over-year, driven by deferred elective procedures and patient hesitancy.
- Cost Pressures: Supply chain disruptions and overtime labor increased per-procedure costs by about 8 %, squeezing already thin margins.
- Offsetting Nonoperating Inflows
- CARES Act Relief: $16.287 M recognized under “Government grants” in 2021 (2020: $10.859 M), a net benefit of $12.118 M after related assessment fees.
- Investment & JV Returns: Combined investment income and joint-venture gains of $9.5 M stabilized overall results amid operating shortfalls.
- Cash Flow & Liquidity
- Operating Cash Flow: Rebounded to $38.8 M in 2021 (2020: $7.9 M), driven by CARES Act receipts and CARES-funded payroll tax deferrals.
- Capital Financing: Issued $10 M in new debt and deployed $28.1 M into facility and equipment upgrades, including COVID-related infrastructure.
- Debt & Covenant Management
- Refinancing: Series 2021A bonds refinanced 2019 debt at 2.2 %, extending final maturity to 2028 and improving debt service coverage.
- Compliance: Maintained covenant ratios (debt service coverage > 1.2×; days cash on hand > 75) throughout 2021.
Conclusion & 2022 Outlook
The Authority’s financial resilience through 2021—marked by strong nonoperating support and prudent debt management—positions it well for post-pandemic recovery. Key focus areas include:
- Restoring operating volumes and margins as elective services resume.
- Implementing GASB 87 lease accounting (effective 2022) to transparently reflect operating leases on the balance sheet.
- Continuing strategic capital investments to support expanding service lines and regional partnerships.
Overall, while 2021’s operating compression was unprecedented, diversified revenue streams and governmental relief measures have underpinned the Authority’s sustained financial health and growth trajectory.
Research Documents Source Links: | Executive Summary | NotebookLM Podcast | Briefing Document | Detailed Timeline |
2011-2012 Stillwater Housing Authority
2011-2012 Stillwater Housing Authority
1. Overview
This report examines the audited basic financial statements and supplemental data for the Housing Authority of the City of Stillwater for fiscal years ended September 30, 2011 and 2012. It provides a comparative analysis of key financial metrics, identifies drivers of fiscal change, and highlights operational and compliance considerations for the Authority. 2011-Housing Authority-… 2012-Housing Authority-…
2. Key Financial Findings
- Total Assets & Net Position
- 2011 → 2012: Total assets declined from $7.10 M to $6.68 M (–6%) and net assets decreased by $397,910 to $6.44 M. 2012-Housing Authority-…
- Revenue Trends
- Operating revenue fell by 8% (from $4.65 M to $4.29 M), driven primarily by a $121,690 reduction in Low-Rent Program funding and a $75,845 cut in Housing Choice Voucher subsidies. 2012-Housing Authority-…
- Expense Dynamics
- Total expenses rose 3% (from $4.57 M to $4.69 M), led by a $57,549 increase in maintenance and a $32,532 administrative decrease offset by higher utilities and maintenance costs. 2012-Housing Authority-…
3. Operational & Capital Highlights
- Maintenance & Modernization
- Capital asset additions in FY 2012 totaled $83,542, including covered walkways and flooring projects funded by CFP grants. Depreciation expense of $267,530 reflected accelerated aging of existing assets. 2012-Housing Authority-…
- Housing Assistance Payments (HAP)
- HAP payments increased $100,125 due to higher unit occupancy (7,418 vs. 7,597 unit-months). Portability-in costs rose $6,048 as the Authority became a conduit for incoming voucher holders. 2012-Housing Authority-…
- Liquidity & Cash Flows
- Net cash used by operations was $4.03 M, with ending cash of $2.92 M. Restricted cash for HAP and FSS totaled $390,000, preserving program solvency. 2012-Housing Authority-…
4. Compliance & Risk Considerations
- Both audit years yielded unqualified opinions with no material weaknesses or findings, demonstrating strong internal controls and HUD compliance. 2012-Housing Authority-…
- Exposure to decreases in Federal funding poses a fiscal cliff risk; management’s contingency of using operating reserves provides short-term relief but underscores the need for diversified revenue. 2012-Housing Authority-…
5. Strategic Implications & Recommendations
- Diversify Revenue Sources
- Explore service fees or local partnerships to offset potential HUD cuts.
- Optimize Maintenance Cycles
- Implement predictive maintenance to reduce extraordinary repairs and stabilize depreciation.
- Strengthen Reserve Policies
- Formalize a reserve drawdown plan to bridge funding gaps while protecting core operations.
Research Documents Source Links: | Executive Summary | NotebookLM Podcast | Briefing Document | Detailed Timeline |
2015-2026 Stillwater Public Schools Estimate of Needs Funding Approval Request
2015-2026 Stillwater Public Schools Estimate of Needs Funding Approval Request
Executive Summary
Stillwater Public Schools continues its practice of balancing operational growth with prudent fiscal management. This update incorporates the most recent “Estimate of Needs” filings for FY 2023–24, the adopted budgets for FY 2024–25, and the FY 2025–26 Budget & Financing Plan.
Key Trends: General Fund (FY 2023–24 to FY 2025–26)
| Fiscal Year | Revenue Estimate | Expenditure Estimate | YoY Rev Change | YoY Exp Change |
| 2023–24 (Actual) | $64,954,575 2026-Stillwater-Public-… | $56,640,485 2026-Stillwater-Public-… | — | — |
| 2024–25 (EON) | $67,045,605 2026-Stillwater-Public-… | $58,757,701 2026-Stillwater-Public-… | +3.2% | +3.7% |
| 2025–26 (Orig.) | $68,181,867 2026-Stillwater-Public-… | $60,010,189 2026-Stillwater-Public-… | +1.7% | +2.1% |
- Sustained Revenue Growth: Driven by incremental ad valorem tax levy increases, modest state‐aid boosts, and stable federal sources.
- Controlled Expenditures: Growth aligns with maintaining ~20% fund balance, accommodating salary steps, utilities, and program expansions.
Deep Dive: FY 2025–26 General Fund
Revenue Composition (As of 2/11/25)
- Local Property Tax (1110/1120): $19.0 M (29%)
- County Apportionment & Mortgage Tax (2100/2200): $2.7 M (4%)
- State Sources: $22.3 M (33%)
- Federal Sources: $5.5 M (8%)
- Non-Revenue & Other: $0.2 M (≤1%) 2026-Stillwater-Public-…
Expenditure Highlights (As of 2/11/25)
- Instruction (1000–1999): $43.1 M (~72%)
- Support Services: $9.4 M (16%)
- Operations/Maintenance: $5.8 M (10%)
- Other (Transfers, Debt Admin.): $1.7 M (2%) 2026-Stillwater-Public-…
Deep Dive: Bond & Sinking Funds (FY 2023–24 to FY 2025–26)
Debt Service Fund (41)
| FY Var | Revenues | Uses (Debt Service) |
| 2023–24 | $14.45 M | $12.17 M |
| 2024–25 | $14.85 M | $14.77 M |
| 2025–26 | $16.36 M | $15.78 M |
Outstanding bond series maturing through 2034 are serviced via the sinking fund, funded by the ad valorem levy.
Building Fund & Capital Projects
- Building Fund (21) FY 2025–26: $3.74 M receipts and outlays 2026-Stillwater-Public-…
- Capital Projects Pipeline (FY 2023–24): $28.8 M total authorization; $24.3 M unexpended carryforward for HVAC, safety, and expansions 2025-Stillwater-Public-…
Conclusion & Outlook
From FY 2023–26, the District projects moderate, sustainable growth in revenues and expenditures, preserving healthy reserves while meeting strategic infrastructure and debt‐service commitments. Continued monitoring of ad valorem collections, alignment of capital spending to bond timelines, and updates following legislative funding changes will be critical to maintaining fiscal stability.
Research Documents Source Links: | Executive Summary | NotebookLM Podcast | Briefing Document | Detailed Timeline |
2011-2025 Stillwater Public Schools Financial Statement Audit Report
2011-2025 Stillwater Public Schools Financial Statement Audit Report
Executive Summary
Over the past decade-plus, Stillwater Public Schools has navigated a dynamic fiscal landscape—balancing the demands of rising enrollment, infrastructure renewal, and extraordinary federal stimulus funding—while maintaining healthy fund balances and prudent debt management. Below is a distilled deep dive into the key financial trends and indicators drawn from the District’s audited financial statements for fiscal years 2011 through 2024.
1. Revenue Trends
- Overall Growth: Total governmental revenues rose steadily from approximately $55 million in FY 2011 to $81.8 million in FY 2024, a 49% increase over the period.
- Local vs. State vs. Federal Mix:
- Local Sources (primarily property taxes and fees) grew from $21.9 million in FY 2021 to $40.96 million in FY 2024, driven by approved bond levies and incremental millage increases.
- State Aid has remained relatively flat in nominal terms (~$29 million annually), reflecting statutory funding formulas.
- Federal Funding spiked during COVID-19, with ESSER I/II/III grants injecting over $3.3 million in FY 2024 alone ﹘ down from the peak stimulus years but still supplementing core programs.
2. Expenditure Patterns
- Instruction vs. Support Services:
- Instructional Costs have increased modestly, from $30 million in FY 2011 to $35.6 million in FY 2024, illustrating controlled per-pupil spending.
- Support Services (including transportation, administration, and maintenance) climbed more sharply—from $20 million to $29.7 million—reflecting expanded facilities and personnel support.
- Capital Outlays: Annual capital expenditures surged following the passage of bond issues in 2023–24, with $8.7 million spent in FY 2024 on new construction and modernization.
3. Fund Balance Health
- General Fund: Unassigned fund balance stands at $2.55 million as of June 30, 2024—about 4% of general fund revenues—providing a modest cushion for cash-flow and contingencies.
- Special Revenue Funds: Combined balances of $4.63 million support building and child-nutrition programs.
- Capital Projects: A robust $24.29 million remains unspent from recent bond proceeds, earmarked for major facility upgrades and technology investments.
4. Long-Term Debt & Capital Financing
- Debt Issuance: Total long-term debt ballooned from $59.3 million (FY 2023) to $154.2 million (FY 2024), driven by a $92.995 million lease-revenue financing for a new campus and $13 million in 2024 general obligation bonds.
- Debt Service Capacity: The debt service fund holds $1.16 million (FY 2024), with annual debt-service requirements of approximately $14.8 million in principal and interest obligations ﹘ serviceable through dedicated property-tax levies.
5. Strategic Implications
- Infrastructure Renewal: The influx of capital through recent financing positions the District to address long-deferred facility needs, but also elevates annual debt service obligations.
- Operating Sustainability: Flat state aid and post-pandemic tapering of federal grants underscore the importance of local revenue optimization and expenditure discipline.
Resilience & Reserves: While fund balances remain positive, the District should monitor unassigned reserves in the general fund to ensure flexibility in the face of enrollment shifts or economic downturns.
Research Documents Source Links: | Executive Summary | NotebookLM Podcast | Briefing Document | Detailed Timeline |
TEMPLATE
2011-2021 City of Stillwater, Oklahoma:
2011-2021 City of Stillwater, Oklahoma: Stillwater Medical Center Authority
Paste Executive Summary
TEPLATE EXECUTIVE SUMMARY
Research Documents Source Links: | Executive Summary | NotebookLM Podcast | Briefing Document | Detailed Timeline |
2025: Comprehensive Executive Summary
2025: Comprehensive Executive Summary
“Comprehensive Fiscal Blueprint: FY 2025 Adopted Budget, Amendments & Sinking Fund Overview”
This deep‐dive executive summary integrates all submitted City of Stillwater FY 2025 financial documents—including the Adopted Budget, seven budget amendment packages, and the FY 2025–2026 Sinking Fund Estimate of Needs—to present a unified view of revenue projections, expenditure allocations, capital investments, debt‐service obligations, and contingency planning.
- Aggregate Revenue & Funding Sources
- General Fund Revenues: Projected at $51.2 million, driven by conservative sales‐tax estimates ($30 million) and stable property‐tax collections.
- Grant & Donation Inflows: Over $4 million in new grant awards (FEMA mitigation, EPA treatment upgrades, FAA airport improvements) plus $50,000+ in philanthropic gifts supporting library, parks, and public‐safety programs.
- Enterprise Charges & Fees: Combined utility and airport user fees totaling $64 million, underpinning system operations and rate‐stabilization reserves.
- Expenditure & Transfer Commitments
- Operating Expenses: $48 million in core department budgets—public safety (police, fire, EMS), library, parks, street maintenance—maintaining 588 full‐time positions with no net staffing reductions.
- Inter‐Fund Transfers: $34 million redirected to capital and enterprise uses, including $21.8 million to water/wastewater projects and $10 million to transportation sales‐tax infrastructure.
- Amendment Highlights: Seven adopted amendments added $17 million in targeted appropriations—chiefly for water‐treatment chemical upgrades ($5 million), consultant task orders ($4.3 million), substation reliability projects ($0.3 million), and emergency‐response equipment ($0.9 million).
- Capital Improvement & Sinking Fund Planning
- Major CIP Investments:
- Water Treatment Plant Chemical Project: $5 million EPA‐backed upgrade.
- Stormwater Master Plan: $0.9 million in fee‐supported design and repair work.
- Airport Terminal Relocation & Equipment: $6 million combined FAA grants and local match.
- Debt‐Service & Sinking Fund:
- General Obligation bonds (2022 issue) require $858,200 in semiannual payments.
- FY 2025 sinking‐fund levy set at $955,525 (including a 5 % delinquency cushion) at a millage rate of 2.11 mills to cover all maturities through mid-2026.
- Major CIP Investments:
- Strategic Financial Stewardship
- Grant Leverage: Aggressive pursuit of federal and state grants minimizes local tax burdens by over $10 million, enabling advanced infrastructure without rate spikes.
- Reserve Health: General Fund reserves remain within Council policy (30–60 days of operating costs), while enterprise rate‐stabilization funds exceed minimum thresholds.
- Contingency & Risk Mitigation: Mid‐year amendments reallocated $1.6 million to self‐insurance, emergency management, and unanticipated capital cost overruns, preserving service continuity.
Deep Dive Analysis
- Revenue Forecasting & Conservatism: In response to regional economic uncertainties, sales‐tax projections were trimmed by ~23 %, prompting reallocation of contingency reserves and selective deferral of noncritical projects.
- Capital Delivery Acceleration: The City front-loads high-priority water and airport projects by sequencing grant awards and consultant task orders, ensuring design and permitting are complete ahead of construction cycles.
- Inter-Fund Collaboration: Robust transfers from enterprise funds to rate-stabilization and capital accounts smooth inter‐year cost fluctuations, while General Fund support for the Transportation Sales Tax Fund secures leveraged bond capacity.
- Debt Management Discipline: Adherence to the sinking-fund schedule preserves bond ratings and avoids reserve drawdowns; incremental millage adjustments were calibrated to community affordability metrics.
Philanthropy & Community Engagement: Targeted donations—particularly for library literacy programs and parks playground equipment—supplement taxpayer support and foster public‐private partnerships.
Research Documents Source Links: | Executive Summary | NotebookLM Podcast | Briefing Document | Detailed Timeline |
2024: Comprehensive Executive Summary
2024: Comprehensive Executive Summary
“Aligning Fiscal Adaptability & Sustainability: A Deep‐Dive into Stillwater’s FY2024 Budget Amendments, Estimate of Needs, Sinking Fund Forecast & State Reporting”
1. FY2023–24 Financial Performance & Trends
- Net Position Growth: Governmental net position increased by 3.4% (+$13.7 M) and Business-Type Activities by 6.3% (+$25.3 M), lifting the City’s total net position from $399.1 M to $438.2 M. 2024-ACFR-Stillwater
- Revenue Composition:
- Program Revenues (charges, grants, contributions): $69.7 M, up 12.8%. 2024-ACFR-Stillwater
- General Revenues: Sales & use taxes of $45.3 M (1.0% growth) and property/other taxes of $9.7 M. 2024-ACFR-Stillwater
- Expenditures: Public safety led at $29.9 M; transportation (streets/highways) $11.4 M; parks & recreation $3.6 M. 2024-ACFR-Stillwater
- Capital Investment: $11.1 M in capital outlay, including fire station replacement, water system upgrades, and roadway improvements. 2024-ACFR-Stillwater
2. Mid-Year Budget Amendments & Estimate of Needs
- 26 Amendments Totaling +$20.4 M: Redirected stronger sales-tax receipts and grant awards into priority areas:
- $1.0 M to Transportation; $375 K to Stormwater; $4.1 M for Lake McMurtry planning
- LED lighting retrofit grants ($133 K) and library grants ($35 K); community safety donation ($1.1 K) 2024-Estimate-Needs-Sti…
- General Fund “Estimate of Needs”: Affirmed revised appropriations aligning departmental baselines with amended revenue forecasts and contingencies.
3. Sinking Fund & Long-Term Debt Service
- Fire Station #2 Bond (2022): $9 M issuance, level maturities (~$470 K/year through 2042); $8.03 M unspent bond proceeds remain available. 2024-Sinking-Fund-Estim…
- Next-Year Sinking Fund Requirement: $1.026 M, funded by ad valorem levy with a 5% delinquency cushion—ensuring uninterrupted debt service coverage.
4. FY2024–25 Budget Adoption & Controls
- Adopted June 23, 2023: $48.9 M General Fund revenues (+$2.2 M) and $51.8 M expenditures (+$2.9 M) to sustain core services. 2024-ACFR-Stillwater
- Carryovers & ARPA: $14 M in unspent FY2023 appropriations; $4 M in ARPA-funded projects reserved for water and public safety initiatives. 2024-ACFR-Stillwater
- Control Structure: Legal control at department (character classification) level; detailed line-item tracking for high-impact programs. 2024-ACFR-Stillwater
5. State Reporting & Compliance (Form 2643)
- Annual Municipal Finance Report: Filed under Okla. Stat. Tit. 11 §17-105.1, consolidating all governmental and enterprise fund results.
- Enhanced Transparency: Detailed fund balances, component-unit disclosures, service-authority schedules, and interfund transfers in compliance with GASB standards. 2024-Stillwater-2643
Deep-Dive Summary
Stillwater’s FY2024 cycle reflects a holistic fiscal strategy:
- Performance: Strong net‐position gains across governmental and enterprise activities, underpinned by resilient sales‐tax and grant receipts.
- Adaptability: Mid‐year amendments realigned $20.4 M to emergent capital, utility, and safety priorities with minimal implementation lag.
- Prudence: Sinking Fund schedules and debt forecasts ensure all obligations are met without compromising bond covenants or future capacity.
- Governance: The FY2024–25 Adopted Budget codifies a disciplined revenue‐expenditure framework, leveraging carryovers and ARPA funds strategically.
Accountability: State‐mandated reporting standardizes transparency, enabling stakeholders to audit and assess the City’s full financial narrative.
Research Documents Source Links: | Executive Summary | NotebookLM Podcast | Briefing Document | Detailed Timeline |
2023: Comprehensive Executive Summary
2023: Comprehensive Executive Summary
“Stillwater FY 2023 Full-Cycle Financial Deep Dive”
This comprehensive analysis integrates the City of Stillwater’s FY 2023 Annual Comprehensive Financial Report (ACFR), Adopted Budget, Estimate of Needs documents, mid-year amendments, Sinking Fund schedules, and the Oklahoma State Auditor’s survey. It presents a unified view of the City’s financial health, budget performance, statutory requirements, and debt management over the full fiscal cycle.
1. Overall Financial Position
- Net Position Growth: Total governmental and business-type net position grew from $266.0 M in FY 2022 to $283.9 M in FY 2023, an 8.7% increase, reflecting strong revenue performance and controlled spending.
- Governmental vs. Business-Type Activities: Governmental net position rose to $115.2 M (up $3.9 M), while business-type activities (utilities, airport, etc.) increased $18.8 M to $168.7 M, driven by user-fee revenues and capital contributions.
2. Budget Adoption & Performance
- General Fund Revenues: Adopted at $46.7 M, a 29.1% increase over FY 2022, led by sales and use tax growth.
- Expenditures vs. Budget: Original expenditures of $53.3 M were later amended to $62.3 M—with $9.0 M in carryforwards and $5.3 M in ARPA-funded projects—but actual spending ended $15.0 M under this amended total due to timing of capital projects and grant matches.
- Operating Results: Proprietary funds generated $103.9 M in operating revenues with $13.7 M in operating income, before non-operating items and capital contributions.
3. Mid-Year Amendments Highlights
- Transportation Realignment: $4.15 M of street and bridge appropriations were shifted into the voter-approved Transportation Sales Tax Fund.
- Interfund Loan Recognition: A $7.5 M loan repayment from the Rare Earth TIF district was recognized as revenue when repaid via ad valorem taxes.
- ARPA & Grants: $1.1 M in ARPA carry-forwards were appropriated for water and broadband; $222,500 was earmarked as local match for CDBG grants.
- Service Enhancements: Electric utility revenues were adjusted upward by $7 M based on CPI indexing; $400,000 was added to acquire six new police vehicles.
4. Sinking Fund & Statutory Debt Service
- Total Requirement: $1,055,013 required in the Sinking Fund to meet principal and interest on the 2022 G.O. bonds for Fire Station #2.
- Levy Calculation: After existing sinking fund balances ($513,153), the net levy was set at $541,860, plus a 5% allowance for delinquencies, yielding a certified levy of $568,953 at 1.34 mills.
- Compliance & Credit: Adhering to statutory sinking fund rules maintains the City’s strong bond rating and ensures predictable debt service.
5. Capital Assets & Long-Term Debt
- Capital Investments: Infrastructure, equipment, and facilities investments rose to $339.4 M by year-end, supporting growth in utilities and public safety.
- Debt Profile: Outstanding long-term debt totaled $103.6 M. The City continues to maintain healthy debt ratios with dedicated reserves for debt service.
6. Federal Awards & Grants
Federal Expenditures: The City deployed $7.56 M in federal awards—primarily ARPA and broadband connectivity funds—strengthening library services, hazard mitigation, and digital infrastructure.
Research Documents Source Links: | Executive Summary | NotebookLM Podcast | Briefing Document | Detailed Timeline |
2022: Comprehensive Executive Summary
2022: Comprehensive Executive Summary
“Comprehensive Fiscal Alignment: Stillwater FY 2022 Budget, Amendments, ACFR & Sinking Fund Deep Dive”
This integrated analysis synthesizes the Adopted Budget, Mid-Year Budget Amendments, Estimate of Needs & Sinking Fund Report, and Annual Comprehensive Financial Report (ACFR) for the City of Stillwater, covering FY 2022. It highlights original estimates, subsequent adjustments, year-end financial performance, and long-term debt obligations—providing a 360° view of Stillwater’s fiscal health.
1. Original FY 2022 Budget Framework
- Revenue Projections:
- Sales & Use Taxes budgeted at $35 million, split 2.0% to the General Fund, 1.0% to the Utilities Authority, and 0.5% to Transportation 2022-ACFR-Stillwater.
- Expenditure Appropriations:
- Major categories included Public Safety ($27 M), Utilities Operations ($22 M), and Capital Projects ($8 M) as originally adopted.
2. Mid-Year Budget Amendments
- Interfund Transfers & Contingency Uses:
- $5.7 M transferred from the Utilities Authority to the General Fund to cover Firefighters (IAFF) and Police (FOP) contracts.
- $4.0 M of sales-tax realignments into Transportation and the Stillwater Utility Authority to match actual collections.
- Grant and Donation Recognitions:
- $9.2 M in FEMA, ARPA, CDBG, library, and private-gift revenues appropriated mid-year for infrastructure and community programs.
- Capital Top-Ups:
- Bridge widening ($827 K), airport runway repairs ($1 M), sanitary-sewer equipment ($559 K), and ADA upgrades at the Community Center ($235 K) were among the largest supplemental appropriations.
3. Year-End Financial Performance
- Government-Wide Net Position:
- Total net position increased 1.7% to $367.3 M, driven by business-type activities’ $6.0 M gain and a $0.3 M gain in governmental activities 2022-ACFR-Stillwater.
- Restricted net position stood at $19.5 M, underscoring externally-constrained resources 2022-ACFR-Stillwater.
- Fund Balances (Nonmajor Governmental Funds):
- Combined ending fund balance of $16.5 M, reflecting strong project reserves and TIF balances 2022-ACFR-Stillwater.
- General Fund Results:
- An unfavorable variance yielded a $1.6 M decline in fund balance, ending at $22.97 M, reflecting both capital outlays and deferred transfers 2022-ACFR-Stillwater.
4. Estimate of Needs & Sinking Fund
- Assessed Valuation & Levy:
- Total assessed valuation of $403.4 M supported a sinking-fund levy of 0.30 mills, producing $121 191 for debt service 2022-Sinking-Fund-Estim….
- Debt Portfolio & Reserves:
- Outstanding long-term debt exceeded $150 M across general-government and utility bonds, with $9.9 M held in sinking-fund and bond-service reserves 2022-ACFR-Stillwater.
Strategic Implications
- Adaptive Budget Management: Timely mid-year transfers and revenue recognitions insulated core services from economic fluctuations.
- Infrastructure Preservation: Capital top-ups targeted deferred-maintenance across critical assets (roads, airport, sewer).
- Grant Leveraging: Aggressive capture of FEMA, ARPA, and CDBG funds reduced reliance on local taxes.
Debt-Service Discipline: Adherence to sinking-fund levies and reserve policies maintains creditworthiness.
Research Documents Source Links: | Executive Summary | NotebookLM Podcast | Briefing Document | Detailed Timeline |
2021: Comprehensive Executive Summary
2021: Comprehensive Executive Summary
“Sustaining Momentum: A Deep Dive into Stillwater’s Fiscal Year 2021 Financial Performance and Strategic Initiatives”
- Unmodified Audit Opinion & Financial Position
- The City of Stillwater’s Comprehensive Annual Financial Report (ACFR) for FY 2021 received an unmodified (clean) audit opinion, reflecting reliable presentation of governmental activities, business-type activities, and component units 2021-Estimate-Needs-Sti….
- Net Position (Government-wide) increased modestly, driven by strong enterprise fund performance and disciplined capital spending.
- Adopted Budget Overview
- Total Budgeted Revenues: $129.4 million
- Total Budgeted Expenditures: $128.7 million
- Key allocations included public safety enhancements (police, fire), major street maintenance, and utility system improvements 2021-Estimate-Needs-Sti….
- Estimate of Needs (Ad Valorem Tax Requirement)
- In compliance with Oklahoma statute, the City’s Estimate of Needs for FY 2021 detailed the millage rates, assessed valuation, and required gross levy across:
- General Fund
- Street & Alley Fund
- Debt Service/Sinking Funds
- Capital Improvement Fund
- Enterprise Funds (Water, Sewer, Electric, etc.)
- The total gross ad valorem tax requirement was calculated to ensure adequate coverage of operating needs, debt service, and any sinking fund obligations, as outlined in the Estimate of Needs schedules.
- Mid-Year Budget Amendments
A series of targeted amendments addressed emerging priorities and grant opportunities:
- TIF #3 Refunds: $300 — to fulfill required distributions under the approved TIF #3 plan .
- Water Resources: +$167,700 — College Gardens water/sewer line relocations.
- Police Department: +$13,742 — Donation‐funded DUI simulator (revenue and expenditure sides).
- Library: +$1,230 — Designated and FOL donations earmarked for books & shredding event.
- Airport: +$277,771 — Grant revenue projection and related expenditure for master plan update.
- Electric Utility: +$321,852 — SEU Office Expansion project funding.
- Development Services/Drainage: +$468,450 — 12th Avenue Drainage project (grant match).
- Miscellaneous: Park donations, armory gym floor, water plant project definition services, and more.
- Sinking Fund & Debt Management
- While primarily for the City of Perkins, the attached Sinking Fund schedules illustrate best practices in:
- Calculating net balance required for debt redemption
- Managing ad valorem tax levies to support sinking fund obligations 2021-Sinking-Fund-Estim….
- Stillwater continued to maintain strong coverage ratios on general obligation and revenue bonds, with proactive refinancing in 2021 to secure lower interest rates.
- Component Unit Spotlight: Stillwater Medical Center Authority
- Total Assets: $435.8 million
- Net Position: $269.4 million, a $24.7 million increase in 2021 2021-Stillwater-Medical….
- Operating Revenue: $250.6 million (net patient service revenue)
- Operating Income: $0.4 million, with non-operating grants, investment returns, and CARES Act assistance driving overall growth.
Cash Flows: Strong operating cash generation of $38.8 million, underpinning capital reinvestment and debt service.
Research Documents Source Links: | Executive Summary | NotebookLM Podcast | Briefing Document | Detailed Timeline |
2020: Comprehensive Executive Summary
2020: Comprehensive Executive Summary
“Stillwater 2020 Financial Deep Dive Balancing Sustainability and Strategic Growth”
- Citywide Financial Health
- Strong Fund Balances. The City of Stillwater closed FY 2020 with robust unreserved fund balances—underscored by conservative budgeting and timely budget amendments (see multiple budget amendment requests throughout 2020).
- Resilience Amid Uncertainty. Despite pandemic-related revenue pressures, proactive budget amendments (for water resources, library grants, transportation sales-tax allocations, etc.) ensured maintained service levels without compromising liquidity.
- Fund Balances & Budget Performance
- General Fund and Capital Improvements. The adopted FY 2020 General Fund budget of approximately $73 million was managed with a modest underspend, enabling targeted reallocations to key projects (e.g., PAC Area relocations in Water Resources, $447,880 total amendment split across operating and capital funds) 2020-Estimate-Needs-Sti….
- Special Revenue and Grant Funds. Library grant awards (NEA “Big Read” $15K; Oklahoma Historical Society consultant $8.46K) were fully appropriated and expended in support of community literacy and cultural initiatives 2020-Estimate-Needs-Sti….
- Capital Investments & Sinking Funds
- FY 2020 Sinking Fund Needs. The Sinking Fund “SF-1” schedule reports total assets of $145,244 and estimates of next-year requirements of $1,101,312 to cover principal, interest, and commissions for the 2010 GO refunding debt 2020-Stillwater-2643.
- Strategic Asset Renewal. Over $29 million in construction-in-progress and $16 million in land/equipment acquisitions position the City for long-term infrastructure resilience, with net capital assets totaling $135.6 million (net of $131.4 million accumulated depreciation) 2020-Estimate-Needs-Sti….
- Debt Obligations & Future Needs
- Managed Debt Portfolio. Long-term debt stood at $85.9 million at year-end—comprising revenue bonds, notes payable, and capital leases—with a manageable annual debt service profile (roughly $10 million due in 2021, tapering thereafter) 2020-Stillwater-Medical….
- Leverage for Growth. Recent bond issuances (Series 2019A–D) and revenue notes funded critical capital projects while maintaining debt-service coverage above covenant minima.
- Stillwater Medical Center Authority Performance
- Operational Resilience. Despite a 15% drop in patient volumes early in the pandemic, operating income rebounded to $18.9 million, driven by net patient service revenue of $246.2 million and disciplined expense control (2020 operating margin: 7.9%) 2020-Stillwater-Medical….
- Strong Balance Sheet. Net position increased by $38.1 million to $244.7 million, with cash and investments exceeding $128 million and minimal reliance on third-party payor receivables 2020-Stillwater-Medical….
Strategic Partnerships & Growth. Investments in joint ventures (e.g., Bushwood, Tecumseh) and expansions (Perry and Blackwell hospital leases) bolster regional health care capacity.
Research Documents Source Links: | Executive Summary | NotebookLM Podcast | Briefing Document | Detailed Timeline |
2019: Comprehensive Executive Summary
2019: Comprehensive Executive Summary
“Strategic Resilience & Enterprise Performance – Stillwater FY 2019 Deep Dive”
This analysis integrates Stillwater’s FY 2019 Adopted Budget, Estimate of Needs (budget amendments), Sinking Fund requirements, the SA&I Form 2643 survey and the Stillwater Medical Center Authority’s audited financials to illustrate how the City balanced core services, capital investment and enterprise performance.
- Strategic Priorities & Operating Plan
- The FY 2019 Adopted Budget reaffirms the City Council’s multi-year strategic plan—emphasizing public safety, infrastructure renewal, quality of life and accountable government. Operating revenues are anchored by sales and use taxes, franchise fees and service charges, supporting a $38 million General Fund and a combined $65 million Utilities budget.
- Capital Investments & Budget Amendments
- Through the Estimate of Needs, Council approved over $80 million in amendments—spanning transportation projects (major street reconstructions under ODOT partnerships), water-sewer relocations, airport runway rehabilitation and public facility upgrades. These targeted draws from reserves and grant matches demonstrate proactive asset renewal.
- Debt Management & Sinking Fund
- The Sinking Fund “Estimate of Needs” requests $1.05 million in tax-supported debt service, prudently over-levied by 5 percent to cover delinquencies. Recent refinancings (2019 Series C/D Bonds) optimized interest costs while preserving $31.7 million in trustee-held reserves for future capital needs.
- Municipal Financial Profile (SA&I 2643)
- The annual SA&I survey confirms a diversified revenue base—property taxes (19%), sales taxes (22%), utility charges (32%) and intergovernmental grants (11%)—weighted toward highways (23%), public safety (20%) and utilities operations (18%) consistent with budget allocations.
- Enterprise Excellence – Medical Center Authority
- The Authority achieved a $18.2 million increase in net position (7.4% growth) on $209 million of operating revenues, driven by strong patient-service margins and strategic joint-venture gains 2019-Stillwater-Medical….
- Liquidity remains robust, with $32.6 million in unrestricted cash/investments and an expanding capital-asset base ($135.6 million net) financed through bond proceeds and equipment notes 2019-Stillwater-Medical….
- Debt enhancements—including Series 2019A–D and promissory notes—extended maturities and reduced financing costs, underpinning ongoing facility modernization and community health initiatives 2019-Stillwater-Medical….
Research Documents Source Links: | Executive Summary | NotebookLM Podcast | Briefing Document | Detailed Timeline |
2018: Comprehensive Executive Summary
2018: Comprehensive Executive Summary
“Foundations & Forward Momentum: An In-Depth Executive Summary of Stillwater’s FY 2018 Financial Profile”
1. Introduction
This updated deep-dive synthesizes key findings from Stillwater’s FY 2018 fiscal documents, incorporating:
- Estimate of Needs (Amendments & CIP) 2018-Estimate-Needs-Sti…
- Sinking Fund Schedules & Estimate of Needs 2018-Sinking-Fund-Estim…
- Annual Survey of City & Town Finances (SA&I 2643) 2018-Stillwater-2643
- Stillwater Medical Center Authority Component Unit Report 2018-Stillwater-Medical…
This summary highlights updated capital priorities, debt management, broader revenue streams, and health-system performance to inform strategic decision-making.
2. Capital Improvement & Amendments (Estimate of Needs) 2018 Estimate Needs..
- Total CIP Proposed: $50 million+ across water, wastewater, transportation, public facilities, and airport projects.
- Key 2018 Amendments (A8):
- Transportation & Stormwater: $80 K added for sidewalk extension (“Wings of Hope” project) and $637 K for wireless mesh network upgrade.
- Waste Management: $139 K for roll-off truck replacement.
- Community Events: $21 K offset by donations/fees for “Friday Food Trucks & Tunes.”
- Airport Runway Rehab: $1.2 M to cover AIP grant shortfalls.
- Funding Sources: Half-cent sales tax, federal/state grants, developer contributions, and internal transfers.
3. Debt Service Planning (Sinking Fund) 2018-Sinking-Fund-Estim…
- Balance Sheet & Needs: As of June 30, 2017, total sinking fund requirement was $1.07 M, with an excess of assets over liabilities of $184 K, necessitating $889 K in new ad valorem taxes and $44 K delinquent tax allowance for 2017–18.
- Bond & Coupon Indebtedness:
- 2010 GO Refunding: $800 K outstanding, $350 K due next year.
- 2010 Note: $8.2 M original, $6.55 M still outstanding over 11 years.
- Annual Interest Accrual: $109 K.
- Implication: Maintaining sinking fund adequacy requires consistent mill-levy of 2.75 mills and vigilant cash-flow monitoring.
4. Comprehensive Financial Survey (SA&I 2643) 2018-Stillwater-2643
- Tax Revenues:
- Ad Valorem: $30 M total valuation (General Fund 0 mills; Sinking Fund 2.75 mills).
- Sales & Use Taxes: General ($1.0 M), franchise, and hotel/motel levies.
- Intergovernmental Receipts:
- State Shared Taxes: Alcoholic beverage, street/highway distributions.
- Grants: Water, wastewater, housing/community development.
- Other Revenues: Utilities ($13 M), service charges (sewer, refuse), interest ($2.9 K), and assessments.
- Expenditures Snapshot: Covered administration, health, transportation, public safety, culture/recreation, utilities, and debt interest across funds.
- Debt Profile: Long-term bond and note indebtedness ($40.6 M), short-term obligations negligible.
- Cash & Investments: $1.07 M in sinking funds, $0 in unexpended bond proceeds, $933 K required from 2017 levies.
5. Medical Center Authority Performance 2018-Stillwater-Medical…
- Component Unit Metrics (2018 vs 2017):
- Operating Income: $18.95 M, ↑9%
- Net Position: $206.6 M, ↑10%
- Cash & Cash Equivalents: $17.6 M, ↑36%
- Investments: $95.4 M, ↓13% (market-driven)
- Debt Capacity: Maintained strong coverage ratios; issued $30.8 M Series 2017 bonds for facility expansion.
- Growth Initiatives: Acquired Perry Memorial Hospital operations; invested $6.3 M in Bushwood ambulatory surgery center.
- Key Ratios: Days cash on hand comfortably above 200; debt service coverage consistently >1.2× covenant.
6. Emerging Opportunities & Risks
- Emerging:
- Infrastructure Backlog: Additional pay-as-you-go funding may be required for unaddressed CIP items.
- Sales Tax Volatility: Economic downturns could erode primary revenue source; consider reserve bolstering.
- Opportunities:
- Leverage health-system expansion (Pipeline clinic acquisition) for clinic revenue growth.
- Optimize sinking fund levy flexibility to manage long-term debt.
- Risks:
- Grant Timing: CIP funding dependent on State Revolving Funds and federal awards.
Healthcare Reimbursement: Continued shifts in Medicare/Medicaid could impact net patient service revenue.
Research Documents Source Links: | Executive Summary | NotebookLM Podcast | Briefing Document | Detailed Timeline |
2017: Comprehensive Executive Summary
2017: Comprehensive Executive Summary
“Stillwater Financial Position & Funding Needs: 2017 In-Depth Executive Summary”
1. Overview
In 2016–17, the City of Stillwater finalized its Annual Comprehensive Financial Report (ACFR), adopted its Estimate of Needs (budget revenue requirements), certified its Sinking Fund levy schedule, and reviewed the performance of its largest component unit, the Stillwater Medical Center Authority. This summary synthesizes these interrelated documents to provide a holistic view of the city’s fiscal health, capital funding requirements, debt service obligations, and the financial vitality of its hospital authority.
2. Key Financial Highlights
- Operating Position (City):
- The Estimate of Needs set the General Fund appropriation at $1,056,862.78, with an assessed valuation of $319.6 million, resulting in a total mill rate of 3.25 ($.00325 per $1 of assessed value) to generate $1.037 million in ad valorem tax revenue.
- The Sinking Fund Schedule calls for a levy sufficient to raise $988,221.61, plus delinquent taxes, yielding $1,037,632.69 to cover bond principal, interest, and related costs 2017-Sinking-Fund-Estim….
- Debt & Capital Assets (City):
- 2010 GO Refunding Bonds: $800,000 outstanding, with final maturities in 2021.
- Sinking Fund Assets (6/30/16): Cash of $198,370.94; accrued judgments receivable of $117,929.45; net requirement of $1,056,862.78.
- Projected Debt Service (2018–24): Approximately $37.2 million in combined principal and interest on Series 2014 & 2017 bonds.
- Operating Position (Medical Center):
- 2017 Operating Revenues: $184.4 million; Operating Income of $17.9 million.
- Net Position Growth: Increased by $23.85 million (15%) in 2017, driven by strong patient volume and investment performance 2017-Stillwater-Medical….
- Cash & Investments: Cash down 47% (to $17.6 million); investments up 104% (to $95.4 million), reflecting debt‐financed capital spending and market returns.
3. Deep Dive Analysis
3.1 City Estimate of Needs & Tax Levy
- Assessed Valuation Basis: Total valuation of $319.6 million (real: $280.1 M; personal: $32.3 M; public service: $7.16 M).
- General Fund: Mill levy minimal (data redacted on form), but sinking fund levy of 3.25 mills generates the necessary capital debt service.
- Appropriation Process: County Excise Board’s Order solidified the certified levy; ensures legal compliance with 68 O.S. § 2814.
3.2 Sinking Fund Obligations
- Detailed Bond Schedule (SF-3):
- 2010 GO Refunding: Uniform maturities of $800,000 with final maturity of $350,000 on 6/1/21.
- Accrual Basis: Interest accruing at $138,933.33 through 6/30/16, with $11,800.33 unpaid 2017-Sinking-Fund-Estim….
- Asset Coverage:
- Cash & investments earmarked for sinking fund: ~$30.6 M (net of current obligations).
- Judgments and interest receivable bolster fund balance.
3.3 Medical Center Authority Performance
- Revenue Drivers:
- Patient Service Revenue: $176.7 M (up 12% YoY)—higher inpatient, outpatient, and clinic volumes.
- Investment Gains: $6.4 M in investment income; $1.86 M gain on imaging joint venture.
- Expense Pressures:
- Personnel Costs: $89.6 M (up 13% YoY)—staffing levels increased to meet volume.
- Supplies & Other: $51.5 M (up 24% YoY).
- Capital Expansion:
- CAPEX: $25.2 M in gross additions; $13.96 M in construction projects; financed by $35 M Series 2017 bonds.
- Debt Profile: $40.65 M total long-term (incl. $30.83 M Series 2017; $6.36 M Series 2014; $3.46 M capital leases).
4. Conclusions & Strategic Implications
- Sustainable Debt Service: Current sinking fund levy and restricted assets provide broad coverage for bond obligations; maintaining the 3.25 mills levy is essential to preserve creditworthiness.
- Medical Center Vitality: Strong operating margins and healthy net position growth underpin continued capital investments; prudent management of cash versus investment portfolios is critical.
- Policy Considerations:
- Mill Levy Adjustments: Monitor assessed valuations and delinquency rates to adjust sinking fund mills, avoiding shortfalls.
- Reserve Targets: Ensure compliance with bond covenants (e.g., 75 days cash on hand for Series 2017).
Capital Planning: Align future debt issuances with strategic healthcare facility expansions and city infrastructure needs.
Research Documents Source Links: | Executive Summary | NotebookLM Podcast | Briefing Document | Detailed Timeline |
2016: Comprehensive Executive Summary
2016: Comprehensive Executive Summary
“Navigating Stillwater’s Fiscal Landscape: 2016 Comprehensive Financial & Budgetary Analysis”
In 2016, the City of Stillwater undertook a rigorous review of its financial position, culminating in the Annual Comprehensive Financial Report (ACFR), the adoption of its Fiscal Year 2016 budget, and the submission of its Estimate of Needs and Sinking Fund requirements to the Payne County Excise Board. Concurrently, the City filed its Annual Survey of City and Town Finances (SA&I 2643) with the State Auditor, and the Stillwater Medical Center Authority (a City component unit) released its independently audited financial statements.
Key highlights include:
- Strong Fund Balances & Revenue Stability: The City’s General Fund began FY 2016 with a healthy unassigned balance, supporting a balanced budget of roughly $112.9 million in expenditures and projected revenues of $115.1 million 2016-Estimate-Needs-Sti….
- Capital Needs & Sinking Fund: To support debt service and capital projects, the City’s FY 2016 Sinking Fund Estimate of Needs totaled $1.15 million, reflecting a conservative 3.78 mills levy on an assessed valuation of $304.5 million 2016-Sinking-Fund-Estim….
- State Compliance & Intergovernmental Receipts: The SA&I 2643 report shows total tax revenue of $28.6 million, supplemented by $1.03 million in franchise fees and $1.27 million in property taxes, with nearly $1.03 million received in state-shared gasoline taxes and other grants 2016-Stillwater-2643.
- Medical Center Financial Health: As a key component unit, the Stillwater Medical Center Authority reported net patient service revenue of $157.8 million, operating income of $17.9 million, and an increase in net position of $21.7 million (15.2%) for the year 2016-Stillwater-Medical….
Deep Dive Summary
1. Annual Comprehensive Financial Report (ACFR)
- Unrestricted Fund Balance: The City closed FY 2015 (ACFR dated December 31, 2016) with a substantial unrestricted fund balance in the General Fund, demonstrating fiscal prudence in the face of moderate sales‐tax growth and flat ad valorem assessments.
- Trend Analysis: Over the past five years, the City has maintained fund balance levels between 18% and 25% of annual operating expenditures, well above the 15% target for fiscal resilience.
2. FY 2016 Adopted Budget & Estimate of Needs 2016-Estimate-Needs-Sti…
- Total Revenues: Projected at $115.1 million—driven by $30.3 million in sales tax (26.4%), $4.1 million in “other taxes,” and stable service‐fee collections.
- Expenditures: Set at $112.9 million, with 83.3% for operating, 8.9% for capital outlay (including $3.5 million for pavement maintenance and $9 million for traffic signals, police units, and utility repairs), and 7.8% for debt service.
- Budget Process: A public hearing was held June 1, 2015, in accordance with the Oklahoma Municipal Budget Act, ensuring transparency and citizen participation ahead of Council adoption.
3. Sinking Fund Estimate of Needs 2016-Sinking-Fund-Estim…
- Purpose: To provide for debt service on voter‐approved bonds and accumulated liabilities, including a 5% delinquency penalty.
- Calculation:
- Approved Budget Requirement: $1,132,843.36
- Excess of Assets over Liabilities: $37,909.90
- Balance Required to Raise (Line 4): $1,094,933.46
- Plus 5% Delinquency (Line 5): $54,746.67
- Total Appropriation (Line 6): $1,149,680.13
4. Annual Survey of City & Town Finances (SA&I 2643) 2016-Stillwater-2643
- Tax Revenues:
- Property Taxes (T01): $1,139,769
- General Sales Tax (T09): $28,638,322
- Franchise Fees (T15): $1,063,336
- Intergovernmental Receipts: $154,698 in general support; $445,746 for streets/highways; $1,028,410 for airports; and $285,976 for housing and community development.
- Operating Expenditures: $32.3 million in salaries and wages; $27.0 million for utility systems; $1.2 million for parks and recreation; $1.1 million for libraries; and $33.4 million in interest on utility–related debt.
5. Stillwater Medical Center Authority (Component Unit) 2016-Stillwater-Medical…
- Operating Performance:
- Net Patient Service Revenue: $157.8 million (up 5.2% from prior year)
- Operating Income: $17.9 million (down 5.9% year‐over‐year, due to staff expansion and higher supply costs)
- Balance Sheet Strength:
- Cash & Equivalents: $32.9 million (–3.2%);
- Investments: $46.8 million (+8.8% market gains);
- Capital Assets, Net: $75.9 million (+21.2% construction and equipment).
- Debt Profile:
- Revenue Bonds (Series 2014): $9.48 million outstanding (1.69% interest).
- Capital Leases: $2.67 million with maturities through 2020.
Net Position: Increased by $21.7 million (15.2%), closing at $164.6 million.
Research Documents Source Links: | Executive Summary | NotebookLM Podcast | Briefing Document | Detailed Timeline |
2015: Comprehensive Executive Summary
2015: Comprehensive Executive Summary
“Balancing Growth and Stewardship: Stillwater’s 2015 Financial Landscape”
Overview
The City of Stillwater’s Comprehensive Annual Financial Report (CAFR) for the year ended June 30, 2015, along with related documents—the Sinking Fund Estimate of Needs, the Annual Survey of City and Town Finances (Form 2643), and the Stillwater Medical Center Authority’s audited financial statements—collectively demonstrate strong fiscal health, continued investment in infrastructure, and robust performance of the City’s component unit, the Medical Center Authority.
Key Financial Highlights
| Metric | 2015 | 2014 |
| City’s Net Position (government-wide) | ~$385 million (↑ 6.0%) | ~$363 million |
| General Fund Balance | $XX million (↑ X. X%) | $XX million |
| Total Revenues (All Funds) | $XXX million (↑ X. X%) | $XXX million |
| Total Expenditures (All Funds) | $XXX million (↑ X. X%) | $XXX million |
| Debt Service Coverage (SUA) | X.X times | X.X times |
| Medical Center Authority Net Position | $142.9 million (↑ 14.8%) 2015-Stillwater-Medical… | $124.5 million |
| Medical Center Authority Operating Income | $19.0 million (↑ 34.5%) 2015-Stillwater-Medical… | $14.1 million |
| Medical Center Authority Cash & Equivalents | $34.3 million (↑ 68.2%) 2015-Stillwater-Medical… | $20.4 million |
- Award-Winning Reporting: The CAFR earned its 34th consecutive GFOA Certificate of Achievement, underscoring clarity and adherence to GAAP 2015-ACFR-Stillwater.
- Government-Wide Position: Net position increased by approximately 6%, reflecting healthy operations across governmental and business-type activities 2015-ACFR-Stillwater.
- Infrastructure Investment: Capital asset additions exceeded $XX million, including continued progress on the mini-roundabout downtown and utility system upgrades 2015-ACFR-Stillwater.
Deep Dive Analysis
- Operational Performance
- Governmental Activities: Continued positive fund balance growth in the General Fund supported core services—police, fire, parks—while maintaining a reserve policy tied to CPI or 3% annually 2015-ACFR-Stillwater.
- Business-Type Activities (SUA & Airport): Combined net income covered debt service at X.X× coverage, enabling ongoing utility maintenance without rate shocks 2015-ACFR-Stillwater.
- Long-Term Debt & Sinking Fund
- Sinking Fund Needs (Estimate of Needs report): The City’s 2016 bond sinking fund requirement totals $X million, funding principal and interest through 2025, with ample reserves projected to meet obligations.
- Legal Debt Margin: Remains well below statutory caps, preserving capacity for future capital projects 2015-ACFR-Stillwater.
- Component Unit: Stillwater Medical Center Authority
- Robust Growth: Net position rose 14.8% to $142.9 million, driven by a $19.0 million operating surplus (+34.5%) and strong cash flow from operations ($27.8 million) 2015-Stillwater-Medical… and 2015-Stillwater-Medical….
- Capital Expansion: Over $13 million in capital asset investments in 2015 (including a new medical office building), financed through favorable 1.69% revenue bonds and capital leases 2015-Stillwater-Medical….
- Risk & Compliance: Maintained robust internal controls and compliance, with one material weakness identified (corrected via audit adjustments) and no reportable non-compliance 2015-Stillwater-Medical….
- Economic Context & Outlook
- Stillwater’s diversified economy—anchored by Oklahoma State University, governmental entities (40% of jobs), manufacturing, and technology—supports stable revenue growth 2015-ACFR-Stillwater.
- Infrastructure enhancements (downtown mini-roundabout; utilities upgrades) bolster quality of life and pave the way for sustainable growth 2015-ACFR-Stillwater.
Research Documents Source Links: | Executive Summary | NotebookLM Podcast | Briefing Document | Detailed Timeline |
2014: Comprehensive Executive Summary
2014: Comprehensive Executive Summary
“Navigating Stillwater’s Fiscal Health: A 2014 Financial Overview and Deep Dive”
This report synthesizes three core 2014 financial documents for the City of Stillwater and its principal component unit, the Stillwater Medical Center Authority:
- 2014 Annual Comprehensive Financial Report (ACFR)
- 2014 Annual Survey of City and Town Finances (SA&I Form 2643) 2014-Stillwater-2643
- 2014 Independent Auditor’s Reports & Financial Statements for the Stillwater Medical Center Authority 2014-Stillwater-Medical…
Key Findings
City of Stillwater (SA&I Form 2643) 2014-Stillwater-2643
- Tax Revenues: Property taxes (General, Building & Sinking Funds) and local sales taxes (general, franchise, cigarette, hotel/motel, use) constitute the bulk of municipal revenues.
- Intergovernmental Support: The City received substantial state‐shared fuel and vehicle taxes (Streets & Highways), alcoholic beverage tax distributions, and various grants (water/wastewater, housing/community development).
- Other Revenues & Fees: Utility sales (water, electric) and service charges (sewer, refuse) provided steady non‐tax income, supplemented by interest earnings and miscellaneous fees.
- Expenditures by Function:
- Public Safety: Police and fire services dominate the budget, funded through salaries, operations, and capital outlay.
- Transportation & Utilities: Street maintenance, storm sewers, and landfill operations were significant, reflecting ongoing infrastructure investments.
- Culture & Recreation: Parks, libraries, and community programs consumed a modest share, emphasizing quality‐of‐life services.
- Debt Profile: Long‐term debt and capital leases are responsibly managed, with defined sinking and bond funds to secure revenue bonds.
- Fund Balances: Healthy sinking and bond funds, with prudent reserves in “all other funds,” indicate strong liquidity and debt‐service capacity.
Stillwater Medical Center Authority (SMCA) 2014-Stillwater-Medical…
- Operating Performance:
- Net Patient Service Revenue: Increased to $137.2 M (up 17.4% from 2013), driven by higher outpatient volumes and rate adjustments.
- Operating Income: $14.1 M in 2014 (102.5% growth year-over-year), reflecting disciplined expense control and strategic service expansions (e.g., oncology, orthopedic clinics).
- Nonoperating Results:
- Investment Income: $2.6 M, down 49% as market returns normalized;
- Debt Refinancing: 2014 Bonds at 1.69% interest replaced higher‐coupon 2003/2005 debt, reducing long-term cost by $2.07 M.
- Net Position & Liquidity:
- Net Position: Grew by $16.0 M to $124.5 M (up 14.8%), underscoring robust financial health.
- Cash & Equivalents: $20.4 M (58.9% increase), financed by operating cash flows ($21.2 M) and prudent investing.
- Capital Investments:
- Capital Assets: Net increase to $55.9 M, including new hospital equipment and infrastructure projects.
- Planned Expansion: A $13 M Medical Office Building underway, funded through reserves.
- Risk Management:
- Self-Insured Programs: Worker’s compensation and employee health liabilities are well-funded; insurance coverage for malpractice is maintained through Heartland RRG.
- Regulatory Environment: Active participation in Electronic Health Records incentives and the Supplemental Hospital Offset Payment Program (SHOPP) bolsters revenue despite healthcare reform uncertainties.
Deep Dive Analysis
- Revenue Diversification & Sustainability
- City: The narrow tax base (property & sales) is buffered by state/federal grants, but declining retail activity or legislative changes to shared taxes could stress budgets.
- SMCA: Reliance on Medicare/Medicaid (≈ 50%/41% of revenue) poses reimbursement‐rate risk; diversification into outpatient and specialty clinics mitigates exposure.
- Expenditure Efficiency & Infrastructure
- City: Capital outlay for streets, utilities, and municipal airports is aligned with long-term debt capacity, preserving service levels without overleveraging.
- SMCA: Operating expense growth (6.9% for payroll; 13.5% for supplies) was proportionate to revenue gains, driving a 102.5% leap in operating income.
- Debt Management & Financial Flexibility
- City: Maintains sinking funds and bond reserves, meeting debt-service coverage covenants and retaining capacity for future capital needs.
- SMCA: Refinancing at historic lows extends debt maturity prudently and releases cash for facility expansion.
- Risk & Reform Preparedness
- The City’s self-insurance and stable enterprise fund operations mitigate premium spikes; ongoing compliance with Open Meetings and reporting statutes underpins transparency.
- SMCA’s proactive engagement with PPACA provisions, EHR incentives, and SHOPP demonstrates adaptability to evolving healthcare policy.
Research Documents Source Links: | Executive Summary | NotebookLM Podcast | Briefing Document | Detailed Timeline |
2013: Comprehensive Executive Summary
2013: Comprehensive Executive Summary
“Dual Financial Overview: City of Stillwater & Stillwater Medical Center Authority, FY 2013”
I. City of Stillwater: 2013 Annual Survey of City & Town Finances
Key Highlights
- Total Tax Revenues: $13.1 million in property taxes; $26.7 million in general sales taxes; plus $1.2 million in franchise fees and $805,941 in hotel/motel taxes, totaling over $52 million in tax collections 2013-Stillwater-2643.
- Intergovernmental Revenue: Approximately $6.1 million in street & highways grants, $4.1 million for health/hospital, and $3.3 million for airports. Federal grants contributed $1.9 million, including $1.2 million for housing/community development 2013-Stillwater-2643.
- Other Revenues: Utility sales brought in $13.2 million; sewer & refuse charges added $4.2 million and $4.7 million respectively; miscellaneous commercial activities contributed $803,257 2013-Stillwater-2643.
- Expenditures: Total outlays exceeded $80 million: $61.6 million for fire & public safety; $15.3 million for waste and sewer operations; $13.1 million for highways; and $7.9 million in financial administration 2013-Stillwater-2643.
- Net Position & Debt: Sinking funds held $321,656; unexpended bond proceeds totaled $67.9 million; long-term debt for roads and utilities stood at $9.9 million and $10.6 million respectively; total outstanding debt was $17.7 million 2013-Stillwater-2643.
Deep Dive Analysis
- Revenue Diversification: While taxes remain the backbone, intergovernmental grants and utility revenues diversify funding, shielding the city against volatility in any single revenue stream.
- Infrastructure Investment: Highways and public safety dominate expenditures, reflecting the city’s commitment to core services; however, rapidly growing utility and airport grants suggest evolving strategic priorities.
- Debt Management: Strong sinking fund balances and controlled issuance of short- and long-term debt indicate prudent fiscal stewardship, though rising utility bond liabilities warrant continued monitoring.
II. Stillwater Medical Center Authority: Financial Statements & Audit, FY 2013
Key Highlights
- Operating Performance: Net patient service revenue rose to $116.9 million (up 16.2% YoY); operating income was $6.98 million despite a 27.3% jump in salaries & benefits and a 19.4% increase in professional fees 2013-Stillwater-Medical….
- Nonoperating & Investment Income: Investment income surged to $4.46 million (up 64.3%), buoying net nonoperating revenues of $3.69 million; grants and capital gifts added nominal incremental support 2013-Stillwater-Medical….
- Balance Sheet Strength: Cash & equivalents climbed 39.7% to $12.84 million; investments held at $45.1 million; total assets stood at $134.2 million. Long-term debt fell slightly to $14.6 million, and net position rose 10.9% to $108.5 million 2013-Stillwater-Medical….
- Cash Flow & Capital: Operating cash flow of $13.6 million funded $12.4 million in capital asset additions (including $9.7 million in new equipment); $4.1 million net inflow from investing activities restored reserves and funded growth 2013-Stillwater-Medical….
- Strategic Acquisitions: Acquired OrthoOklahoma for $4.21 million, adding surgical capacity and driving revenue synergies; goodwill of $8.98 million amortized over 15 and 5 years 2013-Stillwater-Medical….
Deep Dive Analysis
- Revenue Growth vs. Cost Pressures: Rate adjustments and service expansions fueled revenue, yet rapid cost growth—particularly compensation and purchased services—compressed operating margins by nearly 45%.
- Investment Leverage: Robust investment portfolio and favorable markets contributed materially to financial results, underscoring the Authority’s success in balancing operating dependencies with nonoperating gains.
- Balance Sheet Resilience: Healthy liquidity ratios and controlled leverage (debt-to-equity of ~13%) position the Authority to fund ongoing technology and infrastructure enhancements, though dependency on investment returns introduces market risk.
Risk Management & Compliance: Self-insurance reserves for health and workers’ comp appear adequate, and independent audit reports note no material weaknesses, highlighting effective internal controls 2013-Stillwater-Medical….
Research Documents Source Links: | Executive Summary | NotebookLM Podcast | Briefing Document | Detailed Timeline |
2012: Comprehensive Executive Summary
2012: Comprehensive Executive Summary
“Strengthening Foundations: 2012 Financial Performance of the City of Stillwater and Its Component Units”
This report synthesizes the key financial outcomes and trends from the City of Stillwater’s 2012 Comprehensive Annual Financial Report (CAFR) along with the standalone audits of two major component units—the Stillwater Medical Center Authority and the Stillwater Housing Authority. Collectively, these documents illustrate a year of cautious recovery from prior economic downturns, prudent fiscal management, and strategic investments in infrastructure and services.
City of Stillwater (Fiscal Year Ended June 30, 2012)
- Net Position Growth
Government-wide net assets improved modestly: governmental activities net assets grew by 2.4%, while business-type activities (primarily utilities) saw a 3.2% increase due to rate adjustments and stabilized revenues 2012-ACFR-Stillwater. - Revenue Highlights
− Sales & Use Tax rose by $1.4 million, bolstering general fund reserves.
− Utility Charges increased by $4.55 million following adopted rate increases across all services 2012-ACFR-Stillwater. - Expenditures & Cost Controls
Despite lingering pressures from the national recession, no emergency reserves were tapped; cost reductions and frozen step-increases (lifted in FY12) maintained core services without layoffs 2012-ACFR-Stillwater. - Capital & Debt
− Capital assets reached $460.7 million (net of $249.6 million depreciation), reflecting investments in roads, utilities, and public safety equipment.
− Outstanding long-term debt stood at $38.7 million, consistent with prior year levels 2012-ACFR-Stillwater.
Stillwater Medical Center Authority (Years Ended December 31, 2012 & 2011)
- Financial Position
Net position surged by 17.7% in 2012, an increase of $15.4 million, driven by strong operating income and significant nonoperating gains 2012-Stillwater-Medical…. - Operating Performance
− Operating income grew to $12.85 million (+1.2%), with patient service revenues of $93.4 million and ancillary revenues up 23.2% thanks to foundation contributions and Medicaid incentives 2012-Stillwater-Medical….
− Nonoperating revenue jumped 662%, led by investment income improvements 2012-Stillwater-Medical…. - Liquidity & Investments
Cash reserves declined by $7.6 million (44%) as management reallocated resources into capital improvements; total investments rose to $35.3 million 2012-Stillwater-Medical…. - Capital Improvements & Debt
− $12.99 million in new equipment and infrastructure was acquired in 2012.
− Revenue bonds and leases outstanding totaled $14.7 million, with new issuances of $0.73 million 2012-Stillwater-Medical….
Stillwater Housing Authority (Year Ended December 31, 2012)
(Note: The uploaded PDF did not parse fully. Typically, Housing Authority MD&A highlights grant-dependent revenues, rental income stabilization, and modest net position changes. Should you wish to dive into this component unit, please let me know to retrieve additional details.)
Deep-Dive Analysis
- Economic Context & Outlook
Stillwater’s diversified economy—anchored by Oklahoma State University and regional healthcare—began rebounding, with sales taxes and utility revenues signaling resident and commercial activity stabilization 2012-ACFR-Stillwater. - Governance & Recognition
The CAFR earned the GFOA Certificate of Achievement for the 30th consecutive year, underscoring transparent and exemplary financial reporting processes 2012-ACFR-Stillwater. - Service Delivery & Capital Strategy
Continued investment in public safety (police/fire vehicles, rescue trails), streets, and utilities infrastructure prepares the City for future growth while maintaining fiscal discipline through budgetary adjustments and reserve policies 2012-ACFR-Stillwater.
Component Unit Synergies
The Medical Center Authority’s robust financial health complements municipal services by reinvesting in local healthcare capacity, indicating alignment between public and quasi-public infrastructure initiatives.
Research Documents Source Links: | Executive Summary | NotebookLM Podcast | Briefing Document | Detailed Timeline |
2011: Comprehensive Executive Summary
2011: Comprehensive Executive Summary
This executive summary synthesizes key financial and operational highlights from the following 2011 reports for the City of Stillwater and its affiliated entities:
- Annual Comprehensive Financial Report (ACFR) of the City of Stillwater
- Housing Authority of the City of Stillwater – Basic Financial Statements & Audit (HUD) 2011-Housing Authority-…
- Annual Survey of City & Town Finances (SA&I Form 2643) 2011-Stillwater-2643
- Stillwater Medical Center Authority – Component Unit Financial Statements & Audit 2011-Stillwater-Medical…
Key Highlights
1. City of Stillwater ACFR
- Net Position Growth: The City’s total net position rose by approximately 8% in 2011, driven largely by strong operating revenues and disciplined debt management.
- Revenue Mix: Major revenue sources included utility charges (water, electric), taxes, and intergovernmental grants.
- Debt Levels: Outstanding long-term debt remained stable, with planned repayments and no significant new issuances.
- Cash Flows: Positive cash flows from operations funded capital projects without reliance on short-term borrowing.
2. Housing Authority of the City of Stillwater 2011-Housing Authority-…
- Total Assets grew from $6.99 M to $7.10 M (≈1.6%), driven by capital improvements funded via HUD grants.
- Net Assets decreased slightly from $6.76 M to $6.64 M (–1.7%), reflecting a revenue decline in administrative fees.
- Operating Revenues fell by $557 K (–11%), primarily due to reduced HUD operating grants for the Housing Choice Voucher program.
- Expense Control: Total expenses declined by $75 K (–2%), with cost savings in utilities and administrative functions.
- Supplemental Highlights: A one-time $12.8 K fraud recovery and proceeds of $12.3 K from asset sales partially offset revenue declines.
3. City Annual Survey (Form 2643) 2011-Stillwater-2643
- Intergovernmental Receipts: $125 K from alcohol beverage tax; $365 K for streets & highways; $299 K for airports; $227 K for housing/community development.
- Utility Sales: Water system grossed $9.58 M; Electric power system $42.58 M; Sewer charges $4.99 M; Refuse collections $4.29 M.
- Expenditures by Function:
- Police: $8.71 M operations + $16 K capital
- Fire: $4.32 M operations + $447 K capital
- Highways: $1.42 M operations + $2.27 M capital
- Debt Service: Outstanding sewer debt $13.53 M (net after $2.17 M retirements); water supply debt $8.30 M.
- Cash & Investments End-of-Year: $378 K in sinking funds; $53.18 M in bond funds.
4. Stillwater Medical Center Authority 2011-Stillwater-Medical…
- Net Assets increased from $74.37 M to $86.69 M (+16.6%), driven by a $12.32 M surplus and capital gifts.
- Operating Revenues: $93.44 M patient service revenue (+11.4% vs. prior year), plus $5.91 M joint venture income.
- Operating Expenses: $87.38 M, including $25.27 M depreciation and $11.79 M professional fees.
- Operating Income: $12.69 M (vs. $5.93 M in 2010), reflecting volume growth and improved payer mix.
- Cash Flows: Net cash from operations $16.35 M; invested $8.01 M in capital assets, leaving $2.46 M net increase in cash.
- Debt: Long-term debt reduced from $16.58 M to $13.99 M; capital lease obligations of $2.77 M remain.
Deep-Dive Analysis
| Area | Drivers & Trends | Implications |
| Revenue Diversity | Strong utility revenues underpin general fund stability; HUD grants crucial for Housing Authority. | Opportunities to diversify grants and fees; evaluate long-term sustainability of federal funding. |
| Expense Management | Moderate expense growth at Medical Center; tight controls at Housing Authority. | Leverage procurement efficiencies; explore shared services among entities. |
| Capital Investments | Continued investment in infrastructure (HUD capital fund, MC equipment) without excessive borrowing. | Maintain balanced capital plan; assess lifecycle costs and alternative financing (e.g., grants, leases). |
| Debt Strategy | Steady retirement of bonds; no new major issuances; manageable debt ratios across all entities. | Continue pay-as-you-go approach; monitor interest rate environment for refunding opportunities. |
| Liquidity & Cash Position | Healthy cash inflows with reserves in city bond and sinking funds; Medical Center cash surplus. | Preserve contingency reserves; consider strategic use of cash for grant matching or early debt retirement. |
Research Documents Source Links: | Executive Summary | NotebookLM Podcast | Briefing Document | Detailed Timeline |
USSSA STILLWATER
USSSA STILLWATER
Research Documents Source Links: | Executive Summary | NotebookLM Podcast | Briefing Document | Detailed Timeline |
Legal Filings & Ethical Reports
- Oklahoma Attorney General Complaint: State-level filing with detailed claims on public corruption (Filed: 2024-04-17, Citizen Complaint CC-2024-127) | Download Attorney General Complain
- IRS Whistleblower Form F-211: Federal filing citing revenue abuse via 501(c)(3) entities (Filed: 2024-12-11 Claim Number: 2025-002158) | Download Executive Summary
- Florida AG vs USSSA: Civil suit settlement (sealed), originally filed to investigate RICO-based financial conduct
- 1st Complaint: 2023-08-27, CASE NO. 6:23-cv-1637-RBD-RMN) | Download Florida AG vs USSSA
- 2nd Amended Complaint: Updated Filed: 2024-04-17, CASE NO. 6:23-cv-1637-RBD-RMN) | Download 2nd Amended Complaint: Florida AG vs USSSA
These filings underpin the case for state-level reform in Oklahoma and national replication of the oversight model built through this dissertation.
Research Methodology
- Over 20,000 manually validated tournament entries from USSSA public records
- Financial modeling of team entry fees, umpire costs, and gate revenue by facility
- Use of FOIA/Open Records Act to obtain city budgets, contracts, and sales tax votes
- Economic Impact Revenue generated by Facility, Municipality, County, State or Tribal
-
Replicable model for other states to audit youth sports eco-system and economic impact model
Integrity of the Game vs Economic Impact (Politics): The Oklahoma Business Plan
Baseball Heaven Documentation
Contact & Support
To request access to restricted case files, submit an official inquiry, or support the project:
- Email: kenneth@bcmsports.net
- Txt2Give (501c3 donations): Text GIVE to 405-266-2513
-
Contact Form for direct academic or legal inquiries
Cowboy Heaven 2025 City of Stillwater Request For Proposal
Integrity of the Game vs. Economic Impact (Politics); The Oklahoma Business Plan
Prepared by: Kenneth R. Crawford, M.S., Sport Administration | Download |
Contact: kenneth@bcmsports.net | 405-642-9592
Date: July 2025
- Research Foundation & Methodology
This proposal leverages 25 years of direct engagement in Oklahoma youth sports governance, financial oversight, and community-based programming. Our methodology integrates:
- Manual validation of USSSA event fees and attendance via the Hidden Valley Dataset (2001–2025)
- GIS-enabled facility capacity modeling
- Municipal budget-audit techniques
- Legal precedent analysis (e.g., Trimbel v. City of Moore, 1991)
- Executive Summary
“Cowboy Heaven” delivers a data-driven blueprint for youth sports in Stillwater, aligning transparency, community equity, and economic impact. Key objectives:
- Institute GAAP-compliant financial reporting and third-party audits
- Harness statewide Hidden Valley insights to bolster tourism and local spending
- Forge a public-private partnership model with OSU, SPS, and the Stillwater CVB
III. Operational Scope
Facility Management: Grounds upkeep, lighting & safety inspections, concessions, restroom services, parking, real-time TXT2Give financial reporting.
Program Delivery: Spring/Fall leagues, clinics, camps; no-cost slots for Title I & special-needs youth; open tournaments with flexible age cutoffs.
Technology Tools: AppSheet apps for daily operations; Looker Studio dashboards for City oversight.
- Ethical Audit & Financial Oversight
Hidden Valley Findings (2001–2025)
- $613K USSSA entry fees at Stillwater venues
- No formal lease or audit agreements pre-2025
Proposed Reforms - Third-party financial audits
- Transparent revenue-sharing agreements
- Public quarterly reporting of event revenues
- Commission-Led Partnership Model
Cowboy Heaven Sports Commission under BCM Sports guidance:
- City of Stillwater (oversight & contracting)
- Stillwater Chamber of Commerce (business engagement)
- Oklahoma State University (research & facility support)
- Stillwater Convention & Visitors Bureau (tourism strategy)
- Oklahoma Little League (league sanctioning)
- SBC-4-Kids Initiative (equitable access grants)
- Hidden Valley Dataset & Local Context
Stillwater Totals (2001–2025)
| Metric | Value |
| Division-level events | 416 |
| Team entry fees | $613,175 |
| Total economic impact | $1,528,011 |
VII. Dome Infrastructure & Field Integration
Vision: Replace 30 outdoor fields with 10 school-site domes (40×60 yd) to maximize year-round usage.
Cost: $2.19M per dome × 10 = $21.9M
Payback: ~1.8 years via major tournament revenues
VIII. Baseball Dome Statement of Work & Cost Analysis
Statement of Work:
- Delivery and installation of two full-scale Baseball Heaven domes (fabric shell, structural frame, anchoring systems) fileciteturn16file1L119-L124
- Site preparation: grading, drainage, electrical infrastructure
- Interior fit-out: synthetic turf, LED lighting, climate control, netting, spectator seating
- Commissioning: safety inspections, operational training, handover to City operations team
Cost Analysis: - Capital Expenditures: Dome shell & structure: $2.19M/dome; site work & utilities: $150K/dome; contingency (10%): $234K/dome
- Annual Operational Expenses: Utilities, maintenance, staffing: ~$180K/dome
- Turf-4-Kids Initiative: Cost & Financing
2025 Projection: $9.84M (+20%)
Funding Models:
- Upfront capital outlay
- Farley lease financing (no city capital required)
- Vision for Stillwater Public Schools Integration
- Align elementary-league programs by enrollment & geography
- Install satellite batting cages ($630K each) at six elementary clusters
- Implement a hub-and-spoke model for PE, clinics, and emergency shelter use
- Mega Softball Showcase Scenario
- Host 700+ teams (~2,800 games): $620K in entry fees, $5.3M economic impact
- Accommodation demand: 7,600 room-nights; partner with CVB to bridge shortfall
XII. Umpire Accountability: Salary Model
- 2024 Game-Based Cost: $88K
- Full-Time Salary Model (1.35 FTE): $74K–$81K
- Benefits: budget predictability, improved scheduling control, oversight
XIII. The USSSA RICO Case & Municipal Leverage
The 2024 Florida v. USSSA settlement revealed opaque financial practices. Through this RFP, Stillwater can mandate transparency, competitive bidding, and protection of public assets.
XIV. Enrollment History & Projections
- Early Foundations (1889–1896) Stillwater’s first public school opened in 1889 with 73 students (grades 1–5). By year’s end, enrollment rose to 85, prompting construction of additional facilities; a larger schoolhouse was built in 1896.
- Modern ADM History (2011–2024)
| Fiscal Year | ADM |
| 2011–12 | 7,824 |
| 2012–13 | 7,942 |
| 2013–14 | 8,105 |
| 2014–15 | 8,210 |
| 2015–16 | 8,317 |
| 2016–17 | 8,425 |
| 2017–18 | 8,538 |
| 2018–19 | 8,652 |
| 2019–20 | 6,259 |
| 2020–21 | 5,808 |
| 2021–22 | 5,813 |
| 2022–23 | 6,161 |
| 2023–24 | 6,146 |
- Five-Year Projections (2024–25 to 2028–29)
| Fiscal Year | Projected ADM | Δ vs. Prior |
| 2024–25 | 6,330 | +3% |
| 2025–26 | 6,509 | +3% |
| 2026–27 | 6,704 | +3% |
| 2027–28 | 6,905 | +3% |
| 2028–29 | 7,112 | +3% |
Implications:
- Facilities: Plan for ~7,100 K–12 students by FY 28–29 (~2,300 Pre-K–7 participants).
- Staffing & Budgets: Scale operations, umpires, concessions at 3% annual growth.
- Equity & Access: Expand scholarship funds and Title I outreach in line with enrollment trends.
Conclusion: “Cowboy Heaven” synthesizes Stillwater’s educational legacy and enrollment trajectory into a forward-looking sports facility model—ensuring financial integrity, community equity, and robust economic impact.