
Buck Thomas Park Officials Budget Research
BUCK THOMAS PARK OFFICIALS BUDGET RESEARCH
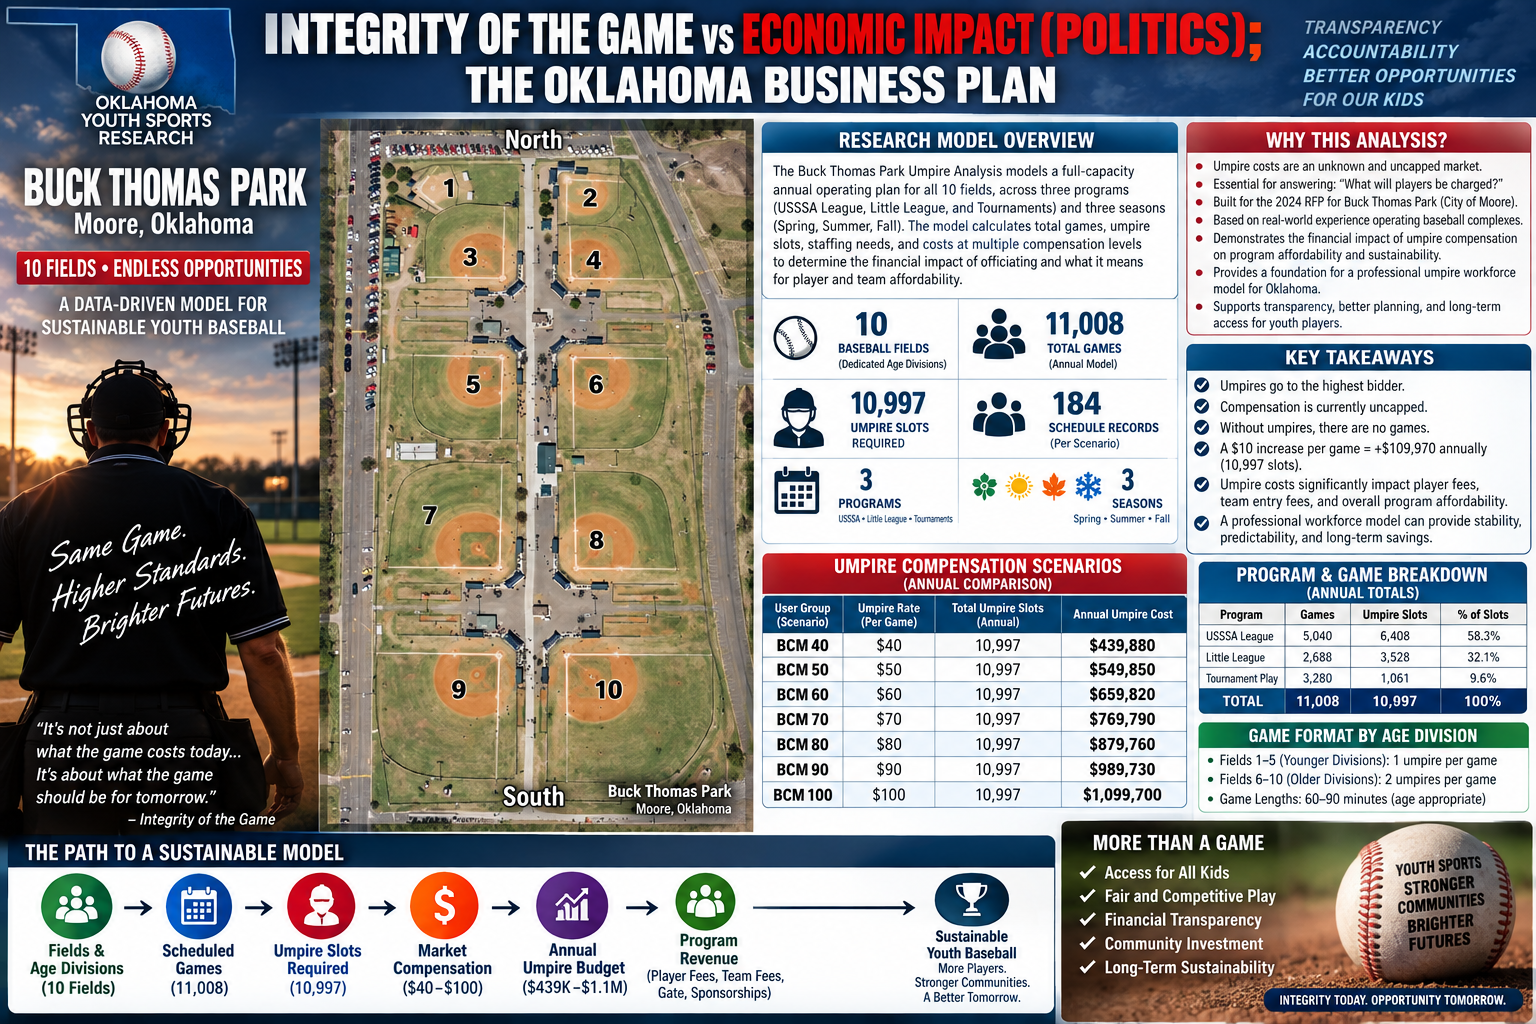
A 2024 scenario-based operating model examining how a ten-field baseball schedule, umpire staffing requirements, compensation rates, and program design can shape the cost of delivering youth baseball.
What the CSV establishes
The model contains 1,288 records and 71 columns. Every BCM compensation scenario contains the same 184 operating records and the same 10,997 umpire slots, allowing a direct comparison of the financial effect of changing the umpire rate while holding the modeled schedule constant.
Player pricing begins with understanding the cost of officials
The research model was developed in connection with the 2024 City of Moore Youth Baseball Leagues/Tournaments Provider RFP. The proposal process required an estimated individual player cost, but that number depended in part on an uncertain and potentially significant operating expense: umpire compensation.
The accompanying research narrative explains that prior Oklahoma operating experience demonstrated how umpire availability could change when the offered per-game rate changed. Instead of assuming one fixed cost, the Buck Thomas spreadsheet tested seven possible compensation environments from $40 through $100 per game assignment.
The result is an operating-budget sensitivity model rather than a simple payroll estimate. It measures how field capacity, scheduling decisions, age-specific staffing requirements, and the market price of officials interact.
RFP Context
- City of Moore RFP #2024-007 sought a youth baseball leagues/tournaments provider.
- The submitted concept proposed Monday, Tuesday and Thursday USSSA League play.
- Friday was designated for a proposed Little League program.
- Wednesday was generally reserved for makeup/rainout use.
- Saturday and Sunday were planned primarily for tournament activity.
- The RFP identified a 2023-style planning fee of $90 player registration + $80 player gate at the BCM 50 assumption.
How the model converts a baseball schedule into a budget requirement
Annual direct umpire cost at the same 10,997-slot schedule
The model holds schedule demand constant. The difference between scenarios is the per-assignment compensation rate.
| User Group | Umpire Rate | Records | Umpire Slots | Modeled Annual Umpire Cost |
|---|---|---|---|---|
| BCM 40 | $40 | 184 | 10,997 | $439,880 |
| BCM 50 | $50 | 184 | 10,997 | $549,850 |
| BCM 60 | $60 | 184 | 10,997 | $659,820 |
| BCM 70 | $70 | 184 | 10,997 | $769,790 |
| BCM 80 | $80 | 184 | 10,997 | $879,760 |
| BCM 90 | $90 | 184 | 10,997 | $989,730 |
| BCM 100 | $100 | 184 | 10,997 | $1,099,700 |
Modeled cost = total umpire assignments multiplied by the applicable scenario rate. These figures are planning-model costs, not verified historical payments.
Where the umpire demand occurs
Tournament play is the largest component of the modeled officiating workload, followed by USSSA League and the proposed Little League program.
Tournament Play
78 schedule records per scenario.
69.2% of annual modeled umpire demand.
$304,200 at BCM 40 → $760,500 at BCM 100.
USSSA League
78 schedule records per scenario.
22.7% of annual modeled umpire demand.
$99,840 at BCM 40 → $249,600 at BCM 100.
Little League
28 schedule records per scenario.
8.1% of annual modeled umpire demand.
$35,840 at BCM 40 → $89,600 at BCM 100.
Spring carries the largest officiating workload
101 records per scenario
24 records per scenario
59 records per scenario
| Scenario | Spring 2024 | Summer 2024 | Fall 2024 | Annual Total |
|---|---|---|---|---|
| BCM 40 | $274,280 | $30,720 | $134,880 | $439,880 |
| BCM 50 | $342,850 | $38,400 | $168,600 | $549,850 |
| BCM 60 | $411,420 | $46,080 | $202,320 | $659,820 |
| BCM 70 | $479,990 | $53,760 | $236,040 | $769,790 |
| BCM 80 | $548,560 | $61,440 | $269,760 | $879,760 |
| BCM 90 | $617,130 | $69,120 | $303,480 | $989,730 |
| BCM 100 | $685,700 | $76,800 | $337,200 | $1,099,700 |
One-umpire and two-umpire fields drive different labor requirements
The model assigns age divisions to specific fields. The five younger-field assignments use one umpire per game; Fields 6–10 use two. If every field is active simultaneously and officials remain assigned to their fields for successive games, the underlying narrative identifies a theoretical minimum workforce of approximately 15 officials present at one time.
| Field | Modeled Division | Umpires Per Game | Operational Effect |
|---|---|---|---|
| 1 | 4U | 1 | Single-official field |
| 2 | 5U | 1 | Single-official field |
| 3 | 7U | 1 | Single-official field |
| 4 | 6U | 1 | Single-official field |
| 5 | 8U | 1 | Single-official field |
| 6 | 9U | 2 | Two-official field |
| 7 | 10U | 2 | Two-official field |
| 8 | 11U | 2 | Two-official field |
| 9 | 12U | 2 | Two-official field |
| 10 | 15U | 2 | Two-official field |
The spreadsheet links officiating expense to affordability questions
League Planning Variables
The CSV contains player-signup and player-gate fields that were designed to test whether planned program revenue could support operating costs.
The RFP describes an estimated 2023-style planning structure of $90 player fee + $80 player gate fee under the BCM 50 assumption.
Tournament Planning Variable
The research narrative references a $500 team entry fee and an assumption of 11 players per team.
$500 ÷ 11 players = approximately $45.45 per player in team-entry cost.
These are planning variables and proposal assumptions. They do not, by themselves, establish actual registrations, collections, gate receipts, refunds, sponsorships, or net operating income.
The budget model sat inside a broader youth baseball operating proposal
League Concept
USSSA League: Monday, Tuesday and Thursday.
Proposed Little League: Friday.
Wednesday: makeup/rainout flexibility.
Tournament Concept
39 tournament events were identified in the RFP concept.
80 teams per event, with 880 players identified in the proposal.
Three-game guarantee before bracket play.
Operating Responsibilities
The RFP contemplated provider responsibility for concession equipment/supplies, field maintenance materials, restroom supplies, trash/debris removal and related operating needs.
The RFP listed an annual lease fee of $6,800.
What the 71-column CSV is designed to capture
Administrative
ID, User Group, Sport, Year, Program, Season, Game Week, Start Date, End Date, Day.
Participation
Players Per Team and related planning assumptions.
Field-Level Operations
Games, officials required per game, umpire slots, cost per game and total field umpire cost for all ten fields.
Facility-Wide Workforce
Minimum Required Umpires, Total Umpire Slots Required and Total Umpire Cost.
Other Labor Variables
Contract Labor Hourly Rate, Hours Per Day and Hours Per Week.
Revenue-Side Variables
Player Gate Fee, Player Signup Fee, Notes and other planning fields.
The dataset should be read as a controlled planning model
- All seven user groups contain 184 records.
- All seven user groups contain 10,997 umpire slots.
- Each scenario contains 28 Little League, 78 USSSA League and 78 Tournament Play records.
- The CSV is the primary source for structured calculations.
- The explanatory narrative provides intent, history and column definitions.
What the model does not establish
It is not a ledger of actual 2024 games, registrations, gate attendance, umpire payments, tournament receipts, refunds, sponsorships, profits or net cash flow. Actual utilization could differ because of demand, weather, cancellations, field conditions, scheduling decisions and official availability.
Why this research matters beyond one facility
The Buck Thomas analysis provides a quantitative baseline for examining the Oklahoma Professional Umpire Workforce Model. It shows the cumulative financial effect of a game-by-game labor market when nearly 11,000 annual assignments must be filled.
Availability
What compensation level is necessary to reliably staff the schedule?
Predictability
Can a more structured workforce reduce uncertainty in annual officiating costs?
Professional Standards
How might training, scheduling, accountability and career pathways change the officiating model?
Read the full analysis and facility context
Buck Thomas Park Umpire Analysis
The comprehensive executive summary documents the scenario structure, facility assumptions, program and seasonal breakdowns, cost sensitivity, data-quality assessment, and relationship to the broader professional umpire workforce concept.
Open Comprehensive Executive SummaryBuck Thomas Park Research
Review the related Buck Thomas Park facility research for additional facility context and the broader Oklahoma youth-sports research framework.
Open Buck Thomas Park PageWhat this research establishes — and what it does not
Established by the research model
- Seven compensation scenarios from $40 to $100.
- 184 schedule records per scenario.
- 10,997 umpire slots per scenario.
- Program-level and seasonal slot distributions.
- Field-level age and umpire staffing assumptions.
- Direct modeled umpire cost under each scenario.
- Cost sensitivity created by changes in the per-game rate.
Not established by the model alone
- Actual 2024 games played.
- Actual umpire payments or tax treatment.
- Actual player or team collections.
- Actual gate or concession revenue.
- Actual tournament participation.
- Actual profitability or net operating income.
- Actual performance of any operator under the model.
A baseline economic model for umpire-dependent youth baseball operations
The Buck Thomas Park Officials Budget Research demonstrates why officiating cannot be treated as a minor line item when evaluating the operation of a large youth baseball complex. At the modeled workload of 10,997 umpire assignments, each $10 movement in compensation changes the annual direct umpire budget by $109,970.
The model therefore provides a quantitative explanation for why player pricing could not be responsibly separated from the cost of officials. Facility capacity creates games; games create umpire assignments; assignments multiplied by market compensation create the labor budget; and the labor budget contributes to the amount of revenue the program must generate.
The research should be understood as a planning and sensitivity model developed from the proposed 2024 operating architecture. Its significance lies not in predicting that every game slot would necessarily be filled, but in showing the scale of financial exposure that can arise if a ten-field schedule is substantially utilized.
Independent analytical publication
This page is an independent research and analytical publication prepared for research, education, transparency, youth-sports planning, and public-interest analysis. It is not represented as an official report of the City of Moore, USSSA, Little League International, Buck Thomas Park, any current facility operator, or any other public or private organization.
Modeled umpire costs, player-cost variables, tournament assumptions, staffing requirements, schedule capacity, and scenario totals are analytical planning figures derived from the supplied research materials and the Buck Thomas Umpire Analysis dataset. They are not audits, tax determinations, forensic-accounting conclusions, verified receipts, verified payroll, legal findings, or allegations of wrongdoing.
Identification of an organization, facility, sanctioning body, program, rate, or operating structure is for research context and does not itself imply misconduct, liability, endorsement, or a verified contractual relationship beyond what the underlying source materials establish.