
Ardmore Regional Park
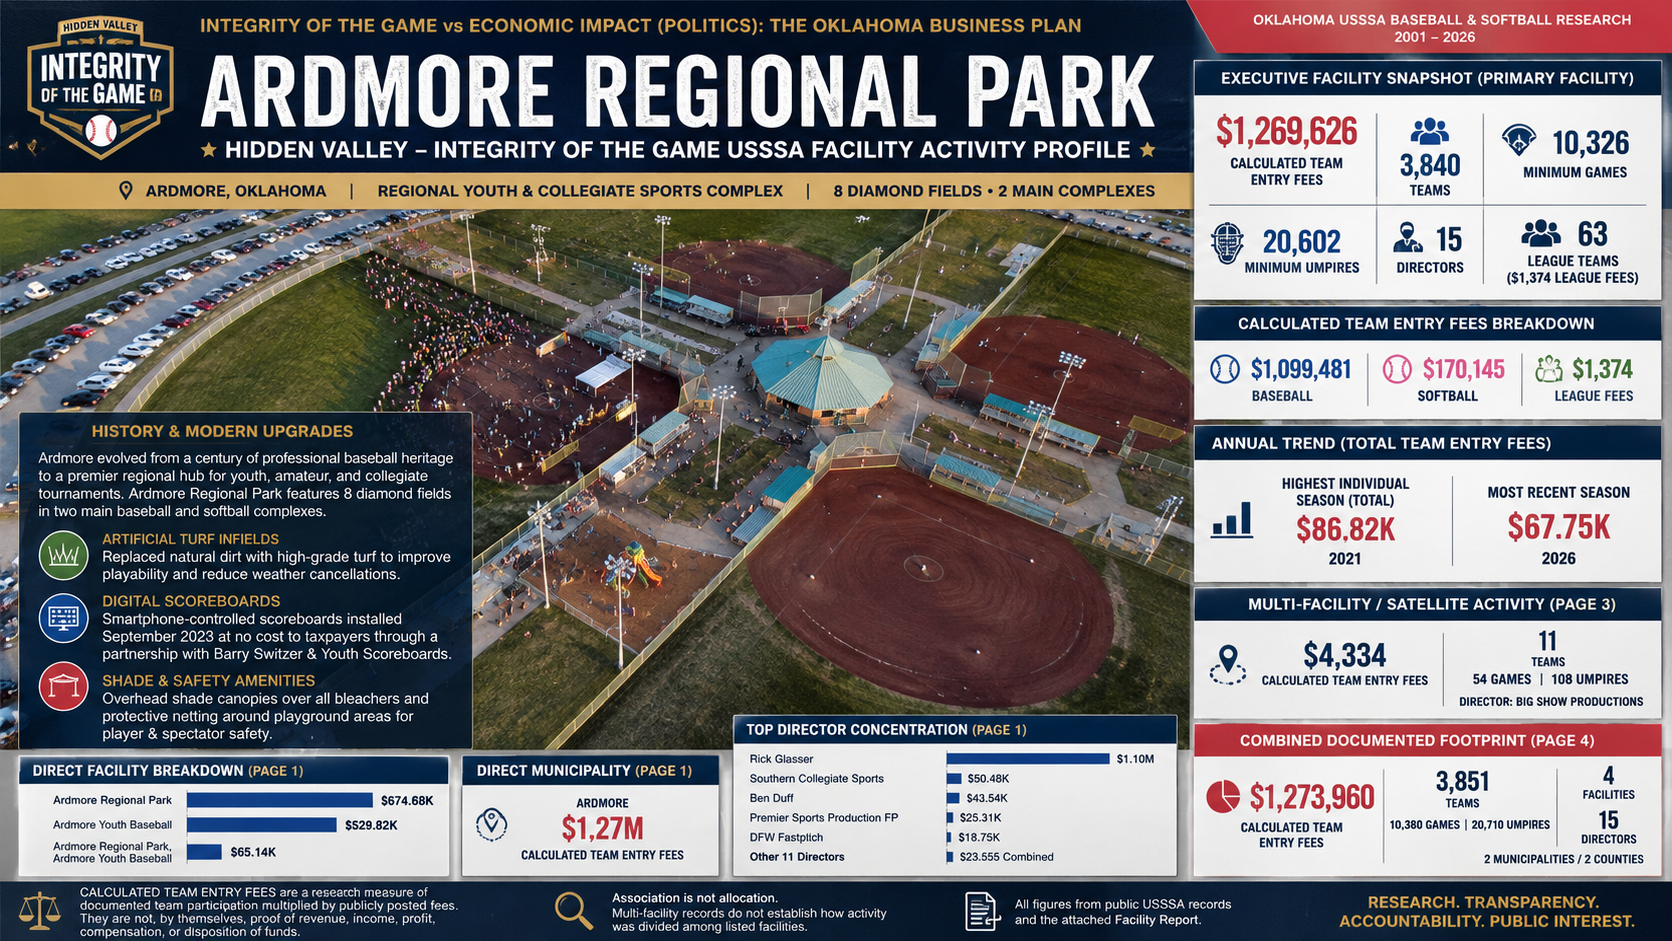
Executive Facility Snapshot
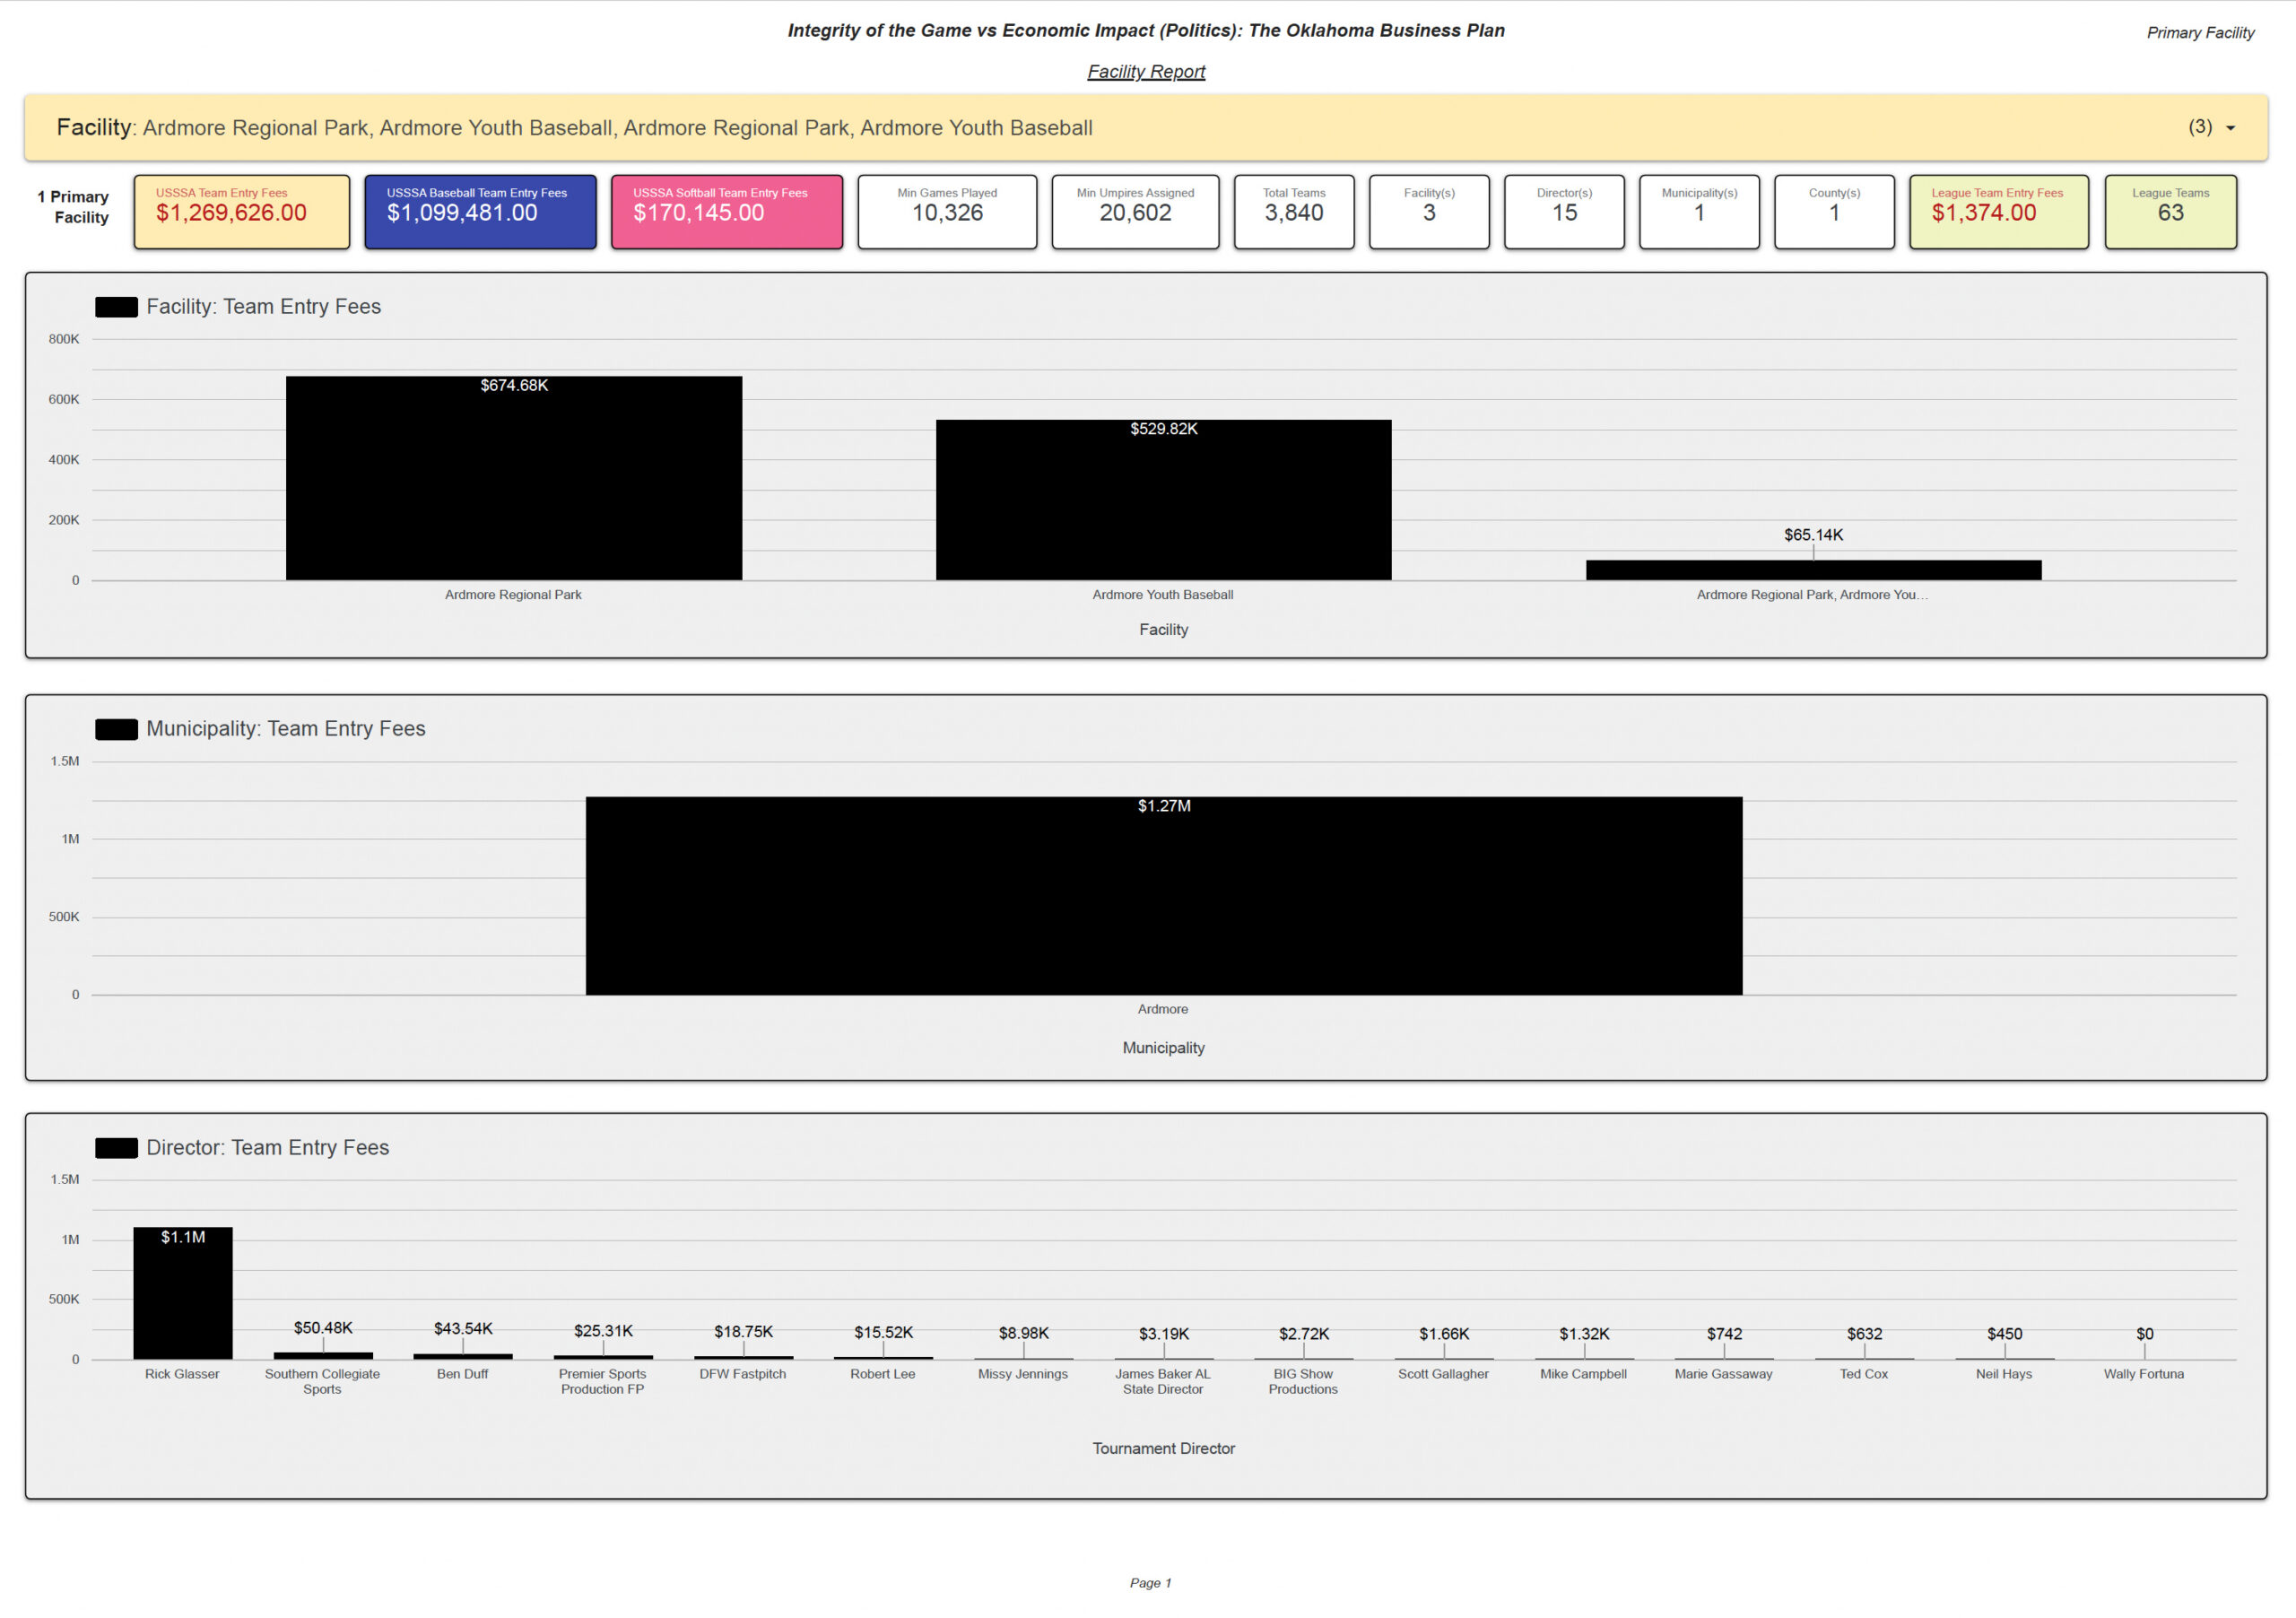
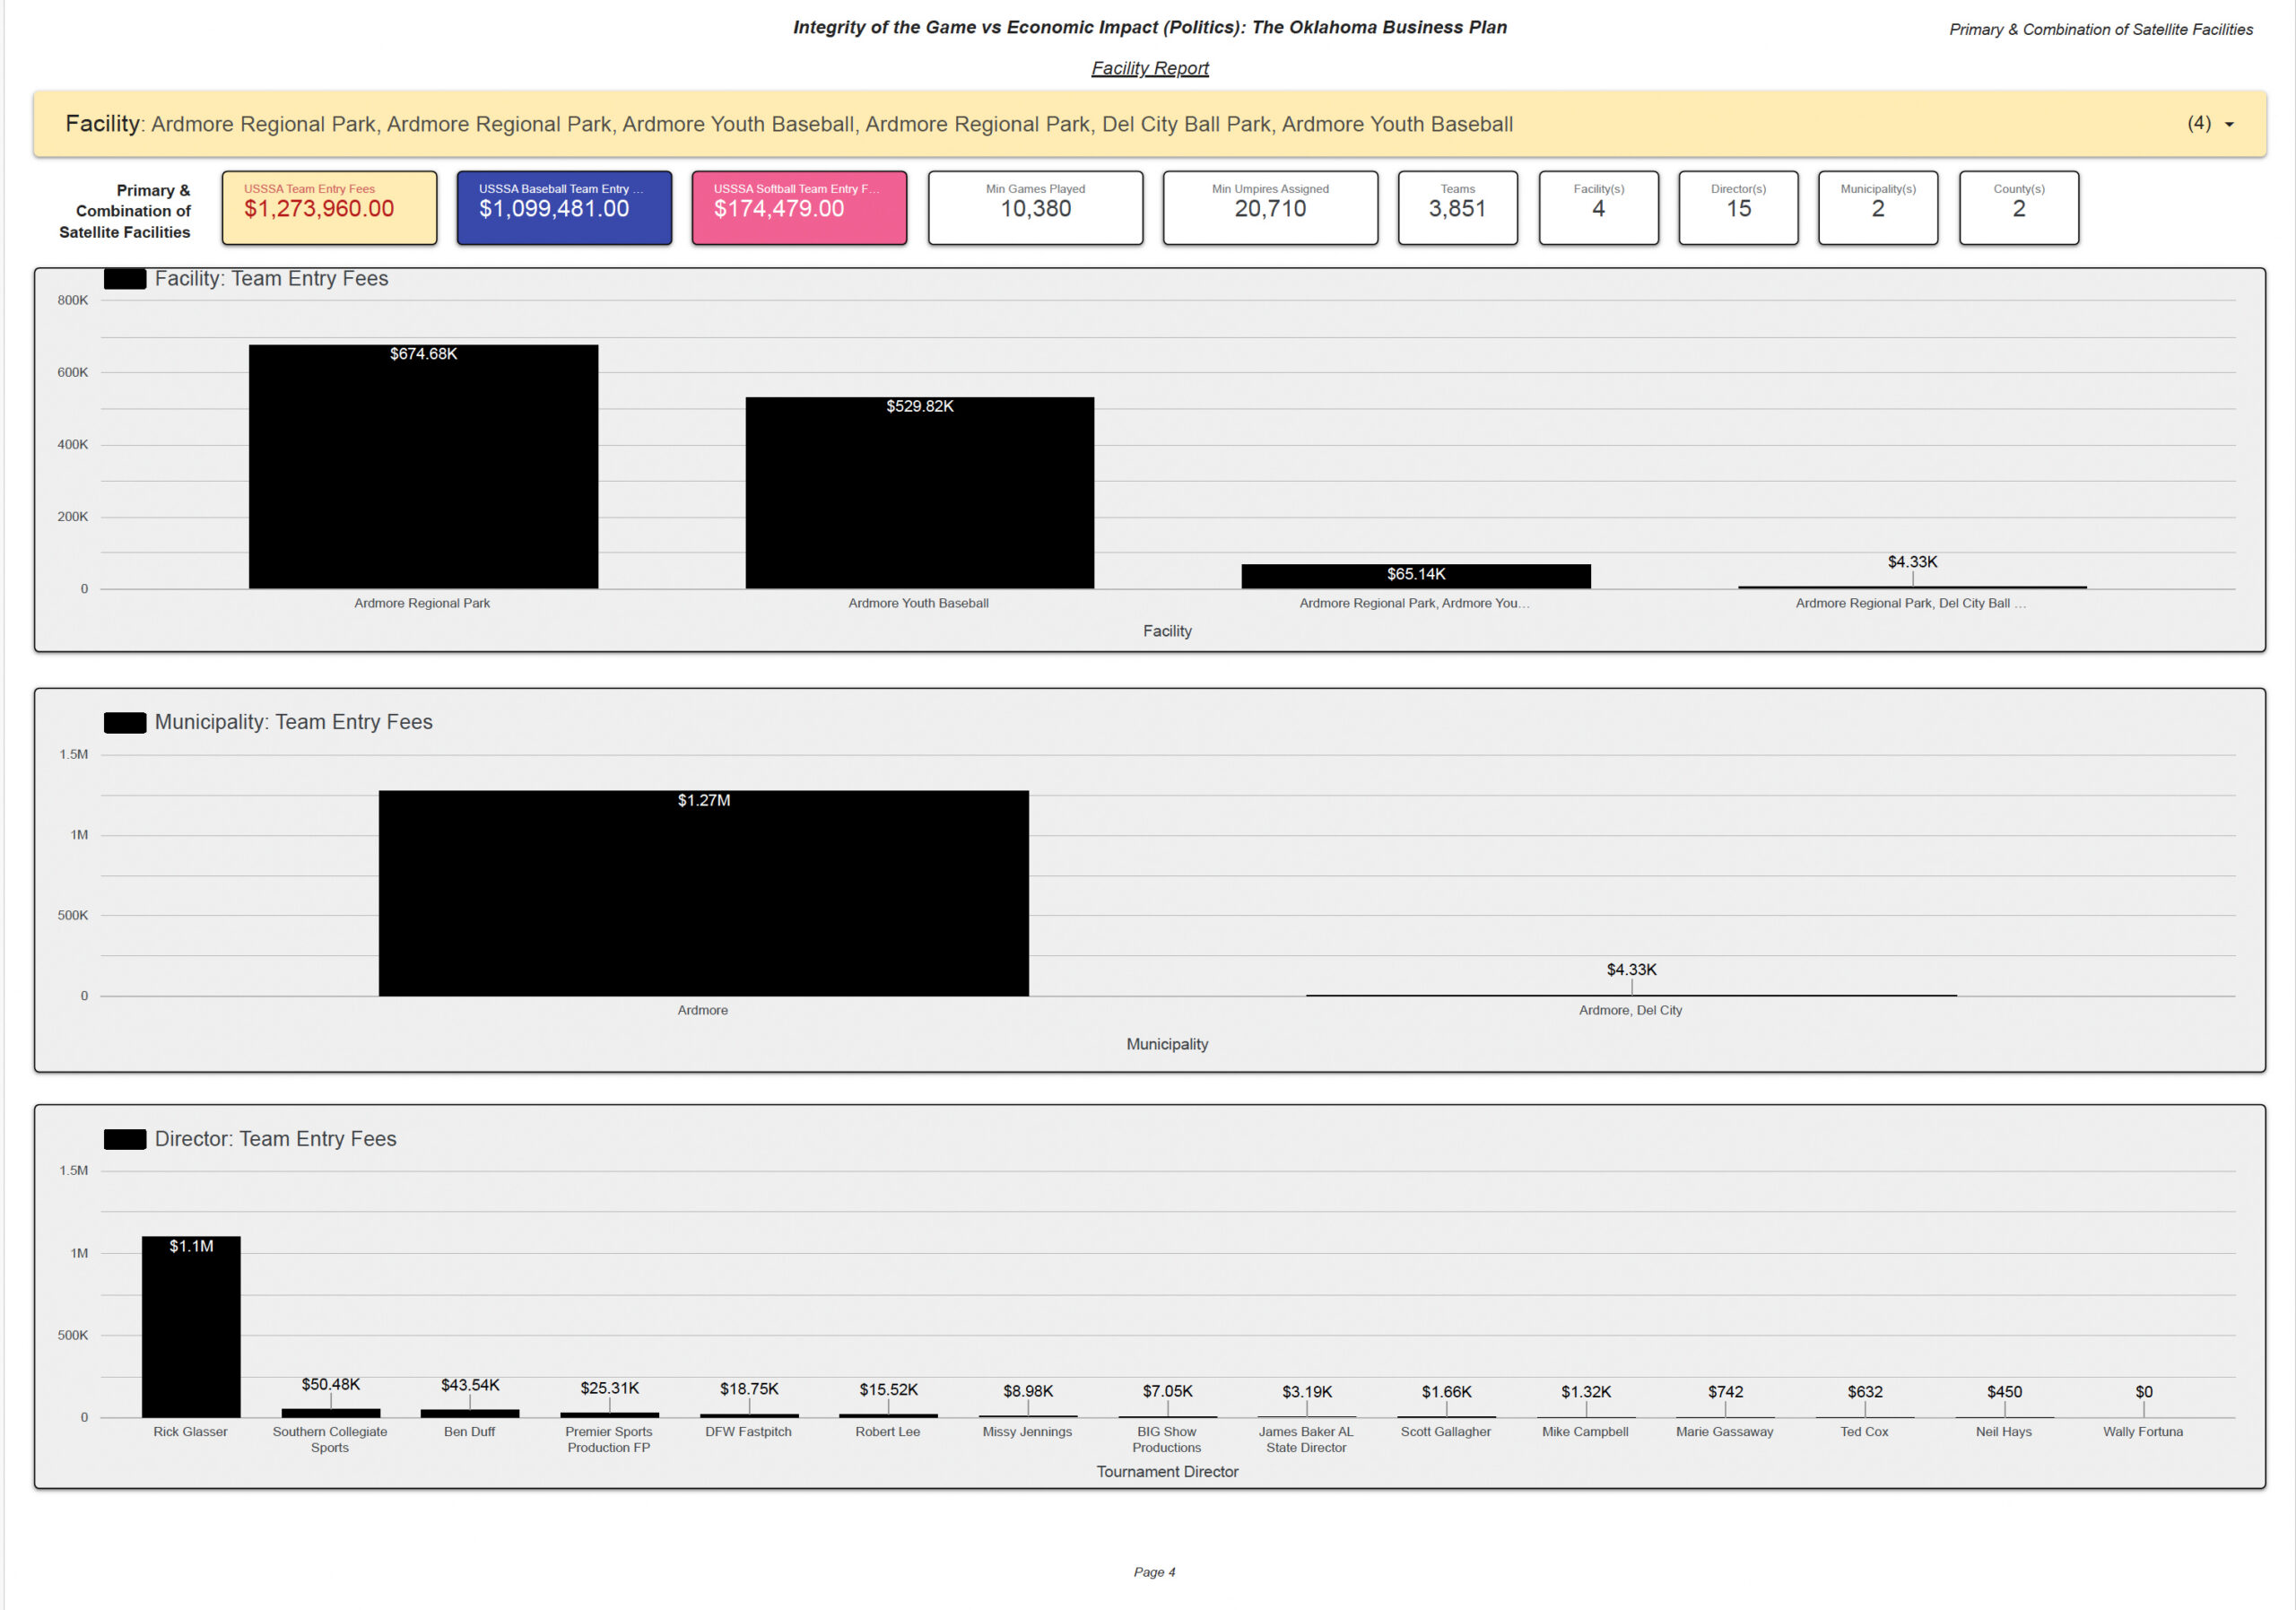
The Hidden Valley facility report documents substantial long-term USSSA activity associated with Ardmore Regional Park and Ardmore Youth Baseball. The direct / stand-alone Primary Facility population identifies $1,269,626 in Calculated Team Entry Fees across 3,840 teams, with at least 10,326 games and 20,602 minimum umpire assignments. These amounts are calculated research measures derived from publicly available event records and posted team entry fees; they are not, by themselves, proof of facility revenue, municipal revenue, director income, profit, or money actually received.
| Direct / Stand-Alone Measure | Reported Value | Research Interpretation |
|---|---|---|
| Calculated Team Entry Fees | $1,269,626 | Calculated activity associated with the stand-alone Primary Facility population. |
| Baseball / Softball | $1,099,481 / $170,145 | Baseball accounts for the large majority of direct calculated entry-fee activity. |
| Teams | 3,840 | Documented team participation in the direct population. |
| Minimum Games / Umpires | 10,326 / 20,602 | Operational scale indicators reported in the dataset. |
| Facility Records / Directors | 3 / 15 | Distinct facility-name records and tournament directors in the direct population. |
| Municipalities / Counties | 1 / 1 | Direct activity is concentrated in Ardmore. |
Direct Facility & Director Concentration
Facility Breakdown
Ardmore Regional Park: $674.68K
Ardmore Youth Baseball: $529.82K
Ardmore Regional Park, Ardmore Youth Baseball: $65.14K
Director Concentration
Rick Glasser: approximately $1.10M in Calculated Team Entry Fee activity.
Other displayed concentrations include Southern Collegiate Sports ($50.48K), Ben Duff ($43.54K), Premier Sports Production FP ($25.31K), DFW Fastpitch ($18.75K), Robert Lee ($15.52K), and additional directors shown in the report.
Director concentration does not establish receipt, compensation, profit, tax treatment, or wrongdoing.
Annual & Sport Trend Analysis
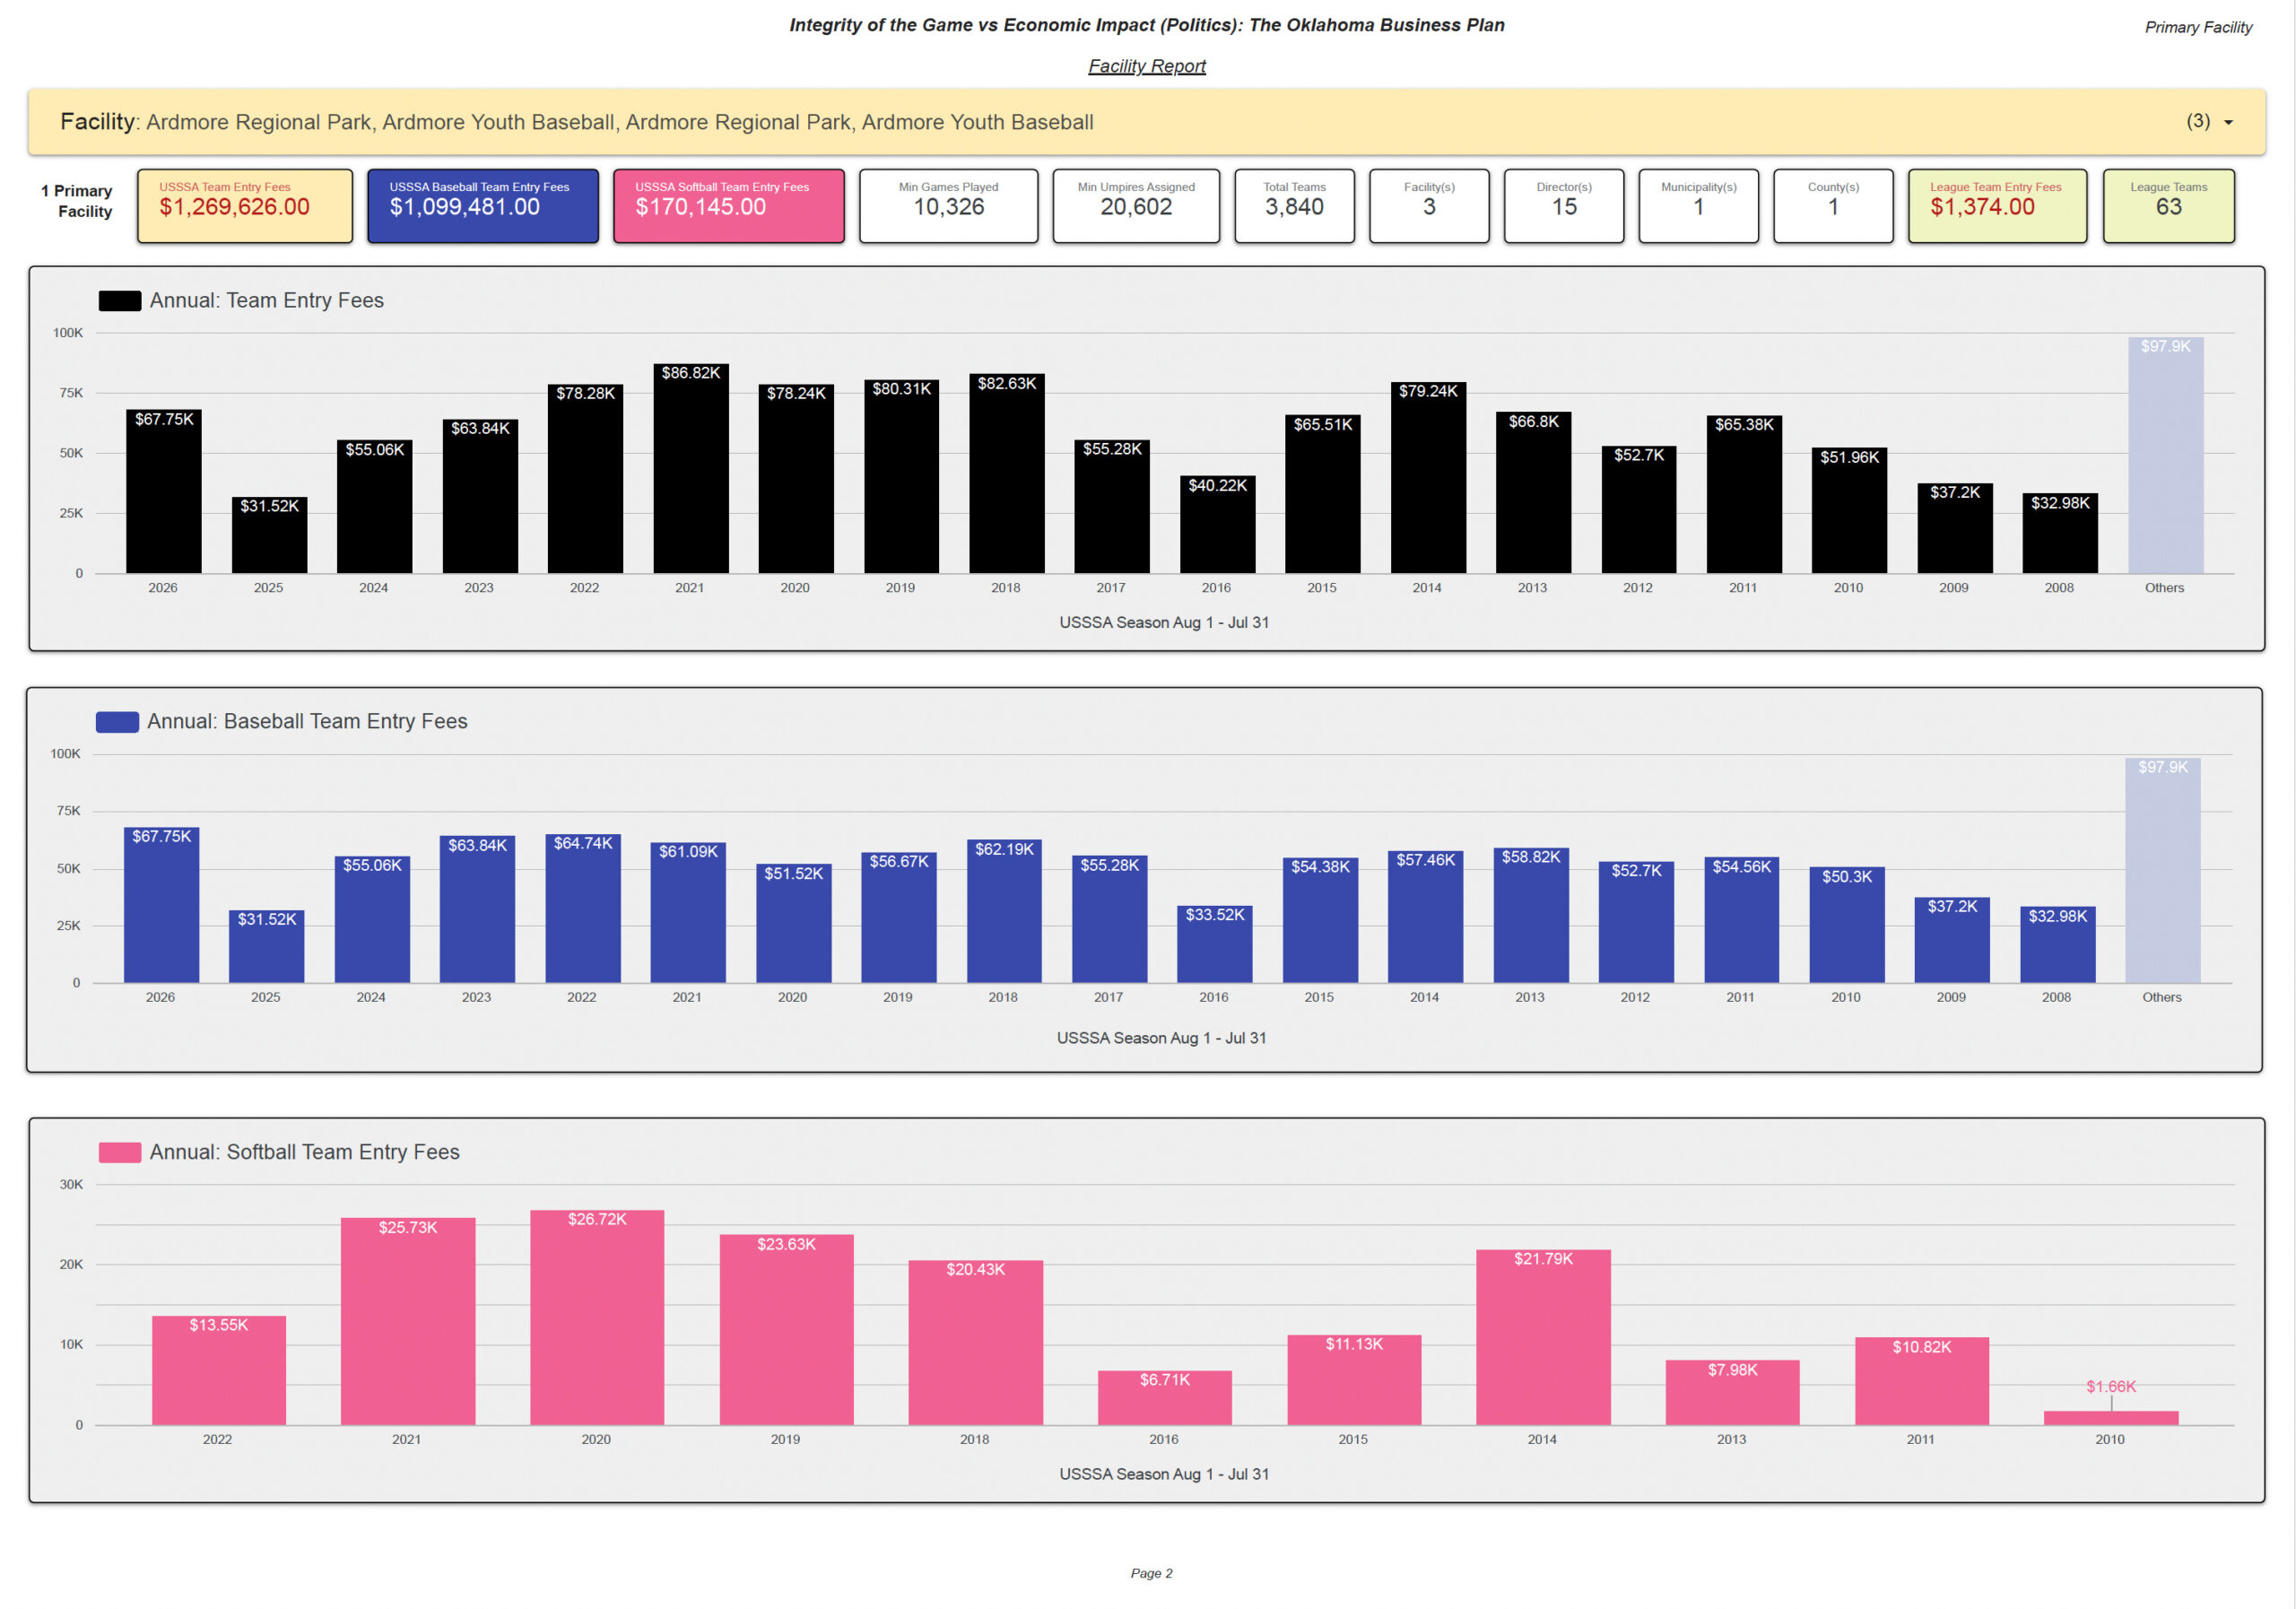
Among individually labeled seasons, 2021 is the highest total season at $86.82K. Baseball's highest individually labeled season is 2022 at $64.74K. Softball peaks at $26.72K in 2020. The report also contains an aggregated “Others” category of $97.90K for total and baseball activity.
| Season | Total Calculated Team Entry Fees | Season | Total Calculated Team Entry Fees |
|---|---|---|---|
| 2026 | $67.75K | 2016 | $40.22K |
| 2025 | $31.52K | 2015 | $65.51K |
| 2024 | $55.06K | 2014 | $79.24K |
| 2023 | $63.84K | 2013 | $66.80K |
| 2022 | $78.28K | 2012 | $52.70K |
| 2021 | $86.82K | 2011 | $65.38K |
| 2020 | $78.24K | 2010 | $51.96K |
| 2019 | $80.31K | 2009 | $37.20K |
| 2018 | $82.63K | 2008 | $32.98K |
| 2017 | $55.28K | Others | $97.90K |
Associated Multi-Facility / Satellite Activity
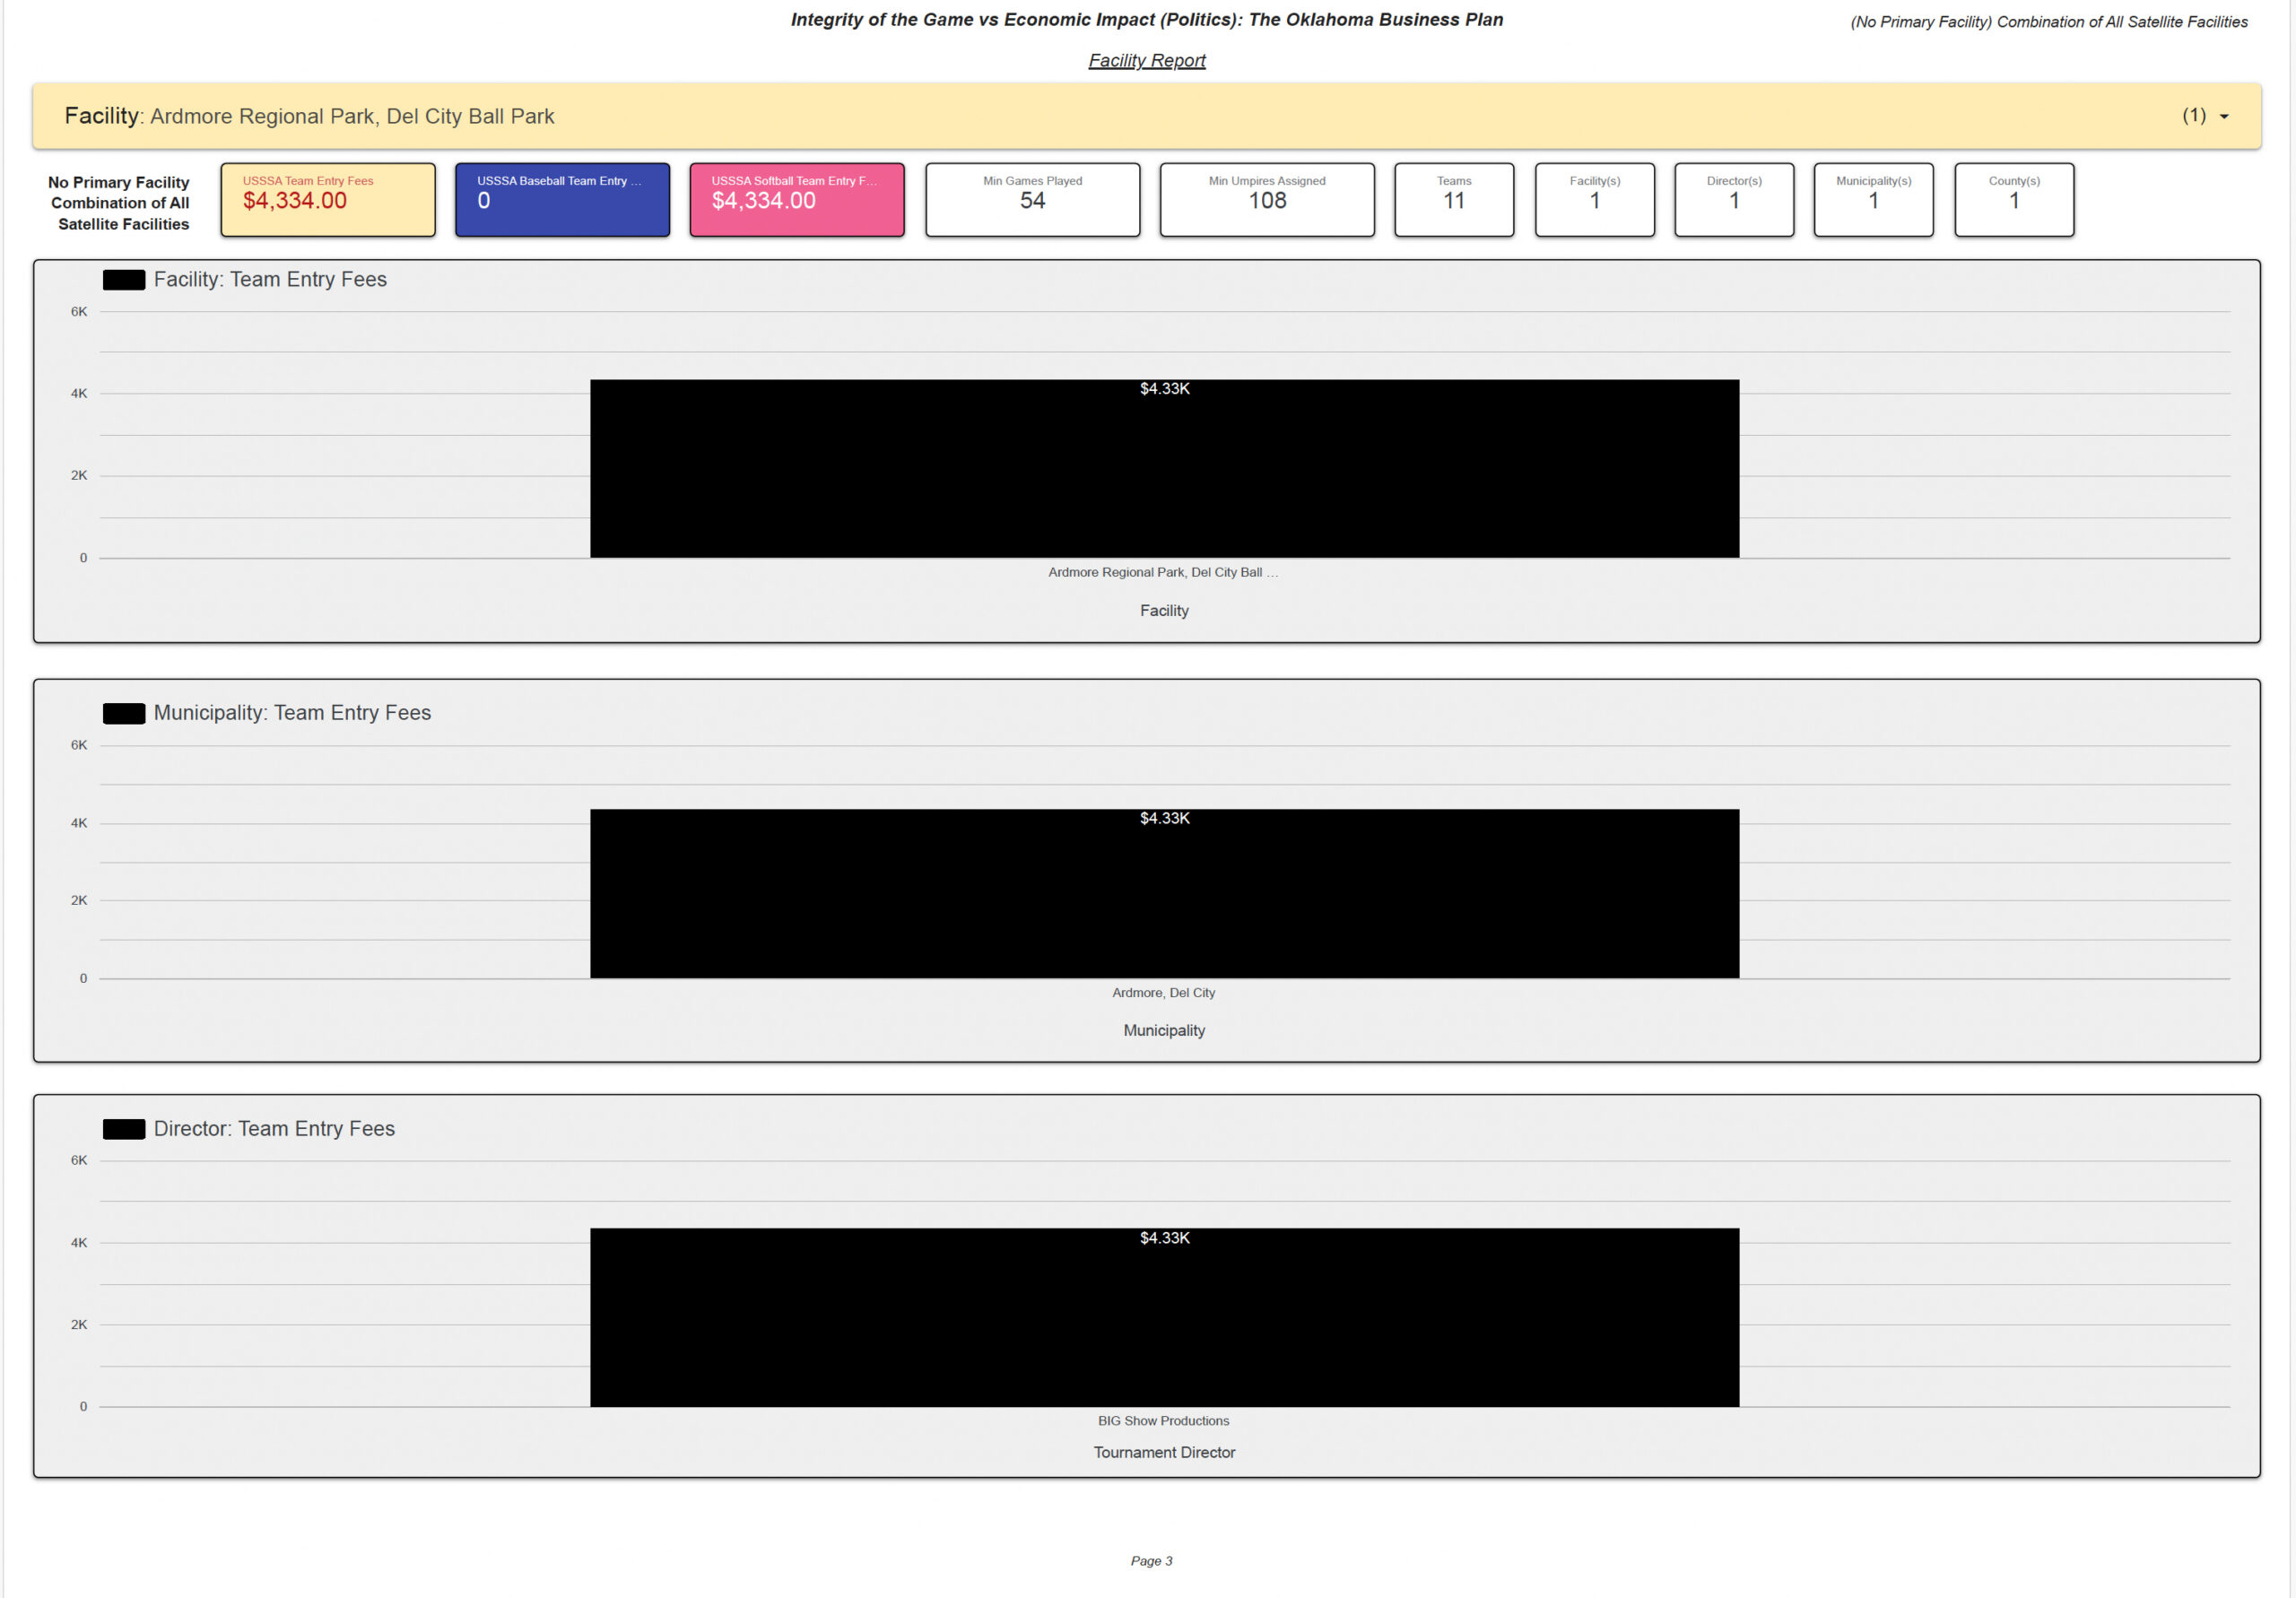
Page 3 excludes the stand-alone Primary Facility population and identifies one associated multi-facility record: Ardmore Regional Park, Del City Ball Park. That record contains $4,334 in Calculated Team Entry Fees, all shown as softball activity, involving 11 teams, 54 minimum games, and 108 minimum umpire assignments. BIG Show Productions is the listed director.
Combined Documented Facility Activity Footprint
Page 4 combines the direct / stand-alone Primary Facility population with the associated multi-facility population. This creates the broadest documented footprint involving the selected facility. It should not be interpreted as a claim that every dollar, team, game, or official represented occurred exclusively at Ardmore Regional Park.
Facility Report
The four report pages below preserve the direct, annual, associated multi-facility, and combined analytical views used throughout this facility profile.
Facility History, Infrastructure & Regional Role
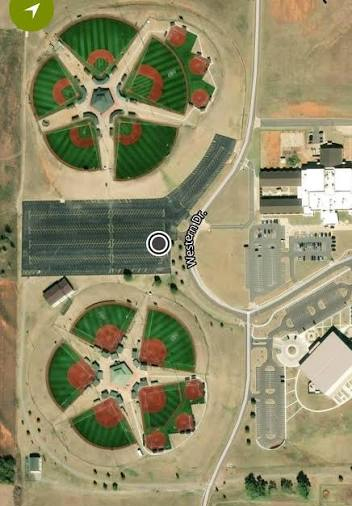
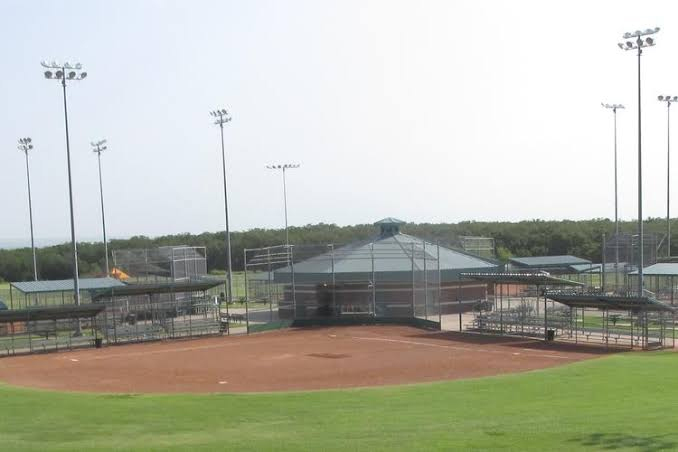
The supplied history describes Ardmore's transition from an earlier professional baseball era toward youth recreation, amateur leagues, and softball centered on Ardmore Regional Park. It identifies eight diamond fields divided into two main baseball and softball complexes and describes the site as a regional draw for collegiate, amateur, USSSA slowpitch, and youth showcase events.
- Eight diamond fields divided between two primary baseball and softball complexes.
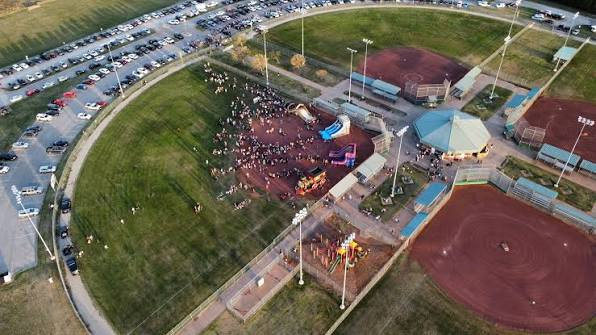
- Artificial turf infields replacing older natural dirt and gravel playing surfaces.
- Digital smartphone-controlled scoreboards installed in September 2023.
- Shade canopies and protective netting added as spectator and safety improvements.
Facility Photo Gallery
Methodology & Evidentiary Limits
Calculated Team Entry Fees = Number of Participating Teams × Publicly Posted Team Entry Fee. The measure is designed to describe documented economic activity associated with public event records. It does not independently establish actual collections, gross receipts, net income, facility revenue, municipal revenue, director compensation, bank deposits, taxable income, gate receipts, concession revenue, umpire compensation, tax liability, or disposition of funds.
Historical source records may contain incomplete information, naming variations, reused or inconsistent identifiers, facility-name changes, zero-dollar listings, missing fields, or records that are later corrected, modified, removed, or become unavailable. Multi-facility events require additional caution because the event-level record may establish facility association without establishing allocation.