
More Than 9,000 Team Entries
The corrected Oklahoma City dashboard indicates approximately 9,300 team entries across the 2001-2026 research period.

This municipality-wide case study examines USSSA baseball and softball activity attributed to Oklahoma City from 2001 through 2026. The research evaluates participation, historical tournament growth, modeled event economics, event-host/director concentration and estimated community economic impact.
Unlike a single-facility study, the current Oklahoma City dataset should be interpreted as a citywide tournament ecosystem until the underlying event records are separated by individual facility.
The corrected Oklahoma City dashboard indicates approximately 9,300 team entries across the 2001-2026 research period.
Modeled team-entry-fee activity is comparatively balanced between baseball and softball, creating a distinctly different profile from some other Oklahoma municipalities.
The duration and financial scale of the activity support deeper research into facilities, public costs, operating structures, tournament access and economic return.
The consolidated dashboard provides a single visual overview of team participation, entry fees, baseball/softball distribution, gates, concessions, umpire activity, event income, event net, economic impact and event-host concentration.
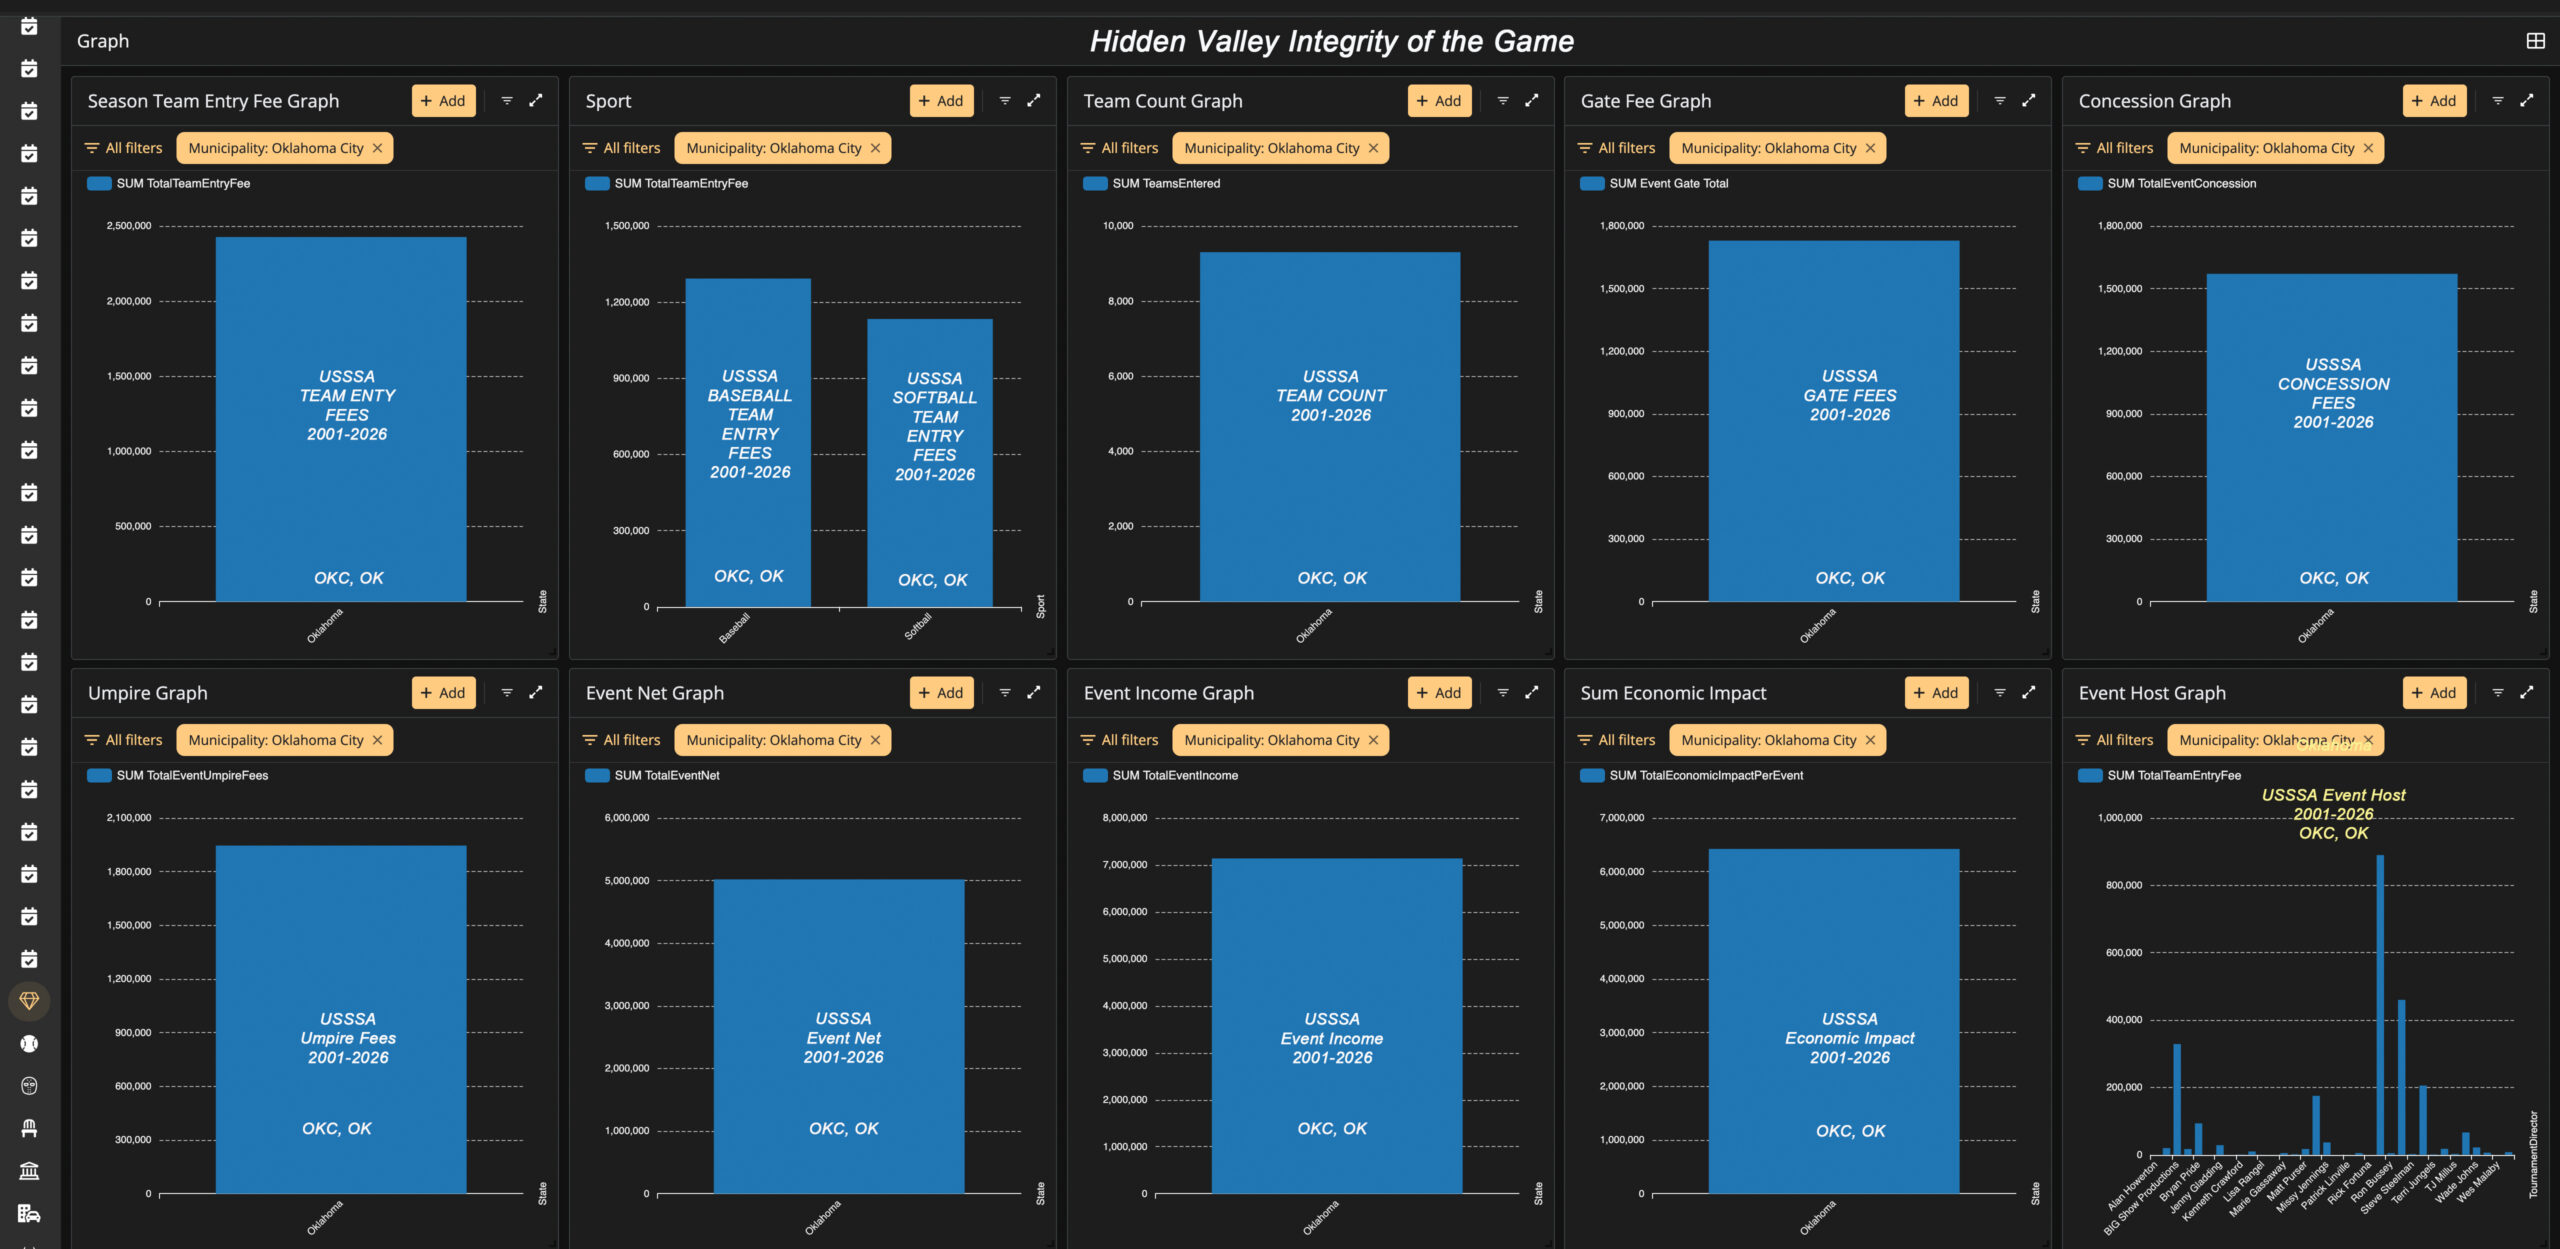
The Oklahoma City Executive Research Summary consolidates the updated municipality-level findings into a publication examining the 2001-2026 historical trend, sport mix, tournament economics, event-host concentration, public-asset implications and methodological limitations.
Oklahoma City's annual team-entry-fee graph is especially valuable because it exposes the historical shape of the tournament economy rather than presenting only a cumulative total.
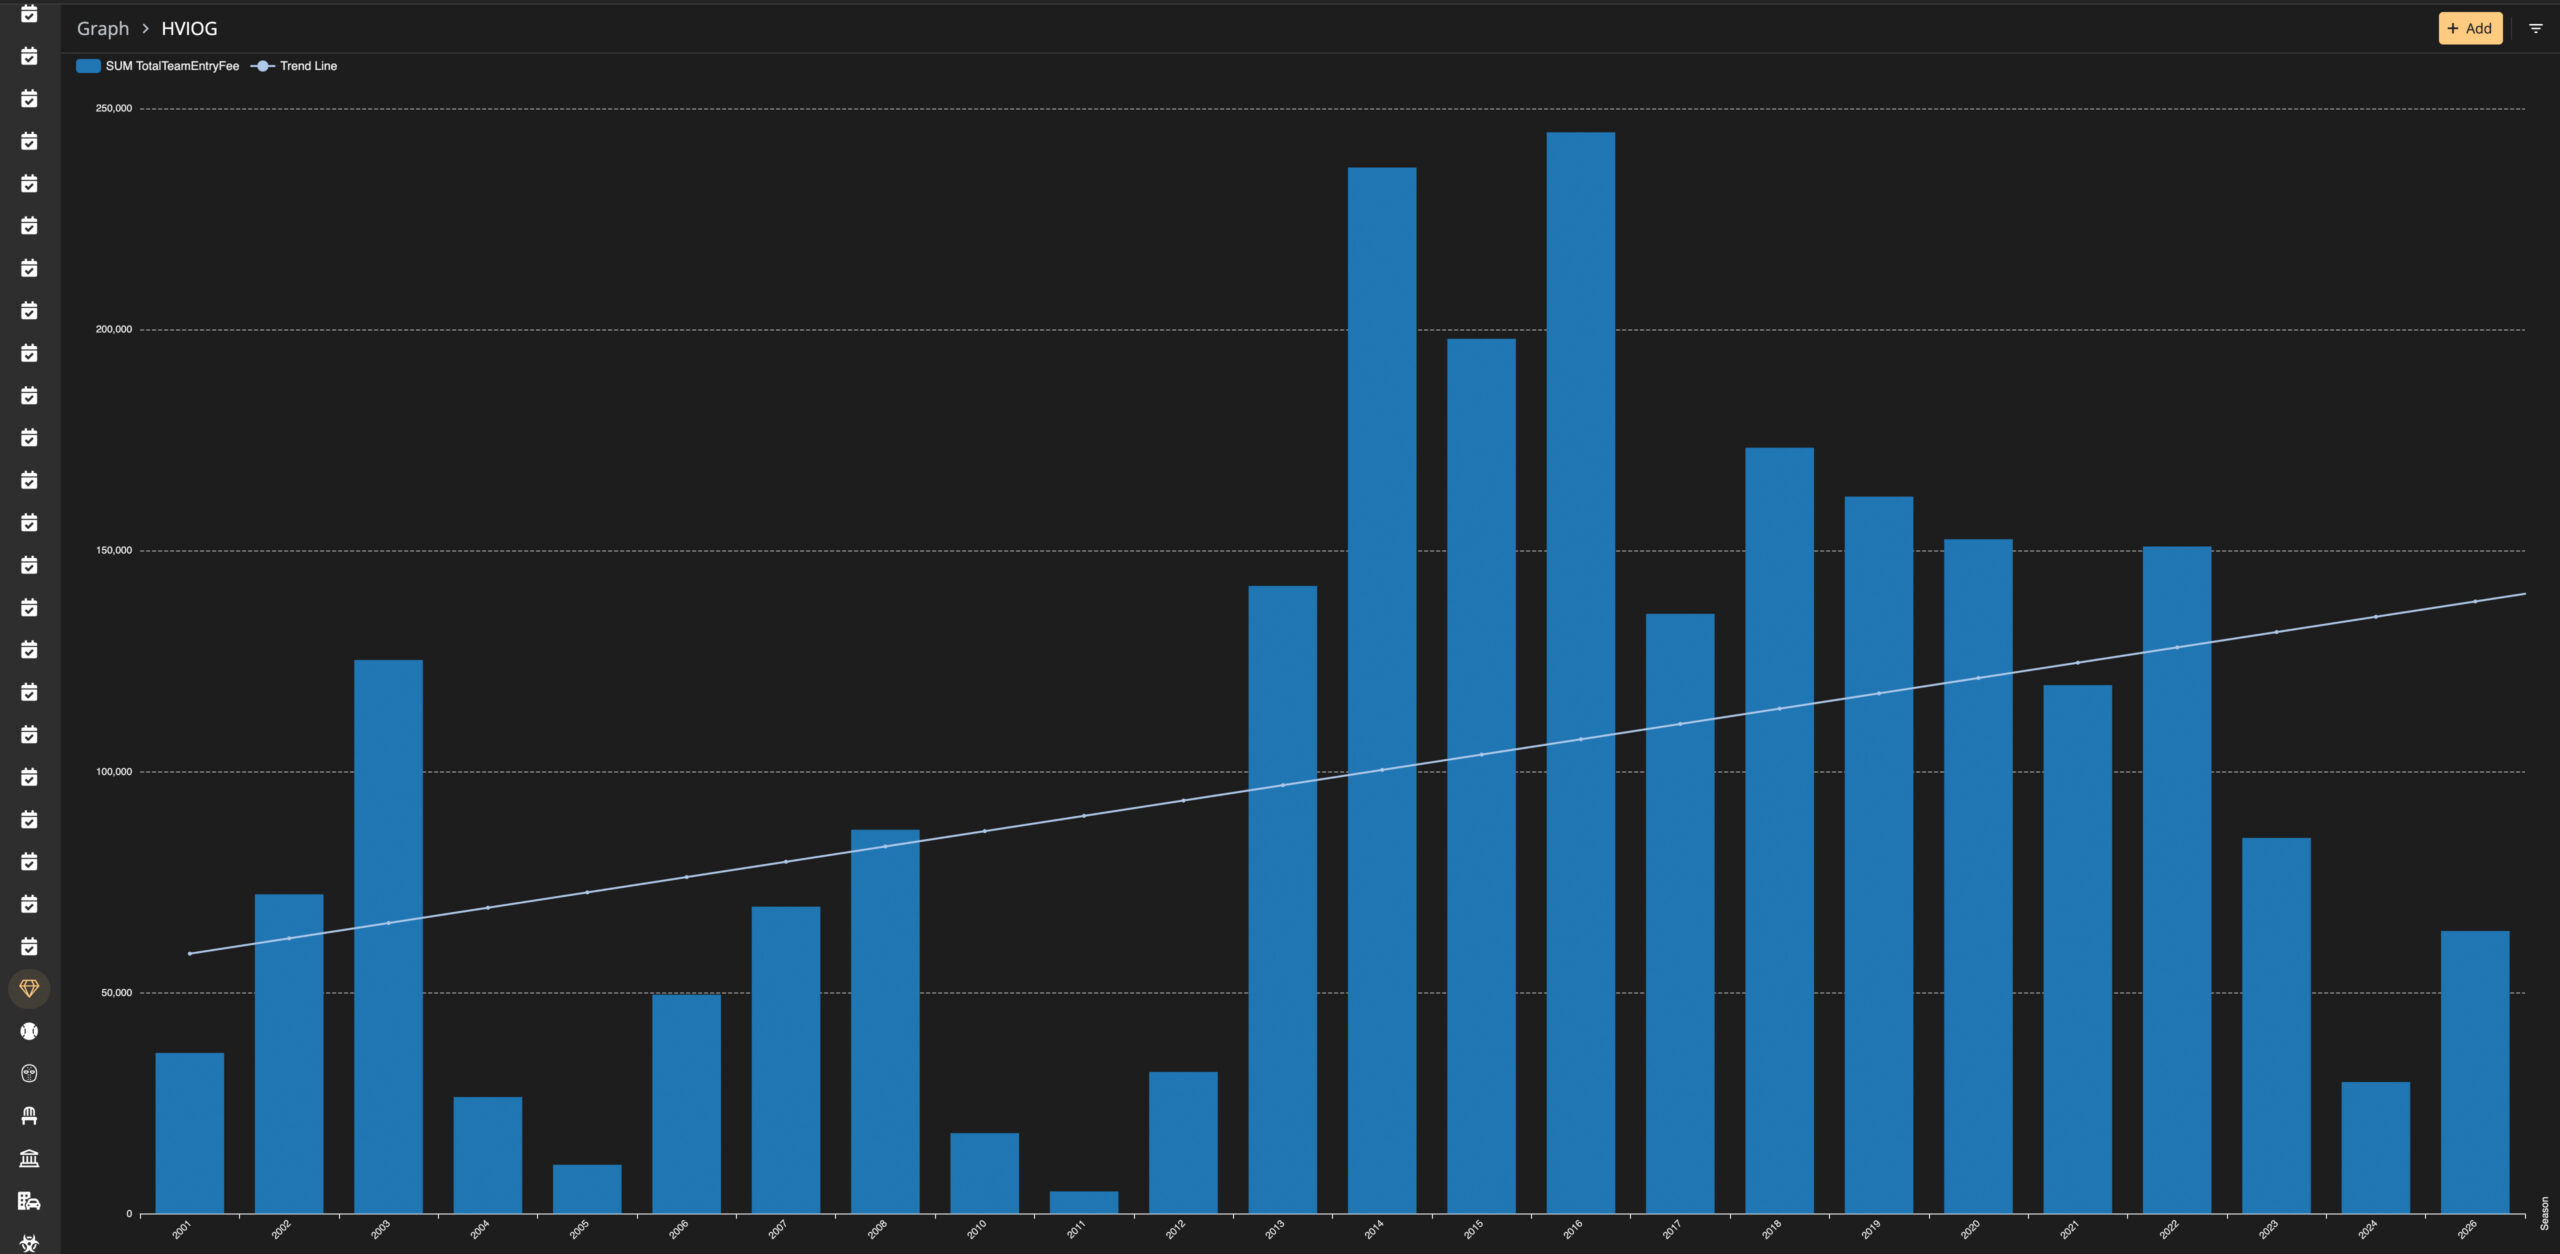
The series shows substantial year-to-year volatility but an overall positive fitted trend across the study period. Relatively modest activity appears in much of the early 2000s before a pronounced increase beginning around 2013.
The strongest period visible in the graph occurs around 2014-2016. Modeled annual activity appears near $235,000 in 2014, approximately $198,000 in 2015 and near $245,000 in 2016. Material activity continues through much of 2017-2022 before declining during 2023-2025.
The pattern supports additional timeline research into facilities, tournament directors, operating relationships, sanctioning structures, market conditions and municipal decisions associated with the different eras.
Early development and significant annual volatility with generally lower activity than the later period.
Rapid expansion and the highest visible annual levels in the series.
Sustained material tournament activity following the mid-2010s peak.
Noticeable contraction relative to the preceding decade, creating a new research question about what changed.
The Oklahoma City dataset reflects substantial participation across both baseball and softball, making the municipality a genuine two-sport tournament market within the Hidden Valley research framework.
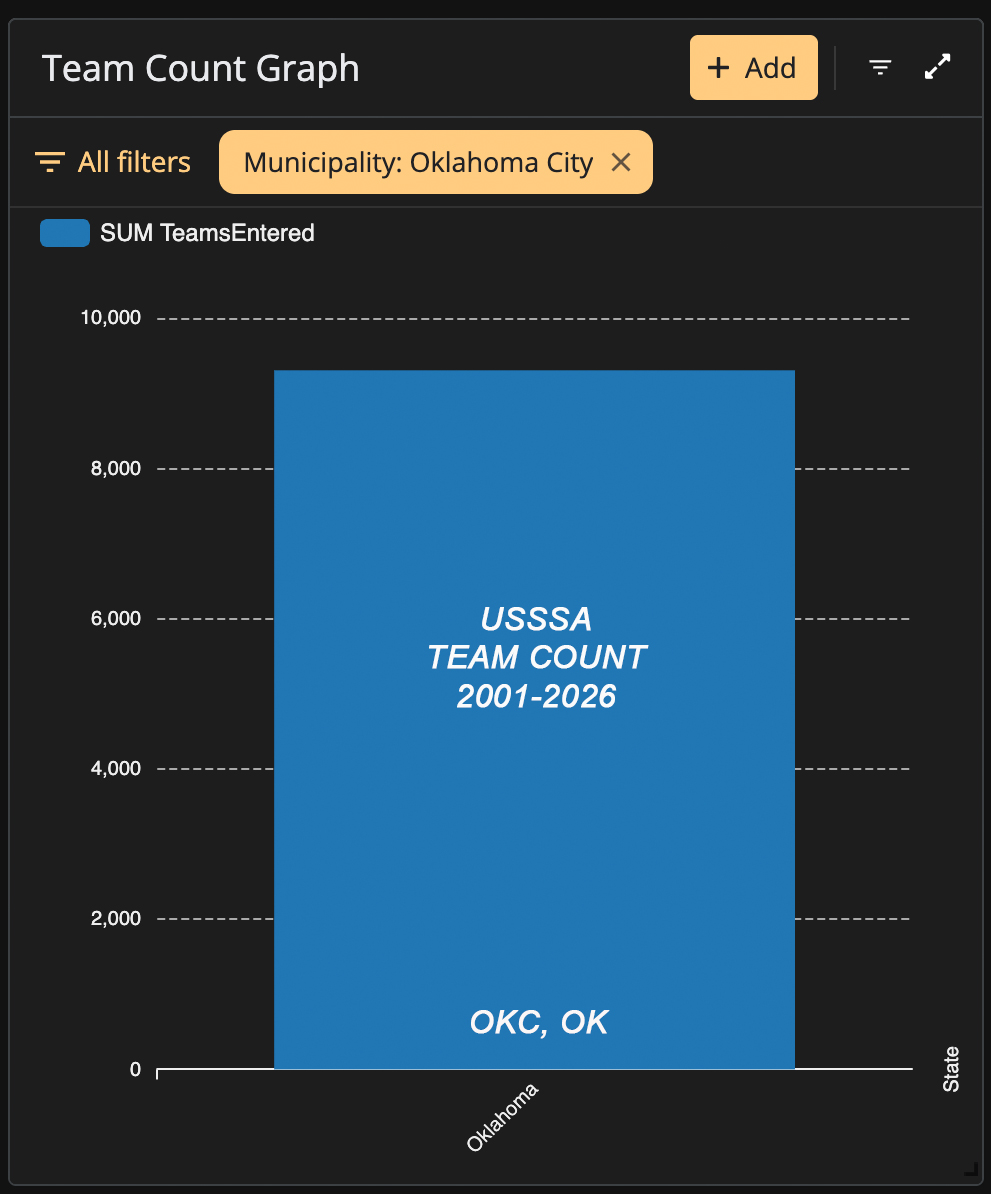
Cumulative team entries attributed to Oklahoma City in the underlying research dataset.
What the Data SuggestsApproximately 9,300 team entries demonstrate long-term, sustained tournament activity.
What It Does Not EstablishTeam entries do not represent 9,300 unique teams because a team may participate in multiple events or seasons.
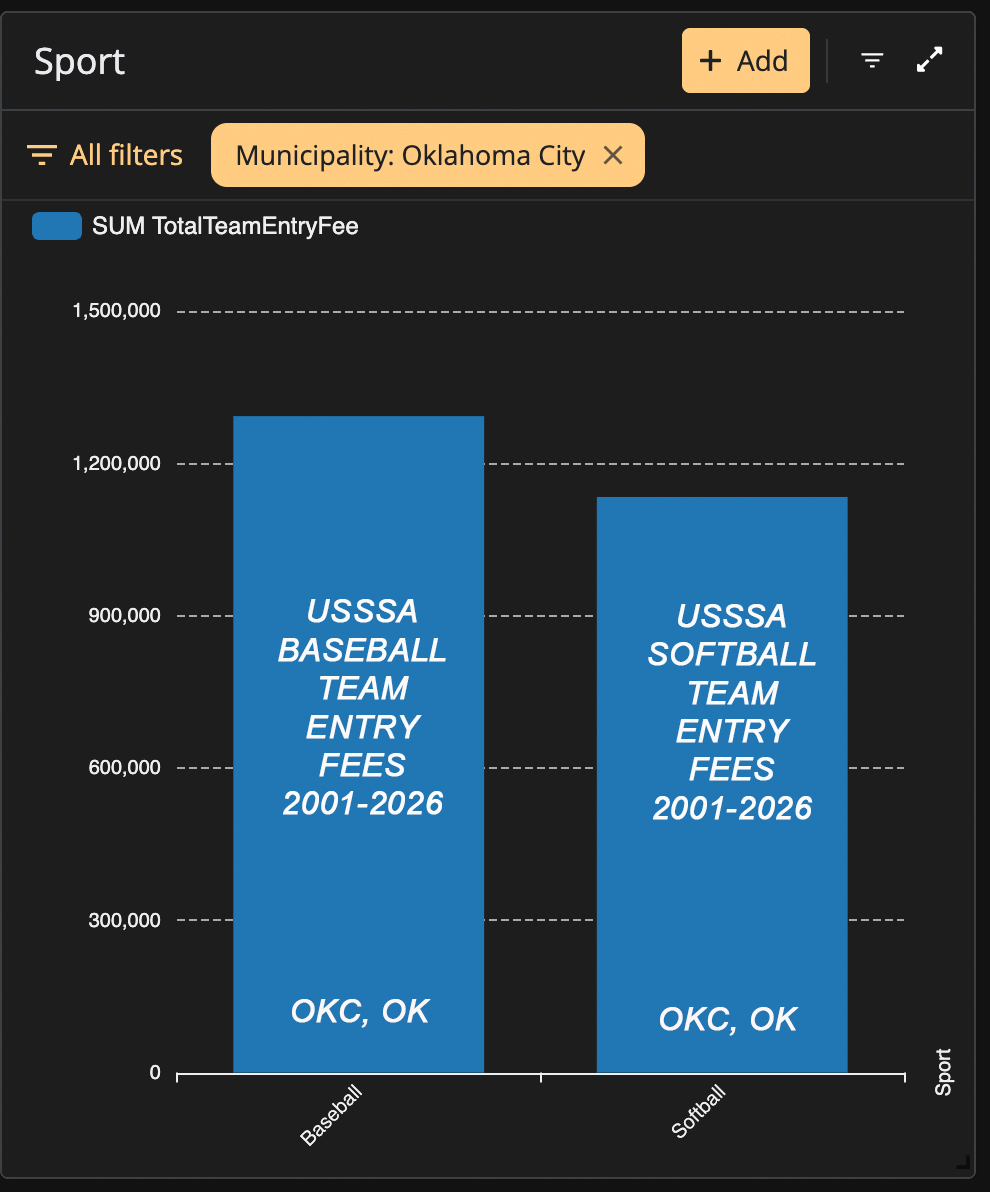
Modeled team-entry-fee activity separated between baseball and softball.
What the Data SuggestsBaseball appears near $1.3M and softball near $1.1M, making the municipality considerably more balanced by sport than some other Hidden Valley case studies.
Why It MattersOklahoma City's historical tournament market should not be evaluated exclusively as either a baseball or softball story.
Entry fees represent only one component of tournament economics. Hidden Valley separately models team-entry activity, gates, concessions and umpire-related activity.
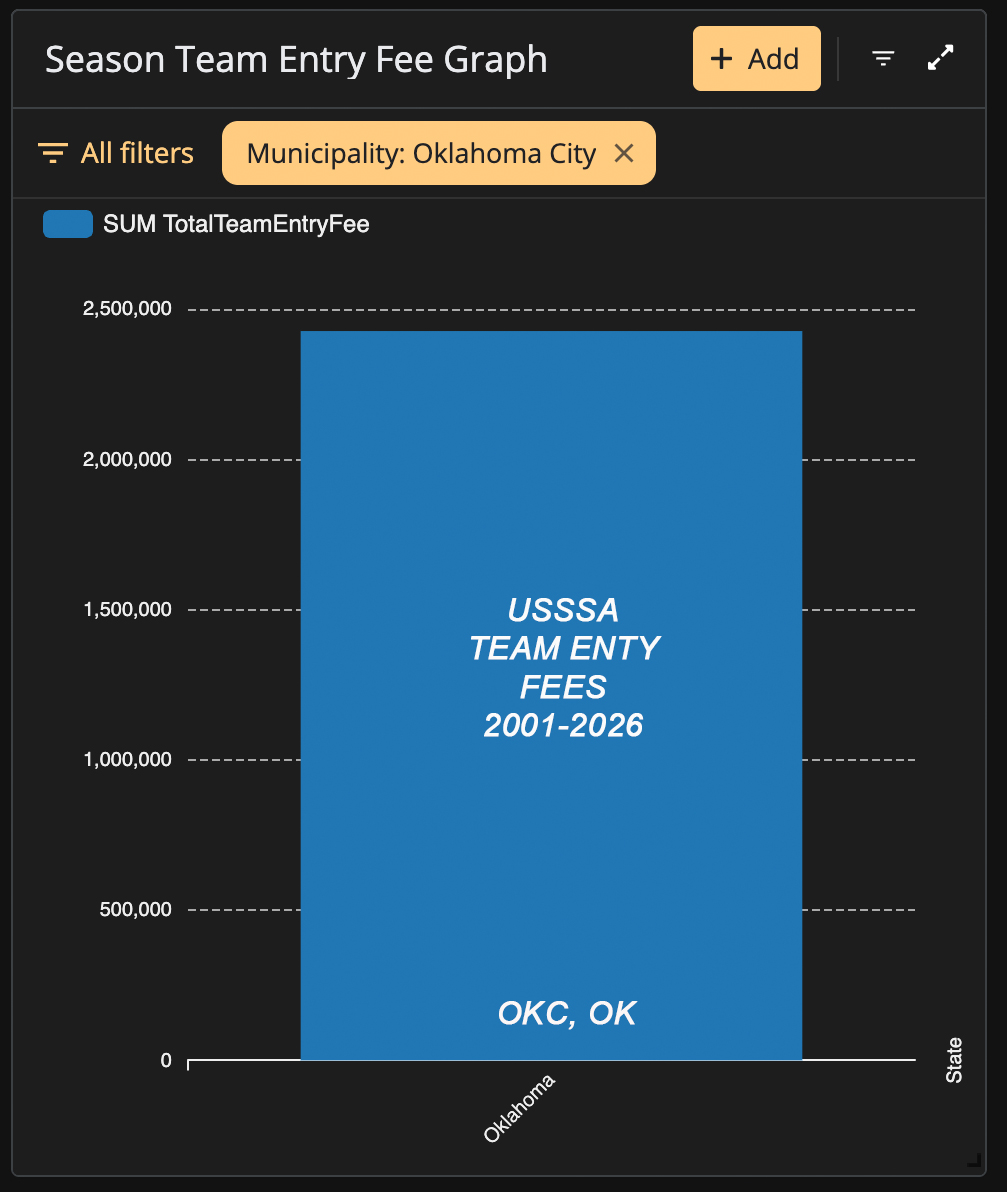
Approximately $2.4M in cumulative team-entry-fee activity.
InterpretationThis represents the participation-fee layer of the tournament model.
LimitationIt should not automatically be represented as audited revenue, retained income or profit of one organization.

Approximately $1.7M in estimated gate activity.
Research QuestionWhich facilities collected gate charges, and what operating agreements governed the collection and distribution of those proceeds?
LimitationThe graphic alone does not establish which entity ultimately received the money.

Approximately $1.6M in estimated concession activity.
Research QuestionWho operated concessions at the relevant facilities, and what agreements determined the disposition of proceeds?
LimitationFacility-level contracts or records are necessary before the modeled amount can be attributed to any specific party.
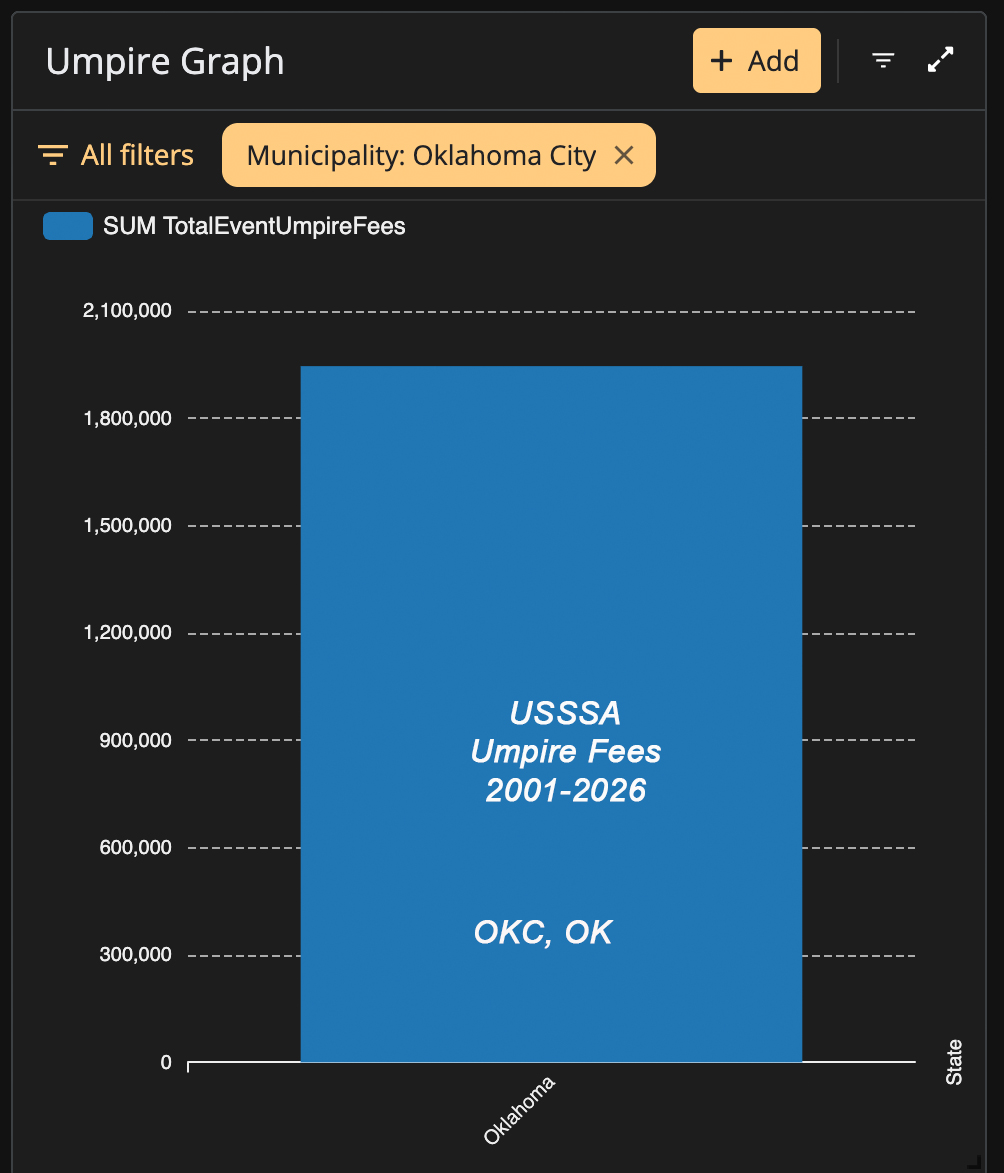
Approximately $1.94M in cumulative umpire-fee activity.
Why It MattersOfficiating represents a substantial tournament operating component that should be considered when evaluating event economics.
LimitationUmpire-fee activity is not equivalent to organizational revenue.
Hidden Valley distinguishes Event Income from Event Net. Both are modeled analytical measures and neither should be characterized as audited profit.

Approximately $7.1M in modeled cumulative event income.
This should be interpreted as a research-model measure and reconciled against underlying financial records before being characterized as exact organizational revenue.
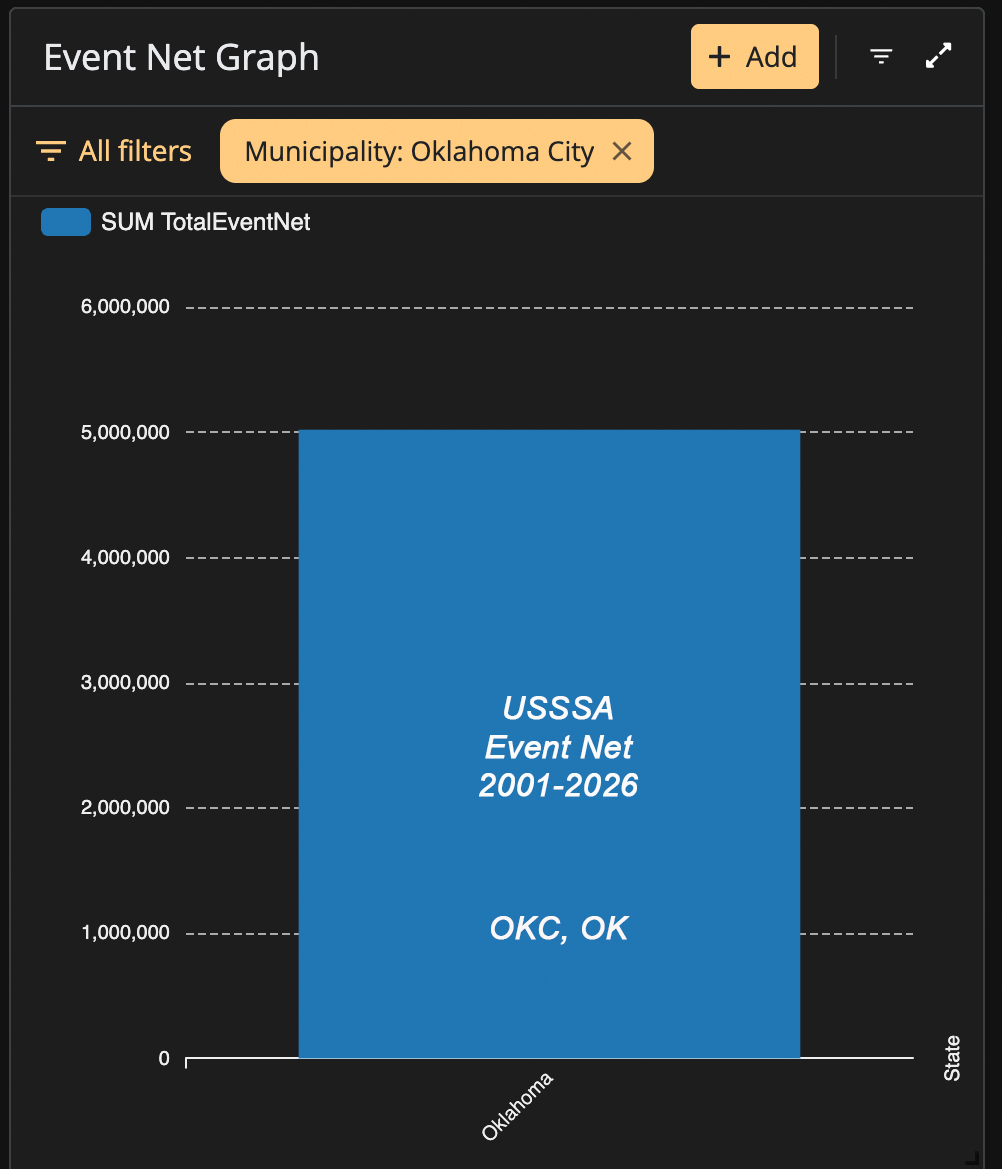
Approximately $5.0M in modeled net event activity.
Event Net is an analytical estimate under the Hidden Valley methodology. It should not be represented as audited net income, organizational profit or personal income.
Tournament activity may create financial effects beyond the event itself through spending by teams, families and visitors in the surrounding economy.
The Oklahoma City Economic Impact graphic indicates approximately $6.4 million in modeled broader economic impact across the research period.
Depending upon the methodology, this type of estimate may incorporate visitor activity involving lodging, restaurants, fuel, retail purchases and related spending.
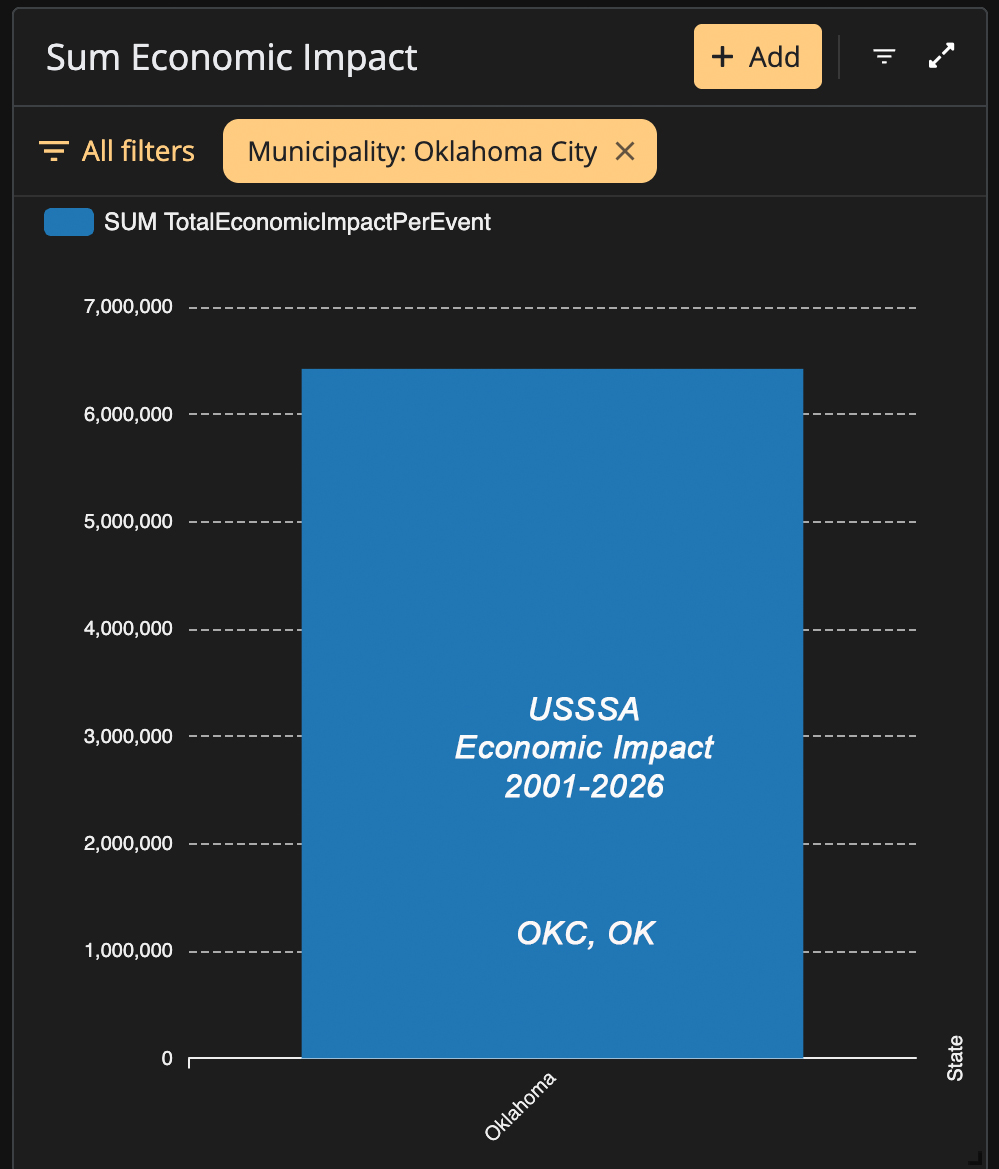
Approximately $6.4M in modeled community economic impact associated with Oklahoma City tournament activity.
The Event Host visualization groups team-entry-fee activity according to the event-host or tournament-director field in the research dataset. The distribution is concentrated rather than uniform.
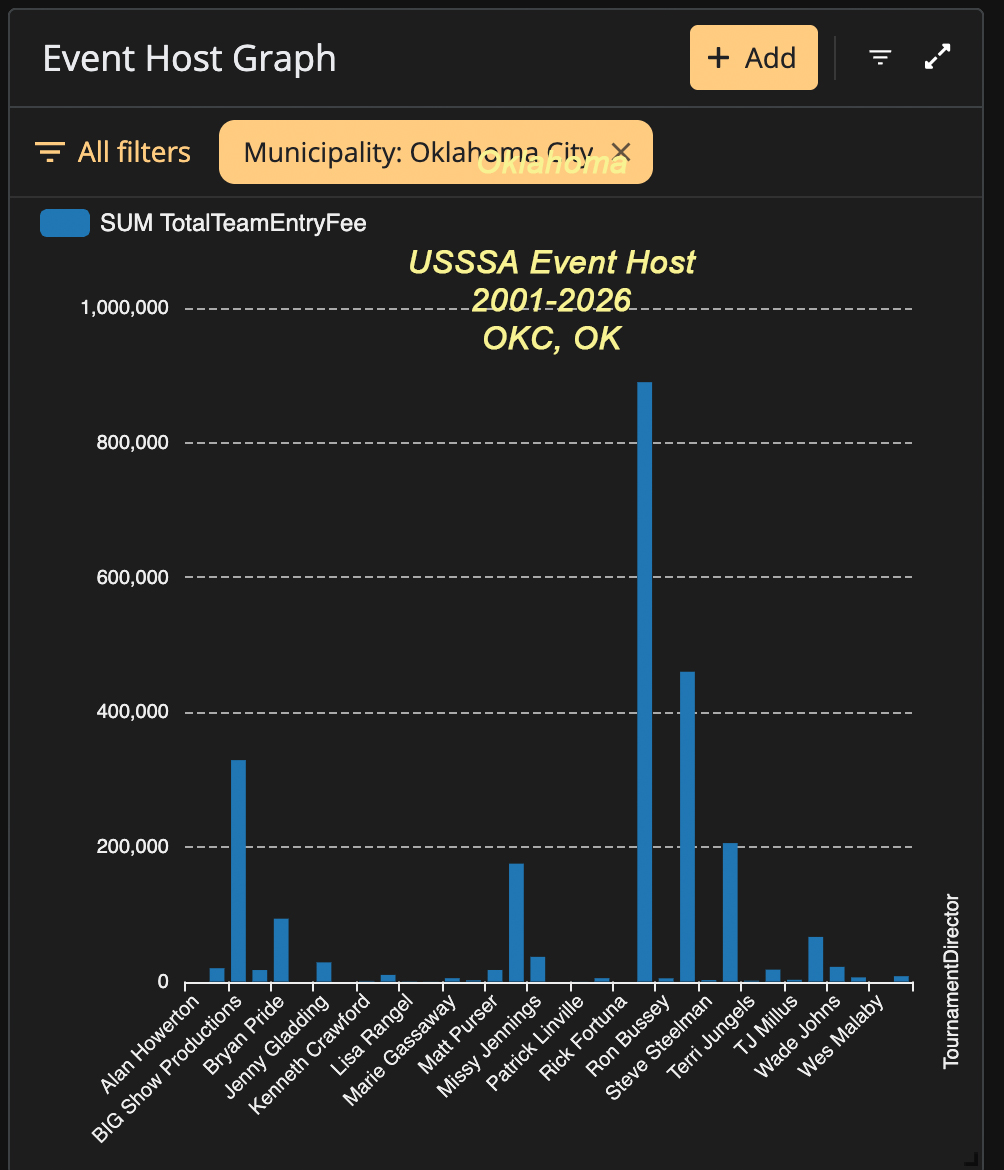
Visually, Ron Bussey appears associated with the largest amount of team-entry-fee activity, at approximately $890,000. Steve Steelman appears near $460,000; BIG Show Productions around $330,000; Terri Jungels around $205,000; and Missy Jennings around $175,000.
Numerous additional hosts/directors appear with smaller cumulative amounts. These approximate values should be reconciled with the underlying dataset before being cited as exact.
Oklahoma City differs from a single-complex case study. The current data establishes municipality-level activity, creating a need to identify the individual facilities and operating arrangements behind that activity.
These are research and public-policy questions. They are not allegations or findings of misconduct.
Hidden Valley distinguishes original records from dataset observations, modeled estimates, analytical interpretation and questions requiring additional investigation.
Public records, tournament listings, contracts, governmental documents and other preserved source evidence.
Patterns, counts, associations and relationships visible within the underlying research dataset.
Calculations derived from participation data, published fee structures and stated methodological assumptions.
Research conclusions drawn from relationships among source records, timelines and dataset observations.
A matter requiring additional records or independent investigation before a definitive conclusion can be reached.
A determination made by a court, auditor, regulator, governmental agency or another authority with appropriate jurisdiction.
Oklahoma City's dataset reflects thousands of team entries and millions of dollars in modeled tournament and community economic activity over approximately a quarter century.
The annual history also reveals distinct periods of development, rapid expansion, sustained tournament activity and later contraction. That history creates a legitimate basis for deeper examination of the individual facilities, operating structures, tournament organizations, public costs and economic-impact claims associated with the municipality.
The dataset does not, standing alone, establish wrongdoing. It establishes that the activity is sufficiently material to warrant transparency, documentation and informed public oversight.
The Oklahoma City case study is one component of Hidden Valley Oklahoma Research. The statewide initiative compares tournament activity, municipalities, facilities, economic estimates and governance structures across Oklahoma.
BaseballHeaven.net and Hidden Valley Oklahoma Research are independent research, educational, commentary and public-interest initiatives. Unless expressly stated otherwise, neither is affiliated with, endorsed by, sponsored by or acting on behalf of the City of Oklahoma City, USSSA, any event host or tournament director, sports facility, sports governing body, nonprofit organization or other entity discussed in this research.
The Oklahoma City graphics used in this study are filtered at the municipality level. Unless supported by underlying event records, the cumulative figures should not be attributed to one particular Oklahoma City sports complex or facility.
Financial and economic figures presented in this research may include analytical estimates derived from tournament records, fee schedules, participation information and stated research assumptions. Unless specifically identified as audited data, such estimates should not be represented as verified revenue, profit, taxable income, tax liability or audited financial information.
Financial activity associated with an identified event host or tournament director represents tournament activity attributed through the corresponding field in the underlying dataset. Such amounts do not establish that an individual personally received, retained or earned the associated amount.
Publication of a discrepancy, question, estimate, complaint, allegation, lawsuit, protest, public record or investigative lead is not proof that an individual or organization violated a law, regulation, policy, contract or ethical obligation.
Conclusions regarding unlawful conduct, fraud, misappropriation, tax liability, contractual violations or other misconduct require appropriate supporting evidence and, where applicable, determination by a competent authority.
Modeled community economic impact is analytically different from tournament event income. Economic-impact estimates may reflect visitor spending or other broader community activity and should not automatically be characterized as money received by a sports organization, event director, facility operator or municipality.
Hidden Valley Oklahoma Research is a continuing initiative. Additional facility-level records, public documents, corrections or reliable evidence may clarify, supplement or change earlier interpretations. Research materials may therefore be revised when additional evidence becomes available.
Individuals, organizations and governmental entities discussed in this research are encouraged to provide relevant records, factual corrections, clarifications or substantive responses when they believe published material is incomplete or inaccurate.
Nothing published through Baseball Heaven or Hidden Valley Oklahoma Research constitutes legal, tax, accounting, investment or other professional advice. Readers requiring such advice should consult an appropriately licensed professional.
The purpose of this research is to document matters of public interest, preserve relevant evidence, encourage transparency, improve governance, promote responsible stewardship of public resources and support informed discussion concerning youth sports and publicly supported athletic facilities.
Readers are encouraged to examine the underlying evidence, evaluate the methodology and reach their own conclusions.