Hidden Valley Integrity of the Game

Hidden Valley Oklahoma Research • HVIOG

Oklahoma USSSA Baseball & Softball • 2001–2026

Statewide Tournament Participation, Estimated Financial Activity, Sports Tourism and Event-Host Research

A twenty-six-year examination of Oklahoma USSSA baseball and softball tournament activity using the Hidden Valley Oklahoma Research dataset and AppSheet analytical framework.

Explore the Research
!
Research classification and financial-estimate notice: Hidden Valley Oklahoma Research combines observed event and team-registration information with modeled calculations. Estimated gate fees, concession activity, umpire compensation, event net, event income and economic-impact values should not be interpreted as audited financial statements or official accounting records of USSSA, municipalities, sports complexes, tournament directors or other organizations.
Statewide Executive Overview

Twenty-Six Years of Oklahoma Tournament Sports

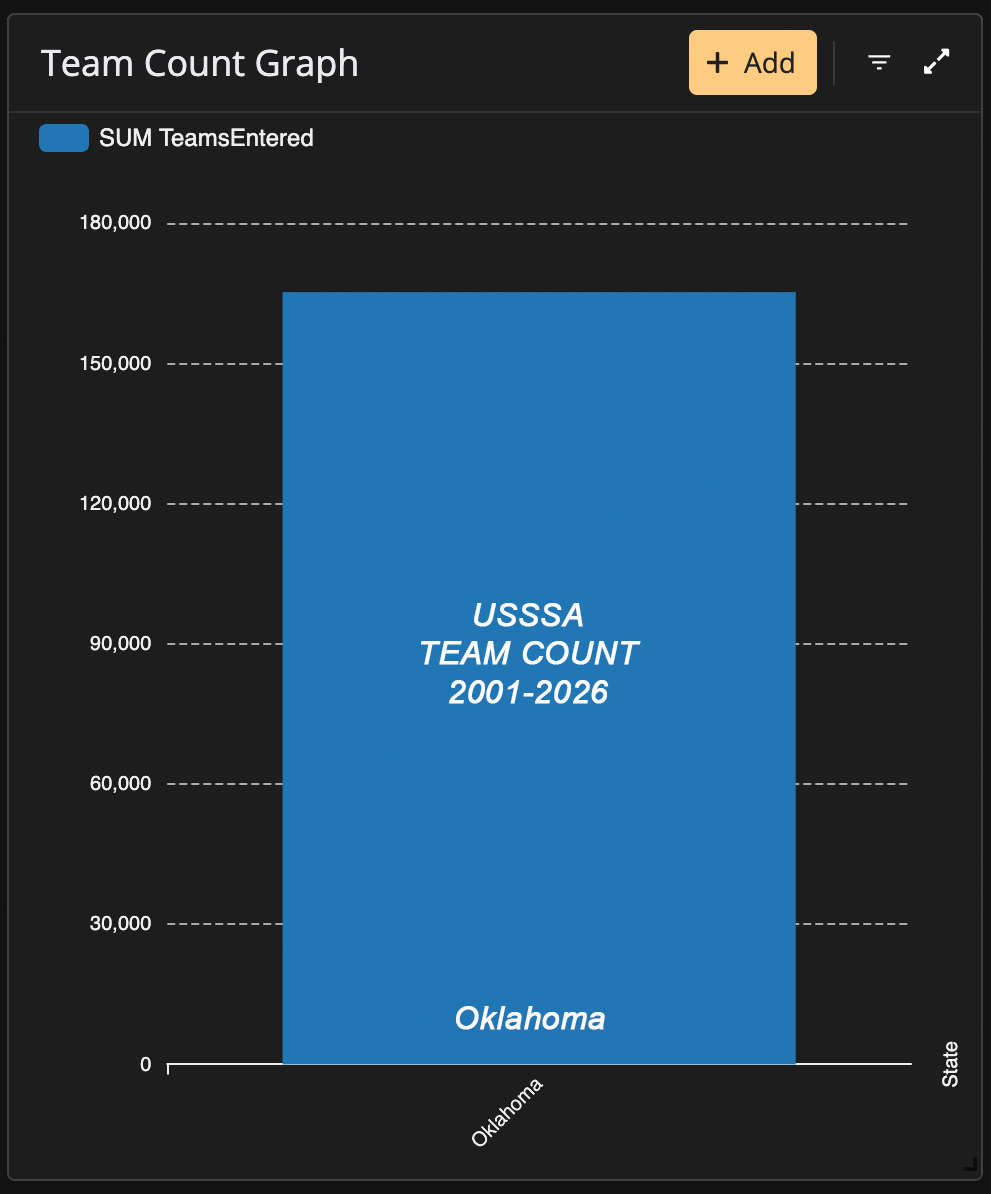
The Hidden Valley Oklahoma Research dataset portrays a statewide youth-sports system that expanded considerably between 2001 and 2026. The research indicates approximately 166,000 recorded team entries and more than $36 million in estimated team-entry-fee activity, alongside additional modeled categories representing admissions, concessions, umpire compensation, event income and secondary economic activity.

1

Sustained Long-Term Growth

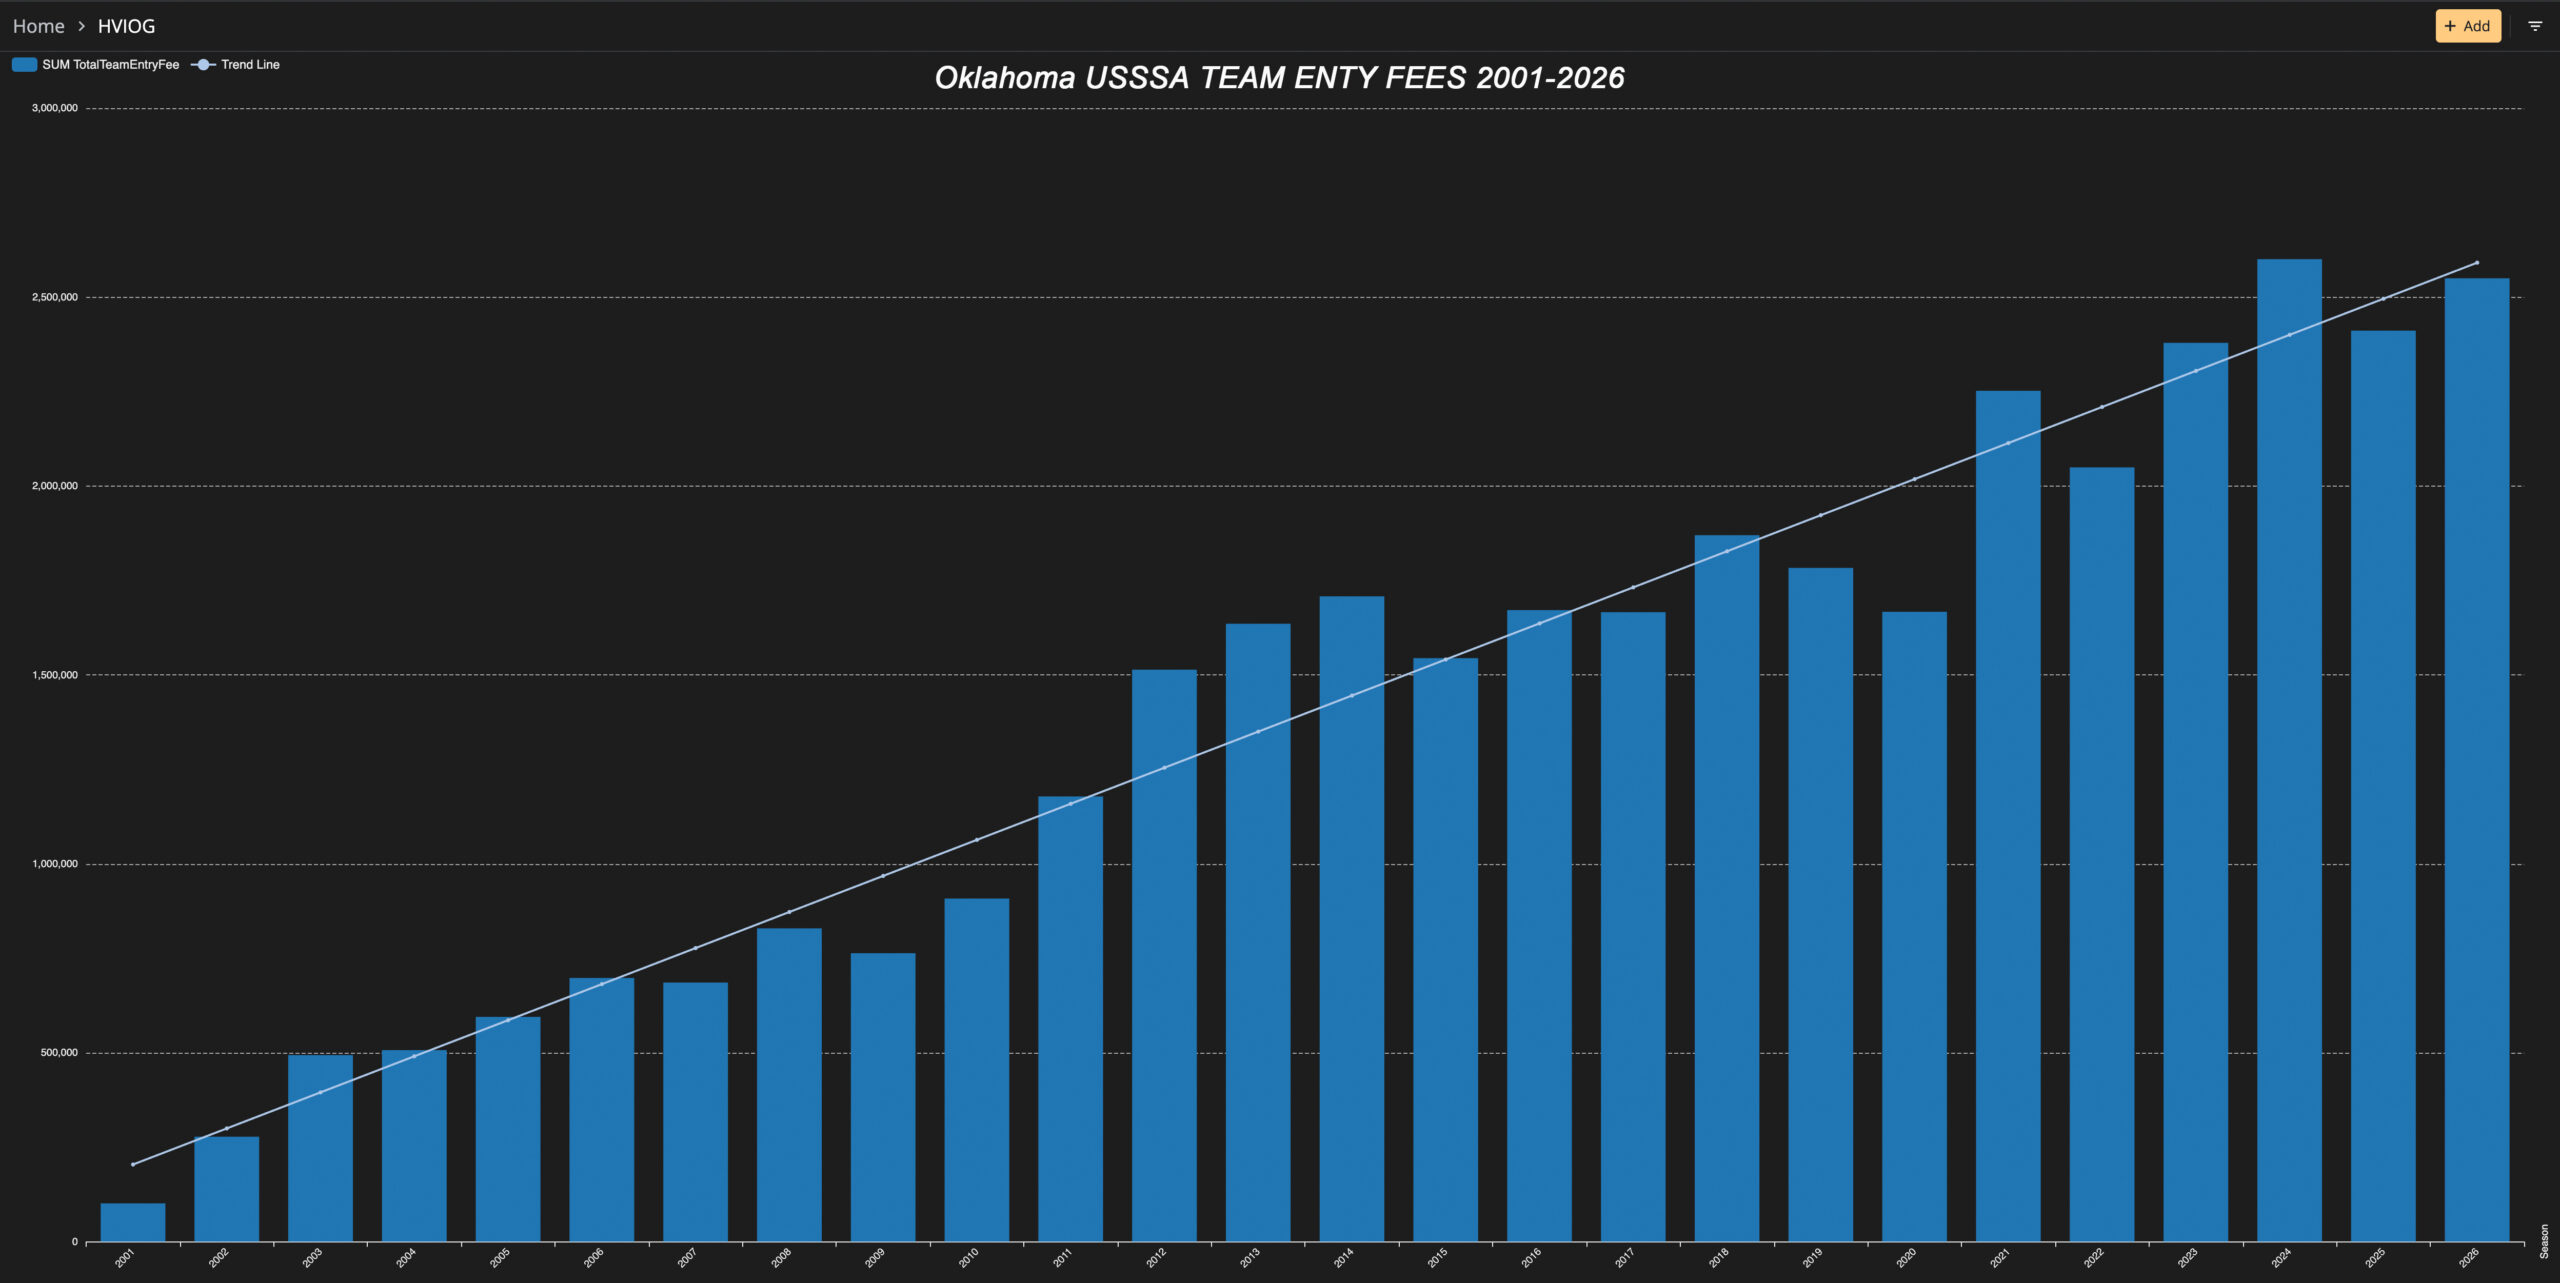
The annual entry-fee graph shows a pronounced upward trend across the twenty-six-year period.

  • Early expansion during the 2000s
  • Acceleration beginning around 2010–2012
  • High activity throughout the late 2010s
  • Temporary reduction during 2020
  • Strong post-pandemic recovery
  • Historically high levels during recent seasons
2

Large Statewide Financial Ecosystem

Tournament economics extend far beyond registration payments.

  • Approximately $36M in team entry fees
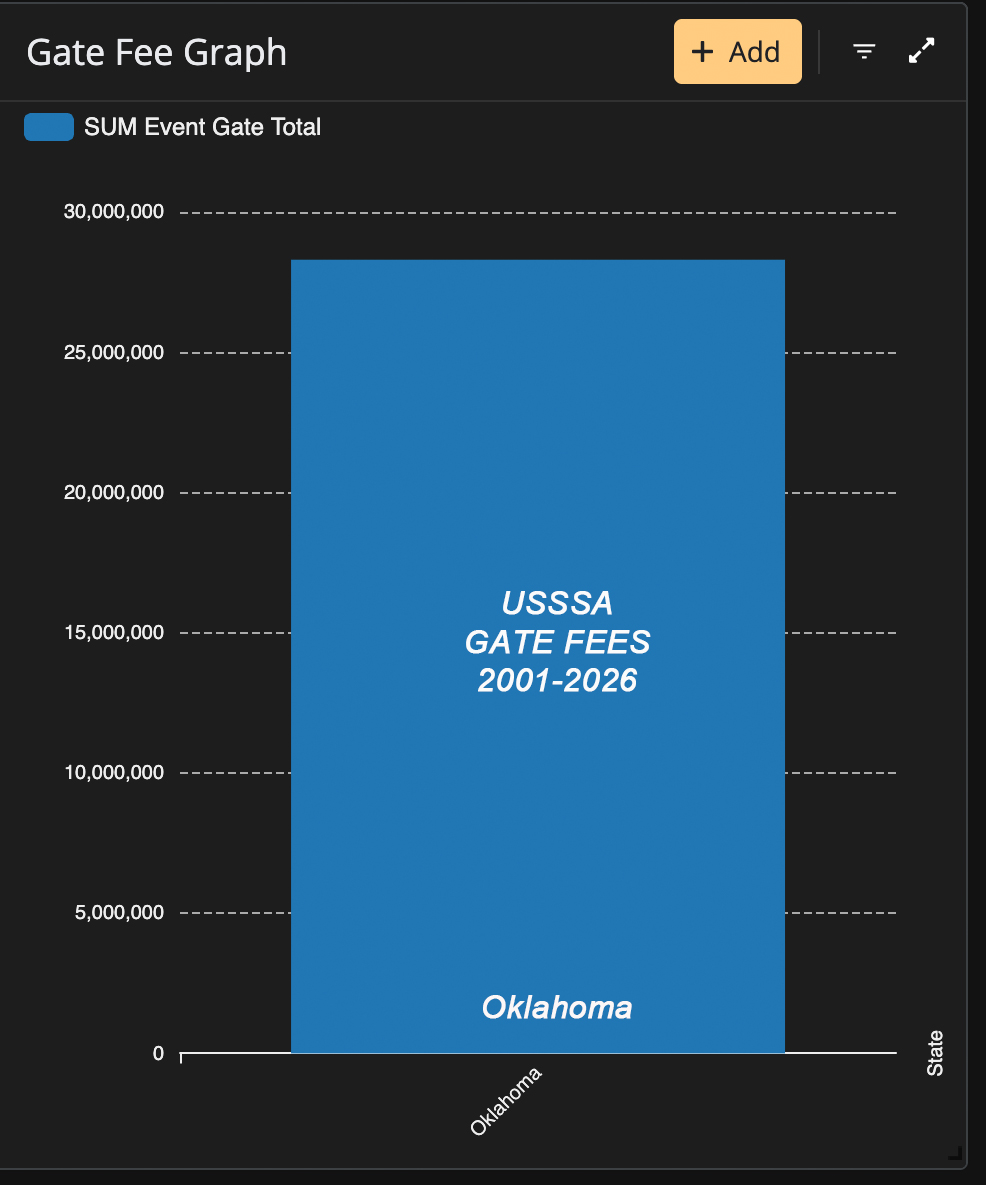
  • Approximately $28M in modeled gate activity
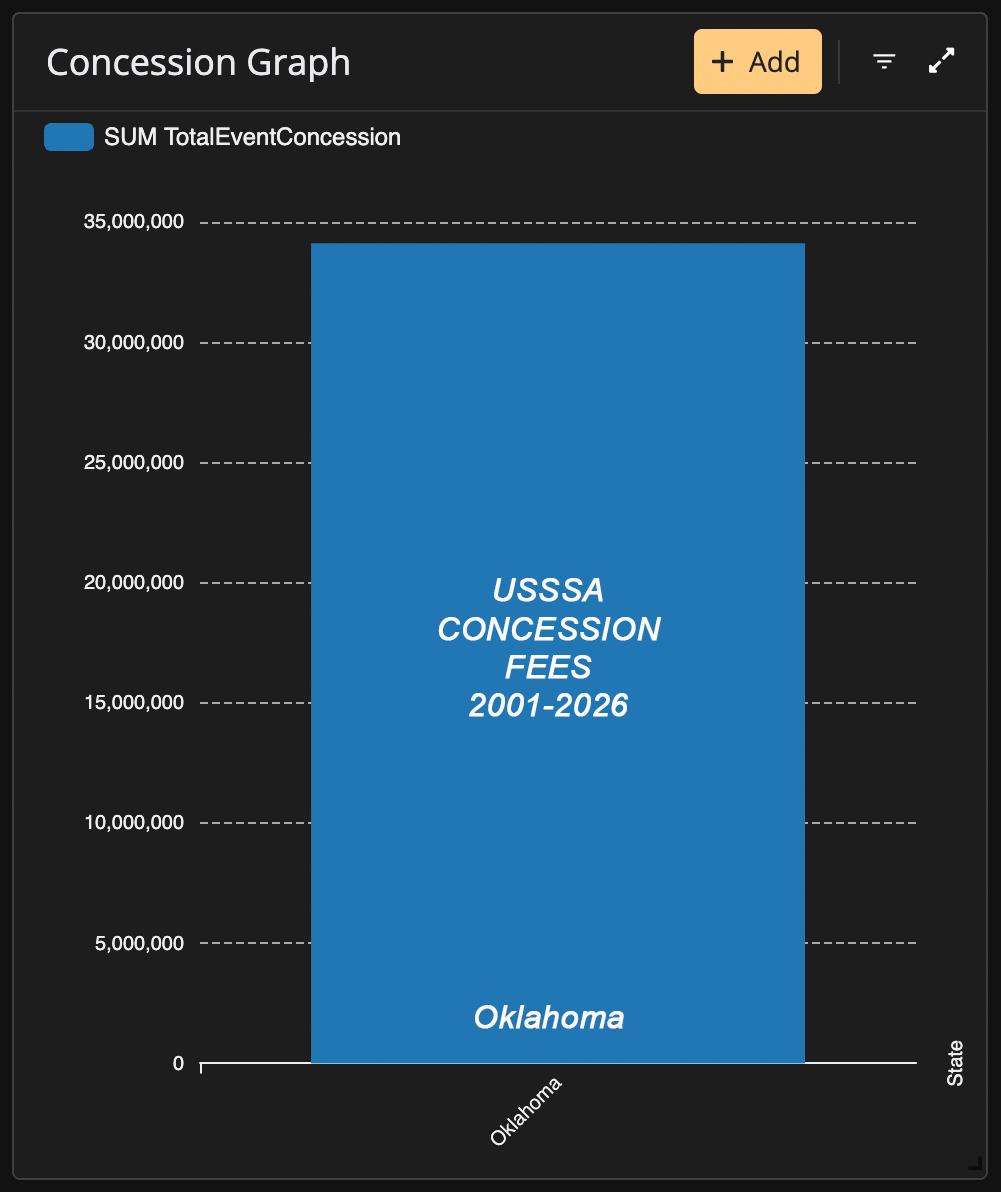
  • Approximately $34M in modeled concessions
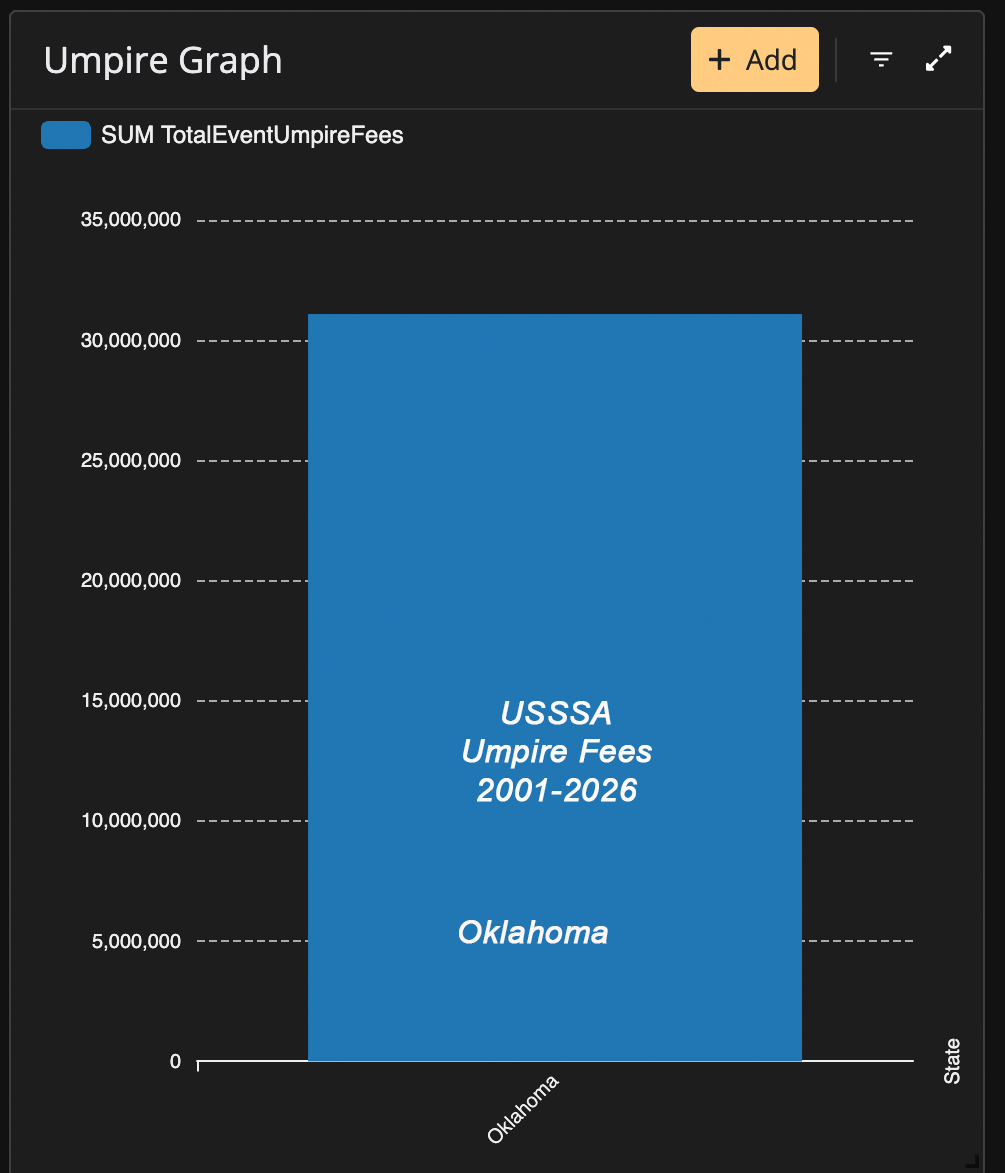
  • Approximately $31M in modeled umpire compensation
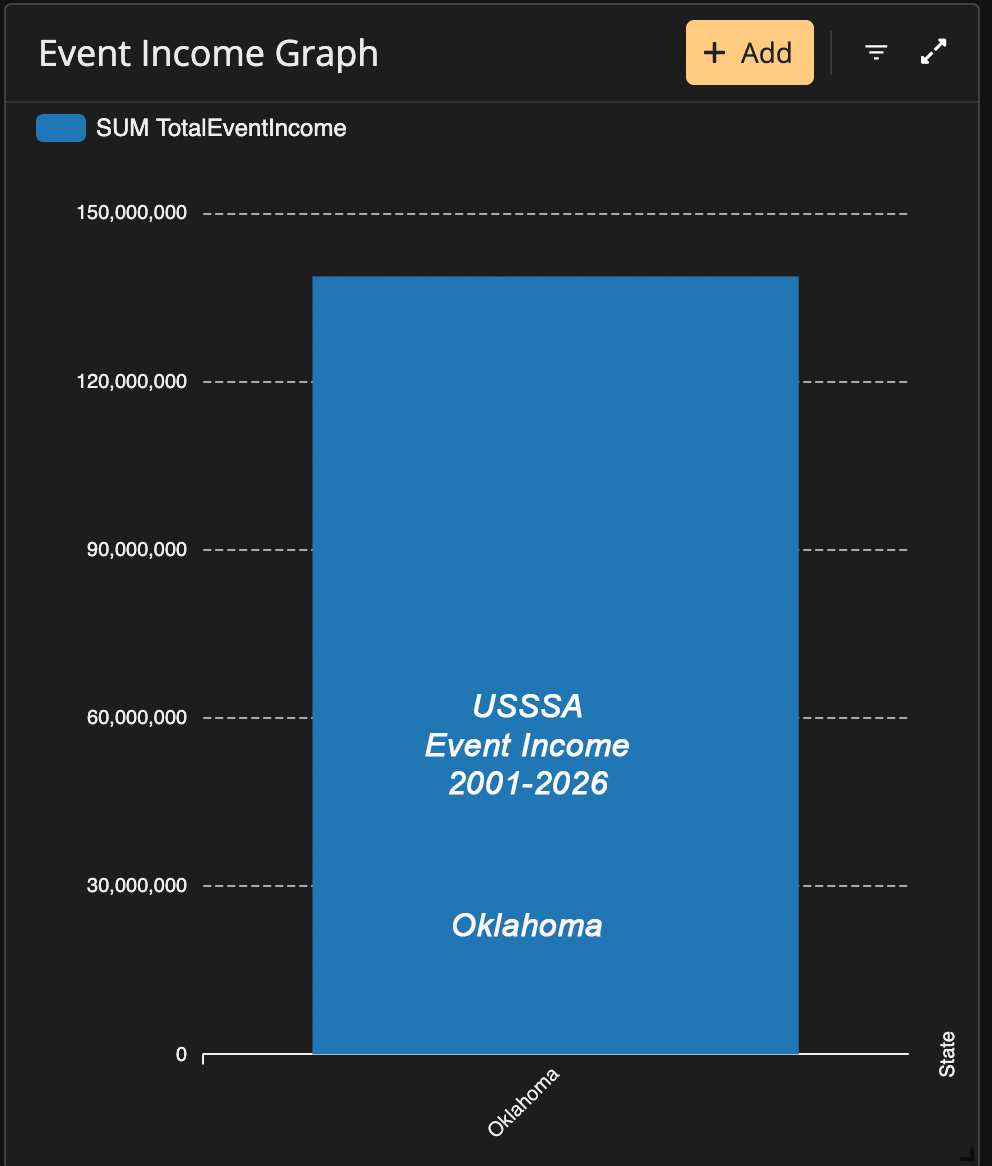
  • Approximately $139M in modeled event income
3

Public-Policy Relevance

The financial scale of youth tournament sports makes facility governance, scheduling, public-private arrangements and community benefits legitimate subjects of continuing research.

  • Municipal facility utilization
  • Sports-tourism development
  • Event-host concentration
  • Public investment
  • Revenue transparency
  • Community economic benefit
Statewide Research Dashboard

Estimated Scale of Oklahoma USSSA Activity

Rounded values below are derived from the supplied Hidden Valley AppSheet graphics. They provide a statewide analytical overview and should be distinguished from audited accounting totals.

T
≈166,000
Registered Team Entries
$
≈$36M
Team Entry Fees
G
≈$28M
Modeled Gate Fees
C
≈$34M
Modeled Concessions
U
≈$31M
Modeled Umpire Compensation
N
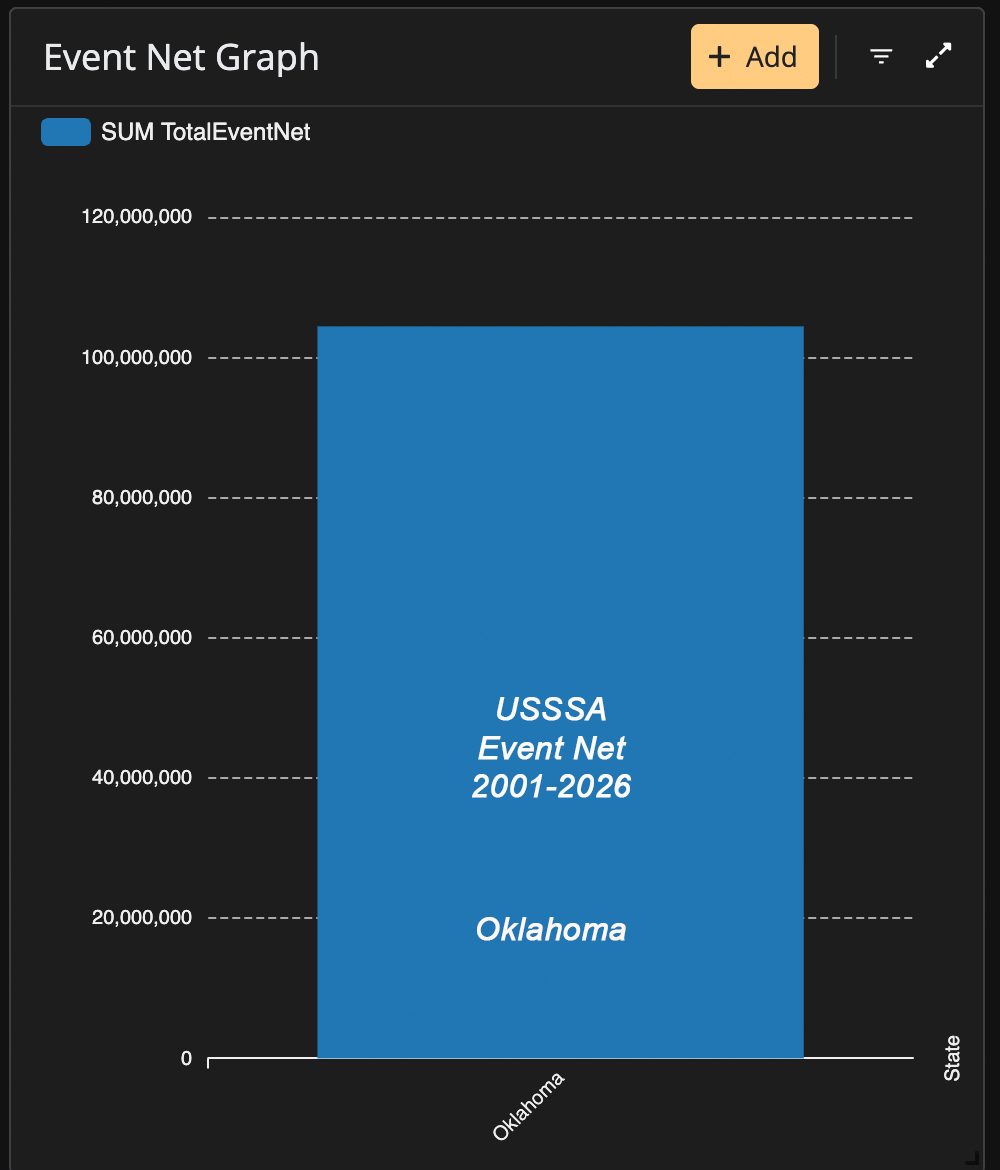
≈$104M
Estimated Event Net
I
≈$139M
Estimated Event Income
E
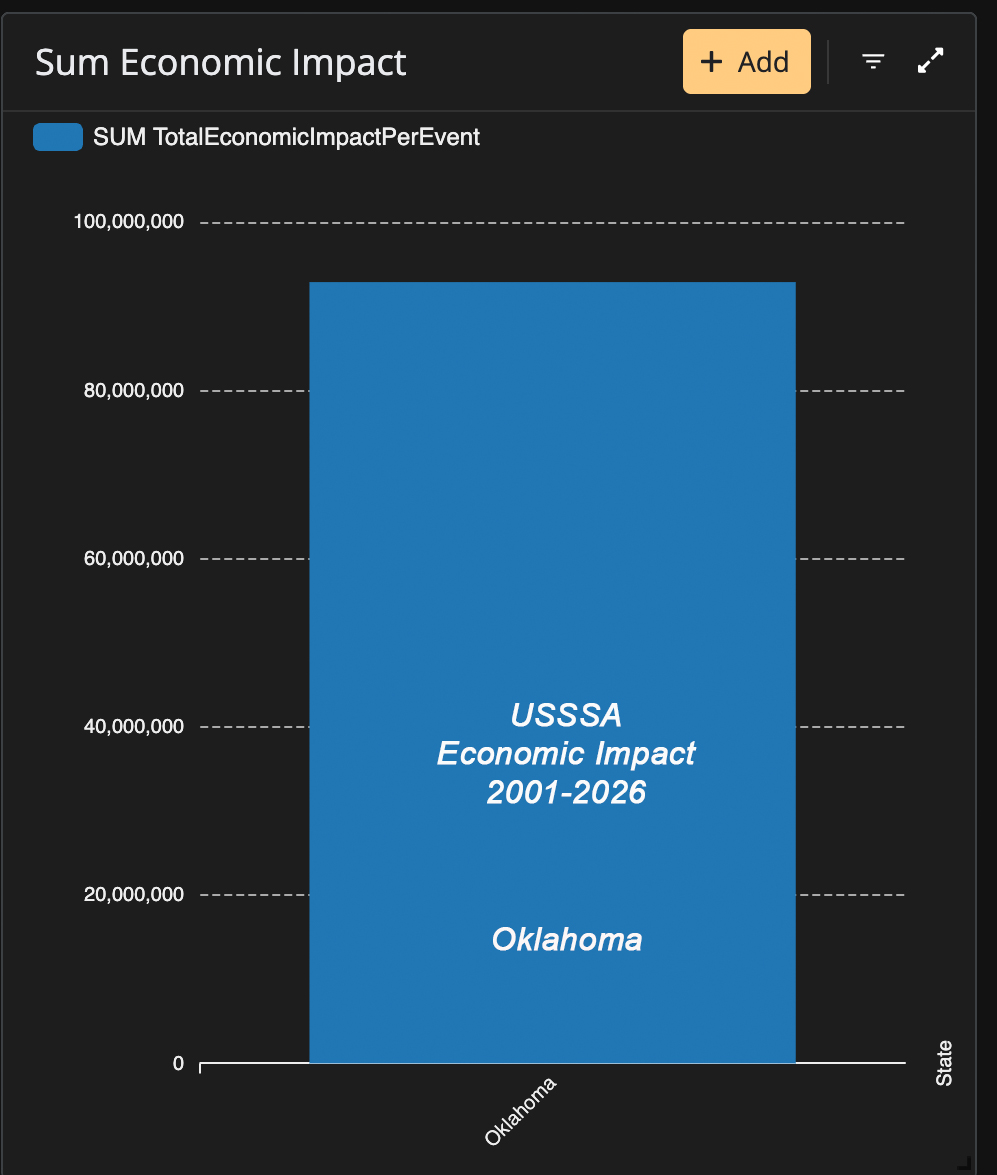
≈$93M
Modeled Economic Impact
Tournament-Economy Model

How Tournament Participation Can Move Through the Economy

Team registration is only the first layer. Tournament activity activates facilities, labor, spectator travel and consumer spending across host communities.

1
Teams Teams register for tournament competition.
2
Tournaments Games and facility schedules are activated.
3
Families Players, coaches and spectators travel.
4
Hotels Overnight tournaments generate lodging demand.
5
Restaurants Families purchase meals throughout the community.
6
Retail Fuel, groceries and sporting goods are purchased.
7
Tourism Sports travel brings outside visitors into communities.
8
Community Local commerce and potential tax activity increase.
Primary Research Dashboard

Oklahoma USSSA • 2001–2026

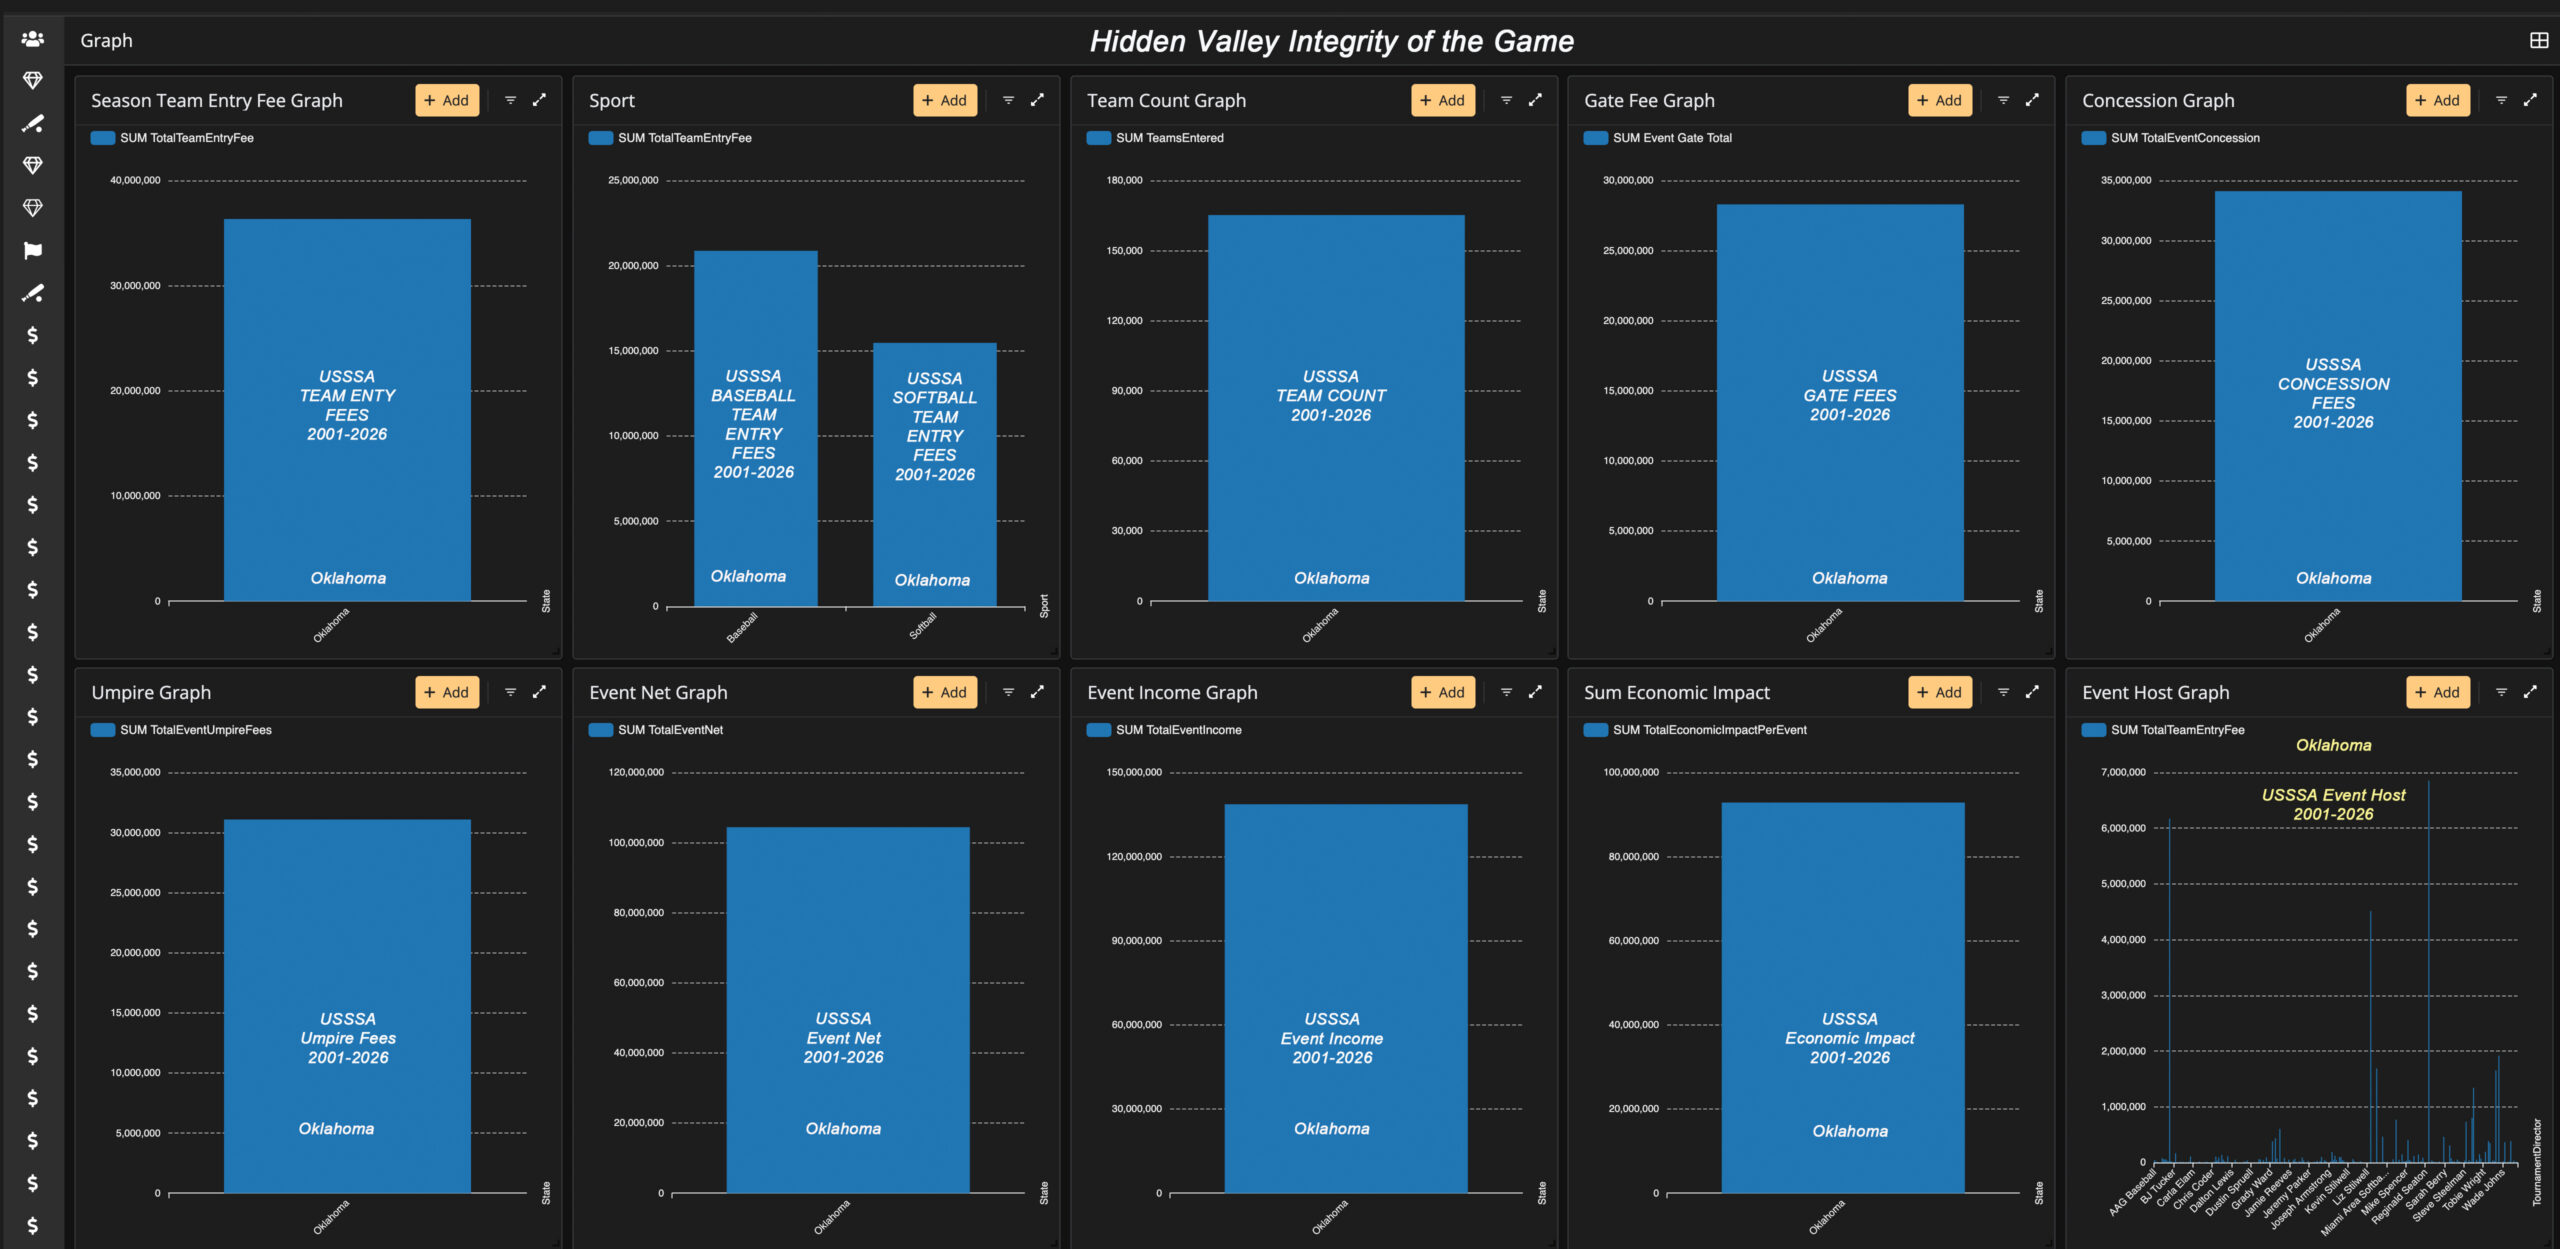
The statewide dashboard consolidates ten major analytical categories into a single view, providing a high-level picture of tournament participation, modeled finances, sport distribution and event-host activity.

Hidden Valley Oklahoma statewide USSSA research dashboard for 2001 through 2026
Statewide Registration Economics

More Than $36 Million in Estimated Team Entry Fees

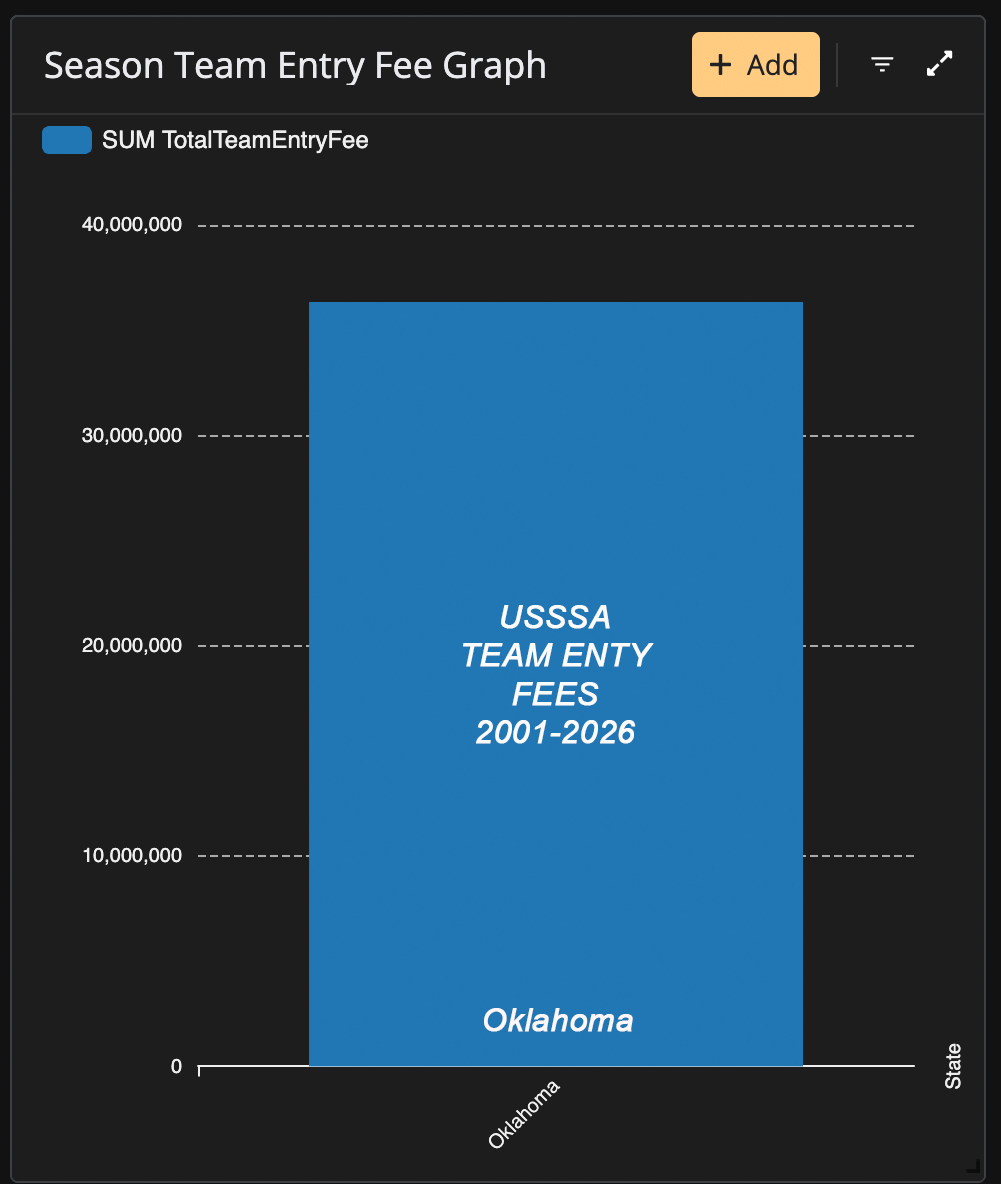
Team registration represents the foundational revenue category within the tournament model. The statewide dashboard places cumulative 2001–2026 entry-fee activity at approximately $36 million.

Oklahoma USSSA statewide team entry fees from 2001 through 2026
Sport Comparison

Baseball and Softball Both Drive the Statewide Tournament Economy

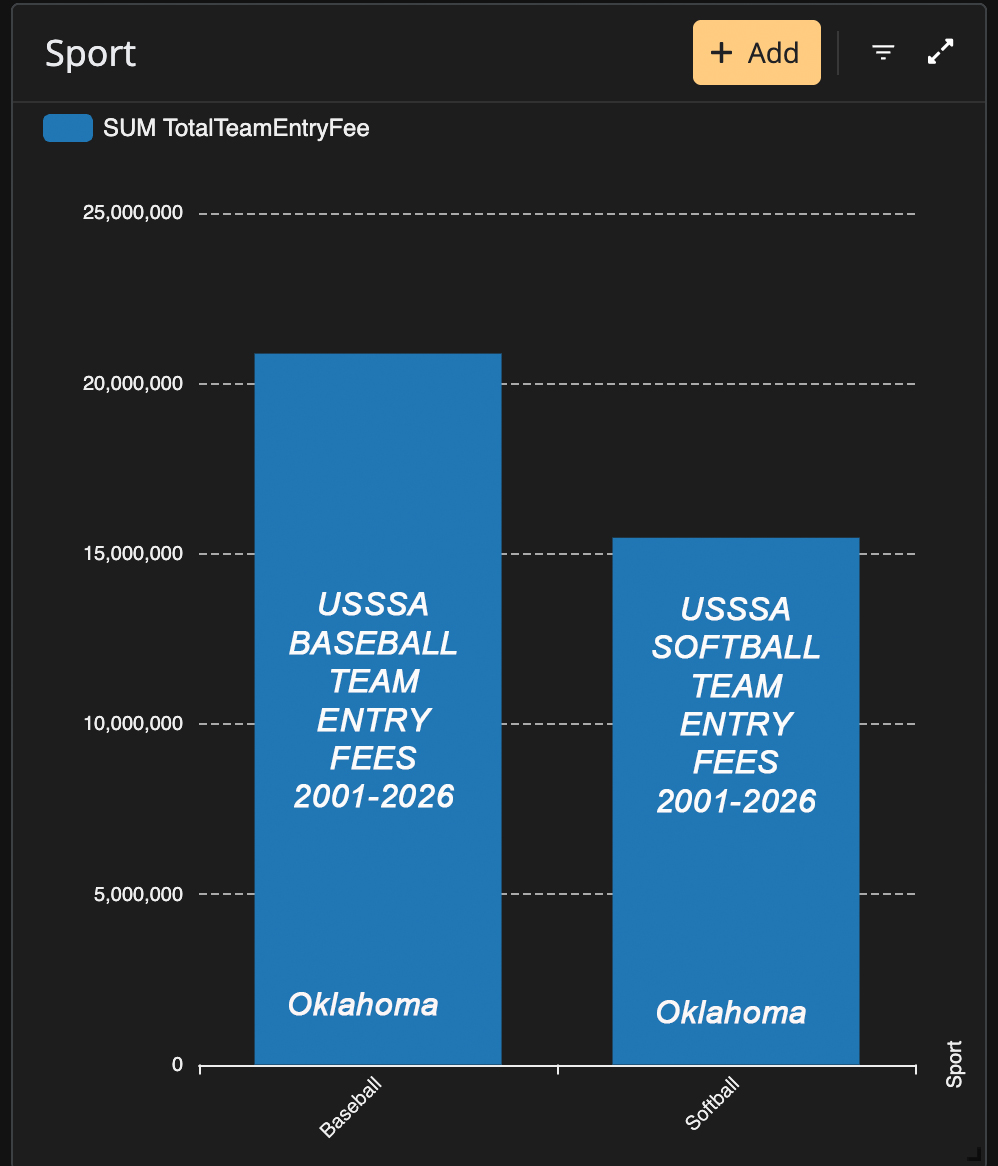
The statewide sport comparison indicates approximately $21 million in baseball entry-fee activity and approximately $15.5 million in softball entry-fee activity during the study period.

Oklahoma USSSA baseball versus softball team entry fees from 2001 through 2026
Baseball ≈57% Softball ≈43%

USSSA Baseball

≈$21M
Approximately 57% of statewide entry-fee activity
  • Larger cumulative statewide entry-fee category
  • Major contributor to Oklahoma sports tourism
  • Activity distributed across numerous facilities and hosts
  • Substantial long-term tournament infrastructure

USSSA Softball

≈$15.5M
Approximately 43% of statewide entry-fee activity
  • Major statewide tournament category
  • Substantial family-travel activity
  • Meaningful municipal facility utilization
  • Significant contribution to the combined tournament economy
Participation Scale

Approximately 166,000 Recorded Team Entries

The statewide team-count dashboard demonstrates the magnitude of participation across the twenty-six-year study period. These are tournament entries rather than necessarily 166,000 unique organizations.

Oklahoma USSSA statewide team count from 2001 through 2026
Event-Host Distribution

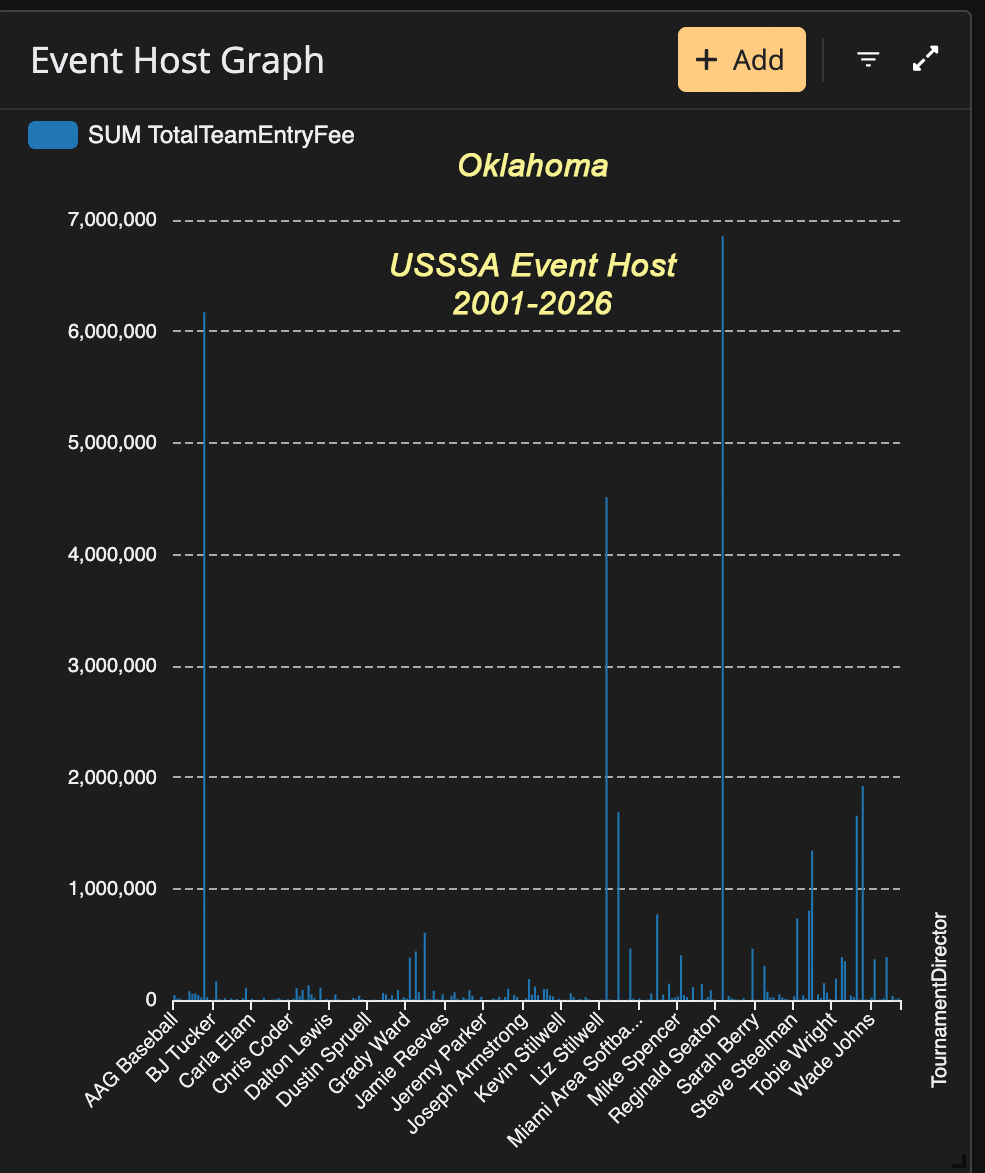
Tournament Production Is Not Evenly Distributed

The event-host graph shows substantial differences in cumulative team-entry-fee activity among tournament directors and hosting groups. Large differences in host totals may result from event volume, years of operation, tournament size, facility access, pricing or other legitimate operational factors.

Oklahoma USSSA event host team entry fee distribution from 2001 through 2026

Market Concentration

A relatively small number of event hosts appear to account for a substantial portion of cumulative entry-fee activity.

Operational Capacity

Higher totals may reflect longevity, event frequency, larger fields, facility relationships or greater organizational capacity.

Future Verification

Tournament schedules, host agreements and facility contracts would provide additional context regarding event concentration.

Financial Research Gallery

Additional Statewide Financial Indicators

Each graphic below represents a separate component of the statewide Hidden Valley analytical model. Select any image to enlarge it.

Beyond Tournament Revenue

Youth Sports Can Affect Multiple Layers of the Local Economy

Direct event revenues capture only part of tournament-related commerce. Visiting athletes and families may also create demand across hospitality, retail, transportation and service sectors.

H

Hotels

Overnight tournament stays can generate hotel and lodging demand.

R

Restaurants

Tournament families frequently purchase meals throughout event weekends.

G

Gas & Travel

Fuel and transportation expenses accompany regional tournament travel.

S

Retail

Sporting goods, groceries, apparel and convenience purchases add activity.

T

Tourism

Tournament travel can introduce families to host communities.

$

Sales Tax

Visitor spending may contribute to taxable local retail activity.

J

Employment

Tournament operations support officials, staff, vendors and contractors.

C

Community Development

Sports infrastructure can become part of broader economic-development strategy.

Research Methodology

From Tournament Data to Statewide Analysis

Hidden Valley Oklahoma Research uses a standardized analytical framework so statewide, municipal and facility-level studies can be compared consistently.

1
Dataset Event and division records are collected and organized.
2
Data Review Records are standardized for analysis.
3
AppSheet Dashboard filters aggregate teams, years and locations.
4
Modeling Standardized assumptions estimate additional categories.
5
Interpretation Trends and distributions are examined.
6
Verification Public and financial records can test modeled findings.
HVIOG Research Standards

Four Categories of Evidence

Every Hidden Valley report should distinguish clearly among underlying data, modeled calculations, analytical interpretation and independently verified conclusions.

Level 1

Observed Data

Event, tournament, team, sport, year and host information contained within the research dataset.

Level 2

Modeled Estimates

Calculations produced using standardized assumptions for admissions, concessions, umpire expenses and related categories.

Level 3

Research Interpretation

Identification of trends, concentration, growth patterns and areas requiring additional investigation.

Level 4

Verified Conclusion

Findings supported by contracts, receipts, financial records, government documentation or other primary evidence.

Verification Framework

From Dataset Observation to Documented Finding

1
Dataset Identify the underlying event or financial pattern.
2
Public Records Obtain government documentation when applicable.
3
Contracts Review leases, agreements and facility-use arrangements.
4
Financial Records Compare receipts, invoices and official accounting information.
5
Cross-Reference Compare independent sources against modeled values.
6
Conclusion Publish verified facts and identify remaining uncertainty.
Public-Interest Research

Questions for Future Verification

These questions do not imply wrongdoing. They identify categories where additional records could improve public understanding of Oklahoma's youth-sports economy.

Municipal Facility Agreements What leases, field-use agreements or operating contracts govern major tournament facilities?
Tournament Scheduling How are event dates allocated among sanctioning bodies, tournament hosts, leagues and competing organizations?
Facility Revenue What portions of rental, gate, concession or parking income are retained by municipalities, facilities and event operators?
Public Expenditures What public investments support maintenance, utilities, improvements, staffing and infrastructure?
Sports-Tourism Outcomes What measurable hotel, restaurant and sales-tax activity is generated by tournament weekends?
Host Concentration What operational or contractual factors explain major differences among tournament-host totals?
Revenue Verification How closely do actual financial records align with modeled tournament estimates?
Community Return How should municipalities measure the public return generated by sports-complex investment?
Hidden Valley Research Library

From Statewide Analysis to Local Facility Research

This statewide report establishes the analytical baseline for facility and municipality studies published through the Hidden Valley Oklahoma Research initiative.

Oklahoma statewide Hidden Valley USSSA research
Statewide Flagship
Oklahoma • 2001–2026

Oklahoma USSSA Baseball & Softball Economic Activity

Statewide foundational analysis of tournament participation, financial estimates, sports tourism and event-host activity.

View Statewide Research →
Bouse Sports Complex Hidden Valley facility research
Facility Study
Choctaw, Oklahoma

Bouse Sports Complex

Facility-level analysis of USSSA tournament activity, revenue estimates and host distribution.

View Bouse Research →

Additional municipality and sports-complex studies can be added to this library as they are completed, creating a unified statewide research archive.

Statewide Research Publication

Oklahoma USSSA Baseball-Softball Economic Activity • 2001–2026

The downloadable Executive Summary provides a consolidated examination of twenty-six years of statewide USSSA tournament activity, including participation, financial estimates, sport distribution, event-host concentration, economic impact, methodology and research limitations.

Statewide Study 2001–2026 Baseball Softball Economic Impact Tournament Hosts Public Accountability
  • Twenty-six-year statewide overview
  • Approximately 166,000 recorded team entries
  • Approximately $36 million in team entry fees
  • Baseball and softball comparison
  • Event-host distribution analysis
  • Modeled admissions and concessions
  • Umpire compensation analysis
  • Economic-impact discussion
  • Research methodology and limitations
Statewide Research Conclusion

Oklahoma Youth Tournament Sports Represent a Significant Economic System

The Hidden Valley Oklahoma Research dataset indicates that USSSA baseball and softball tournament activity developed into a substantial statewide youth-sports ecosystem between 2001 and 2026. The scale of team participation, direct tournament revenue and modeled community impact demonstrates that youth sports warrant examination not only as recreation, but also as sports tourism, economic development and public-policy activity.

Economic Development

Large tournament systems can generate significant visitor activity and may influence community decisions involving facilities, infrastructure and tourism strategy.

Public Accountability

Publicly owned or publicly supported sports facilities benefit from transparent agreements, measurable outcomes and clearly documented revenue and expense structures.

Future Research

The statewide dataset provides a foundation for detailed municipality, facility, event-host and year-specific studies across Oklahoma.

Research, Publication and Legal Disclaimer

Hidden Valley Oklahoma Research is presented for research, education, public-interest analysis and discussion concerning youth-sports economics, sports tourism, public-facility use and community impact.

Values identified as estimates were developed from the Hidden Valley Oklahoma Research dataset, AppSheet calculations and standardized analytical assumptions. They have not been independently audited and should not be interpreted as official financial statements of USSSA, any municipality, sports complex, event host, tournament director, sanctioning organization or private entity.

Event-host concentration, differences in tournament volume or other patterns displayed within this research do not constitute allegations or findings of criminal, civil, contractual or ethical wrongdoing. Differences may result from legitimate operational, historical, scheduling, competitive or contractual factors.

Independent contracts, receipts, invoices, accounting records, government documents and other primary-source evidence would be required to establish verified financial conclusions.

Readers should distinguish carefully among observed dataset information, modeled estimates, research interpretation and independently verified conclusions.