
The Battlefields
The Battlefields
Oklahoma USSSA Facility Activity Profile | 2001–2026. Independent research organizing publicly available tournament, facility, team, director, municipality, county, posted-fee, and operational information into a facility-level analytical framework.
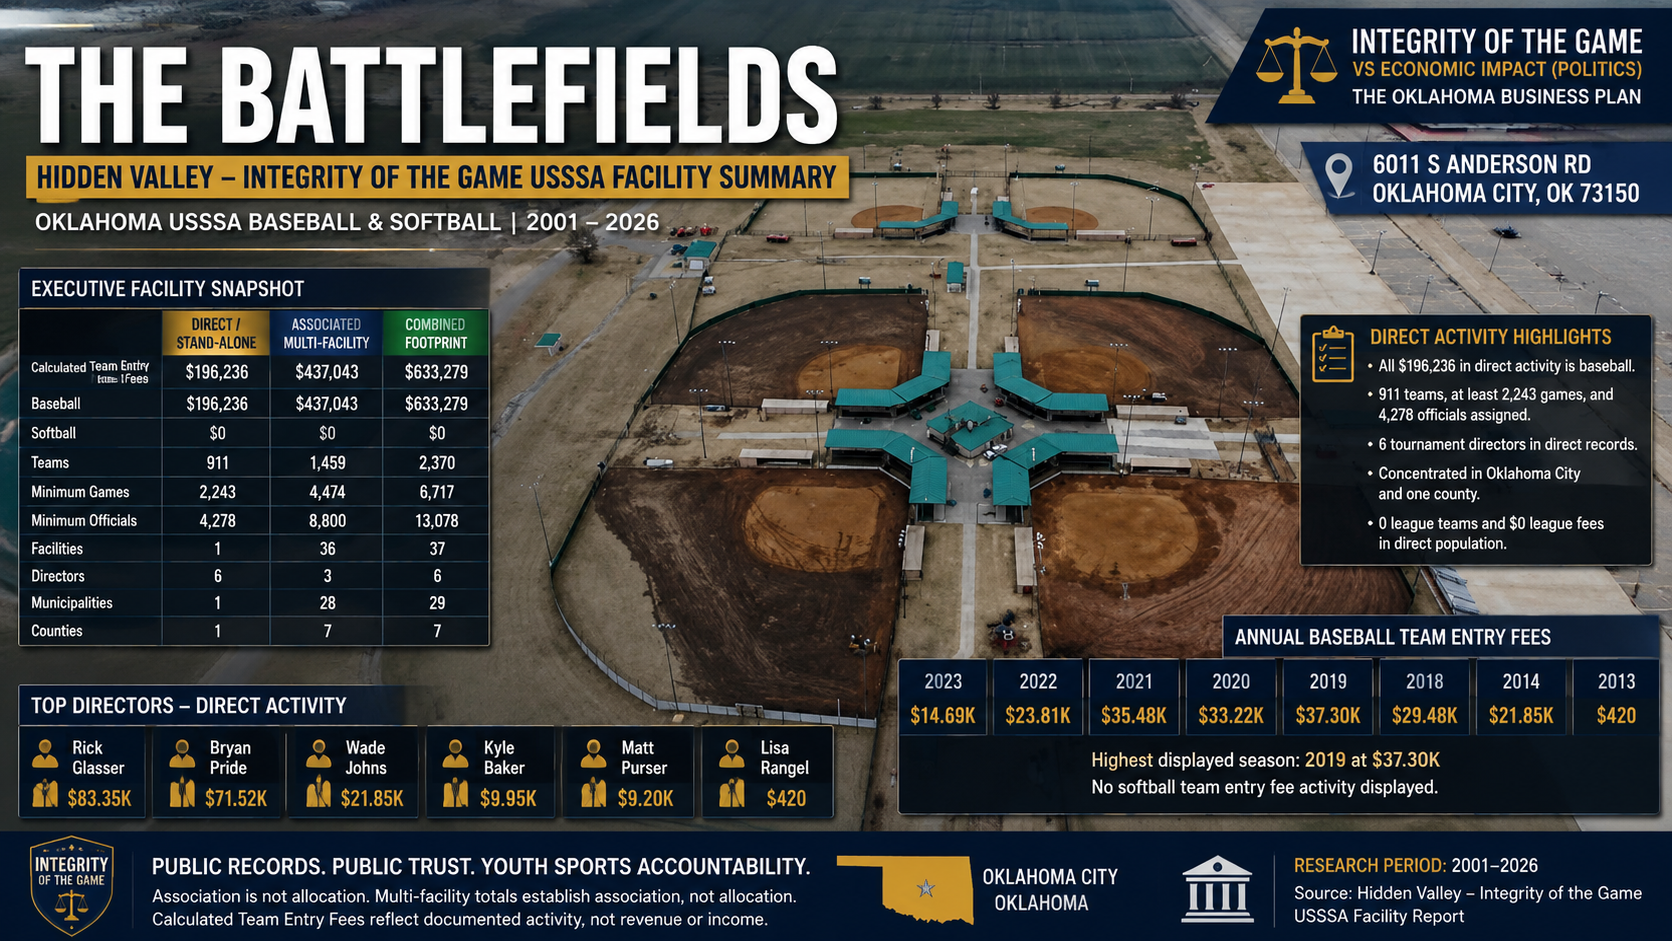
Direct / Stand-Alone Activity
Pages 1–2 of the report represent the most conservative facility-specific population: records listing The Battlefields independently as the event facility, excluding multi-facility combinations.
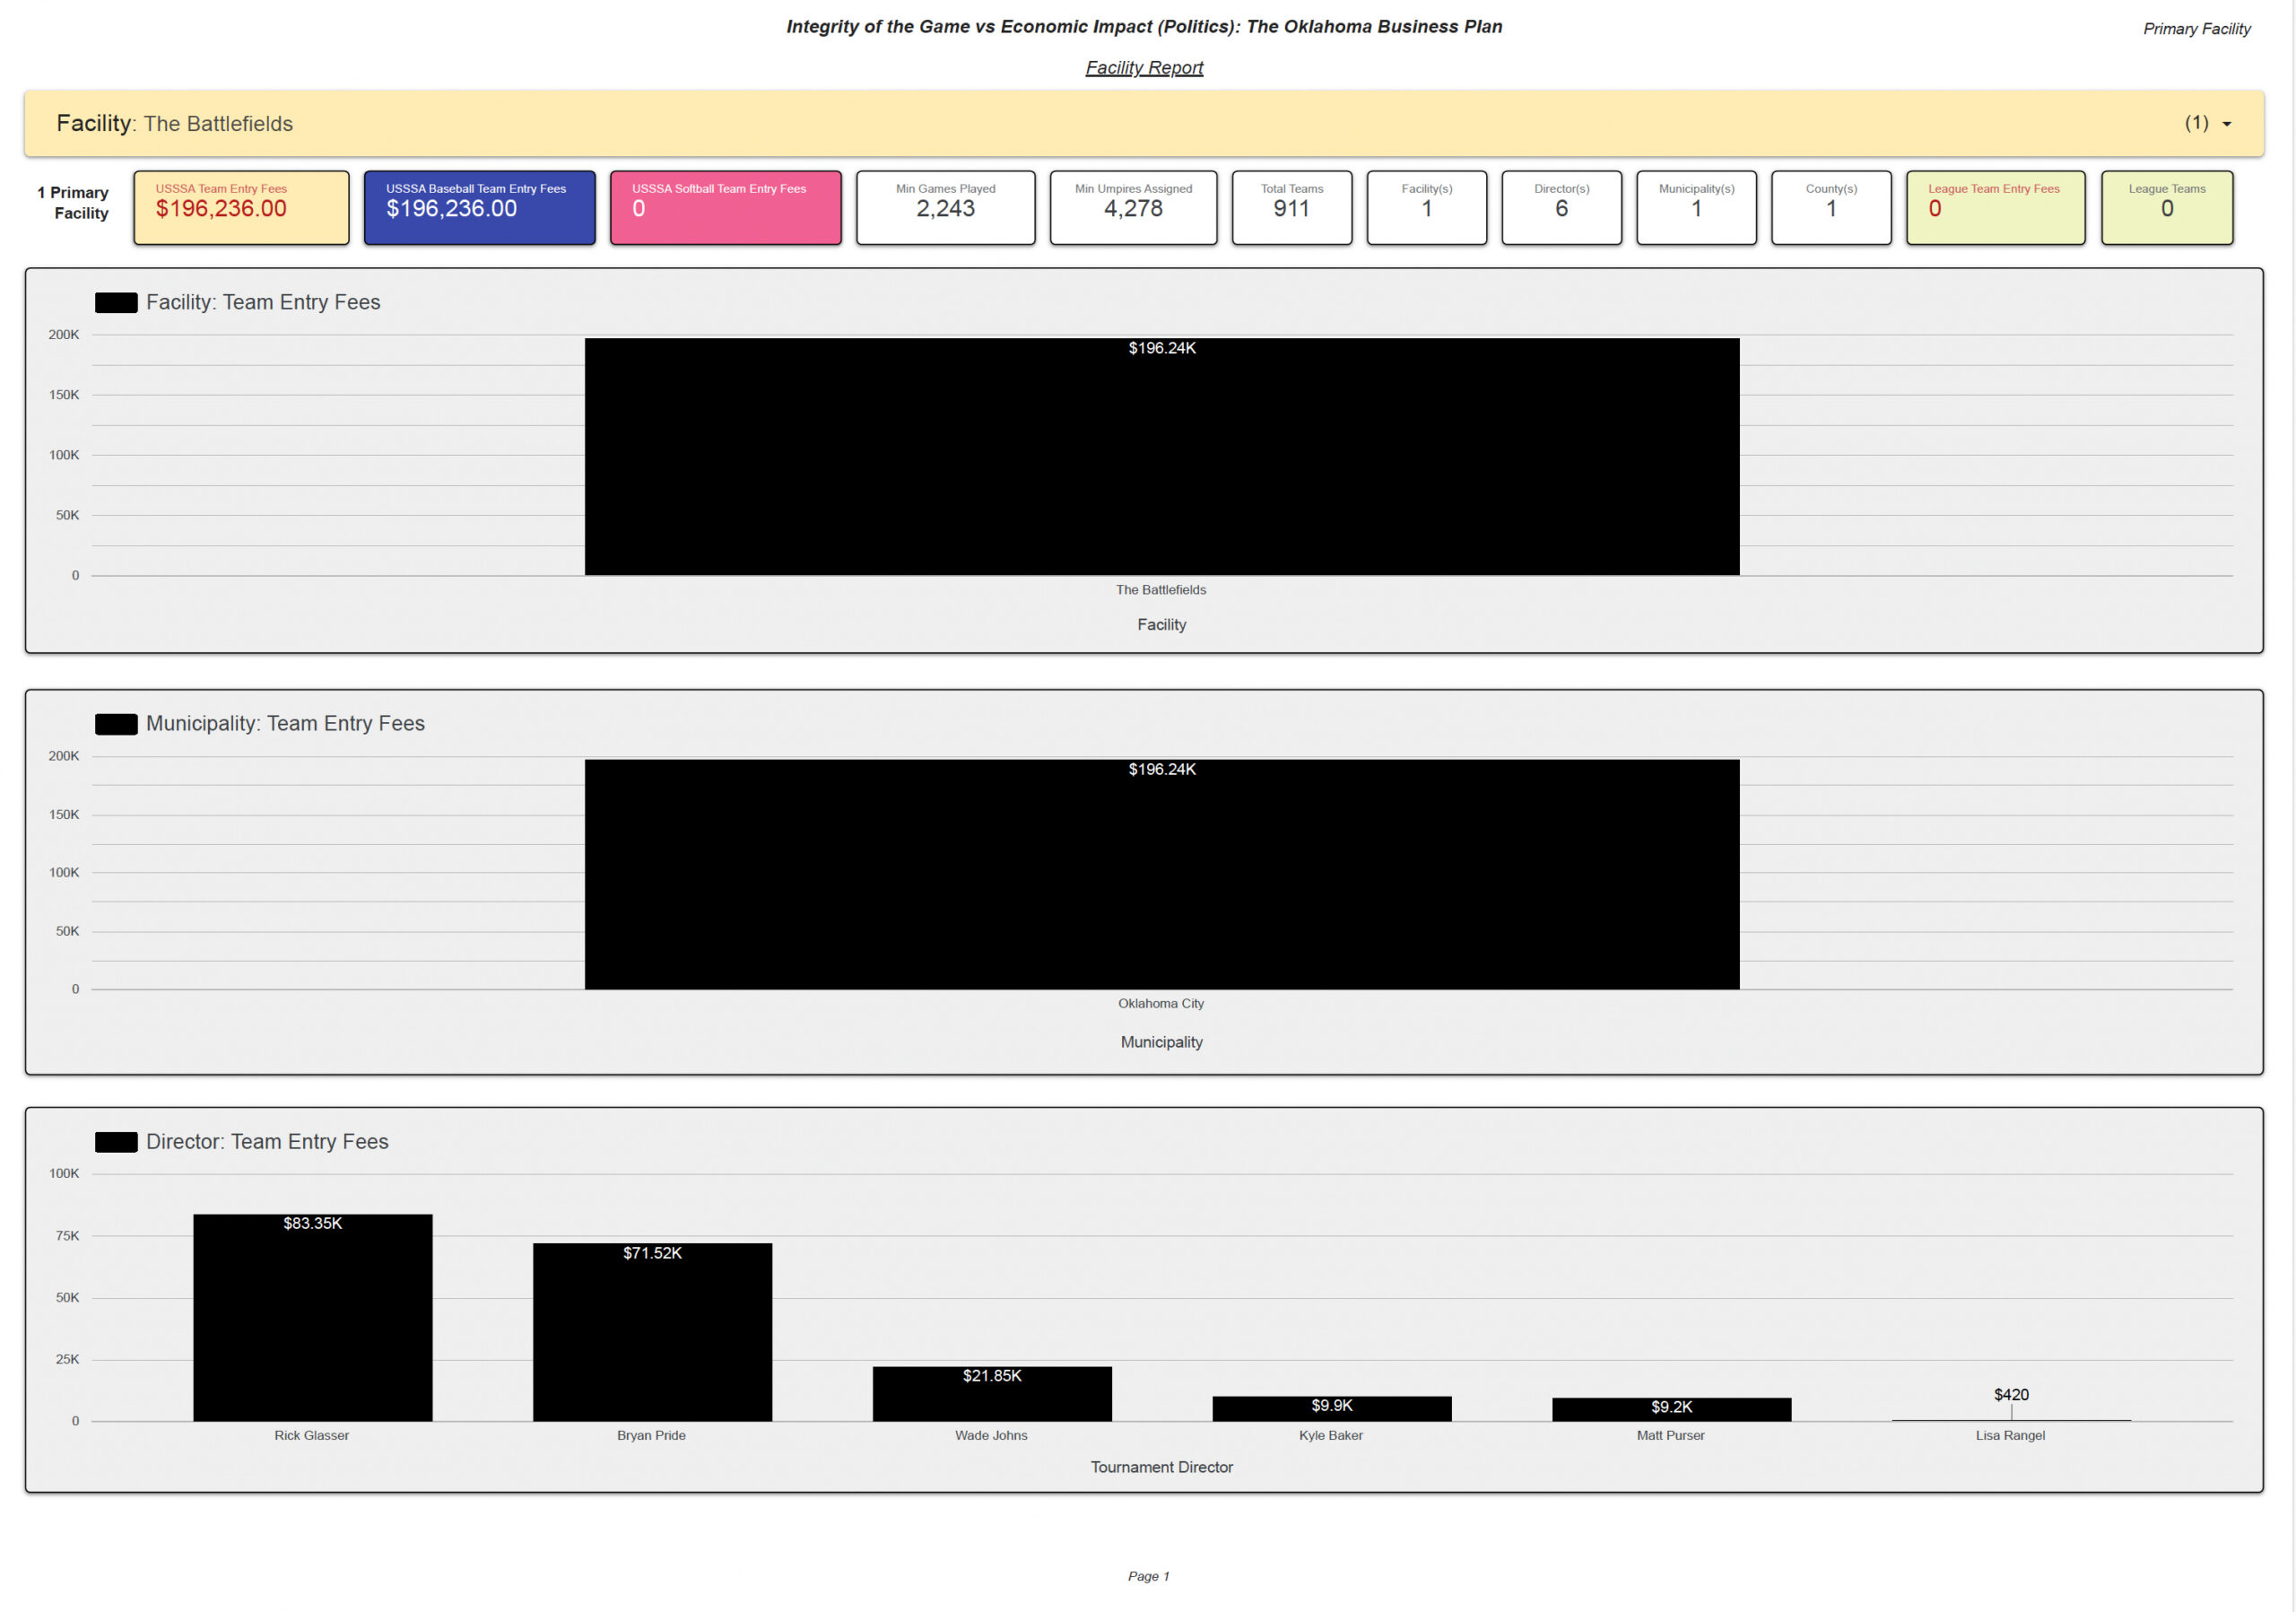
Direct Facility, Municipality & Director Activity
The report identifies $196,236 in direct Calculated Team Entry Fees, all associated with baseball. The direct population includes 911 teams, at least 2,243 games, and at least 4,278 officials assigned.
The direct municipality chart is concentrated in Oklahoma City. Six tournament directors appear in the direct records. Their report-associated Calculated Team Entry Fee concentrations are Rick Glasser ($83.35K), Bryan Pride ($71.52K), Wade Johns ($21.85K), Kyle Baker ($9.9K), Matt Purser ($9.2K), and Lisa Rangel ($420). These amounts are analytical activity associated with records under each director and are not evidence of personal income or receipt.
Annual & Sport Trends
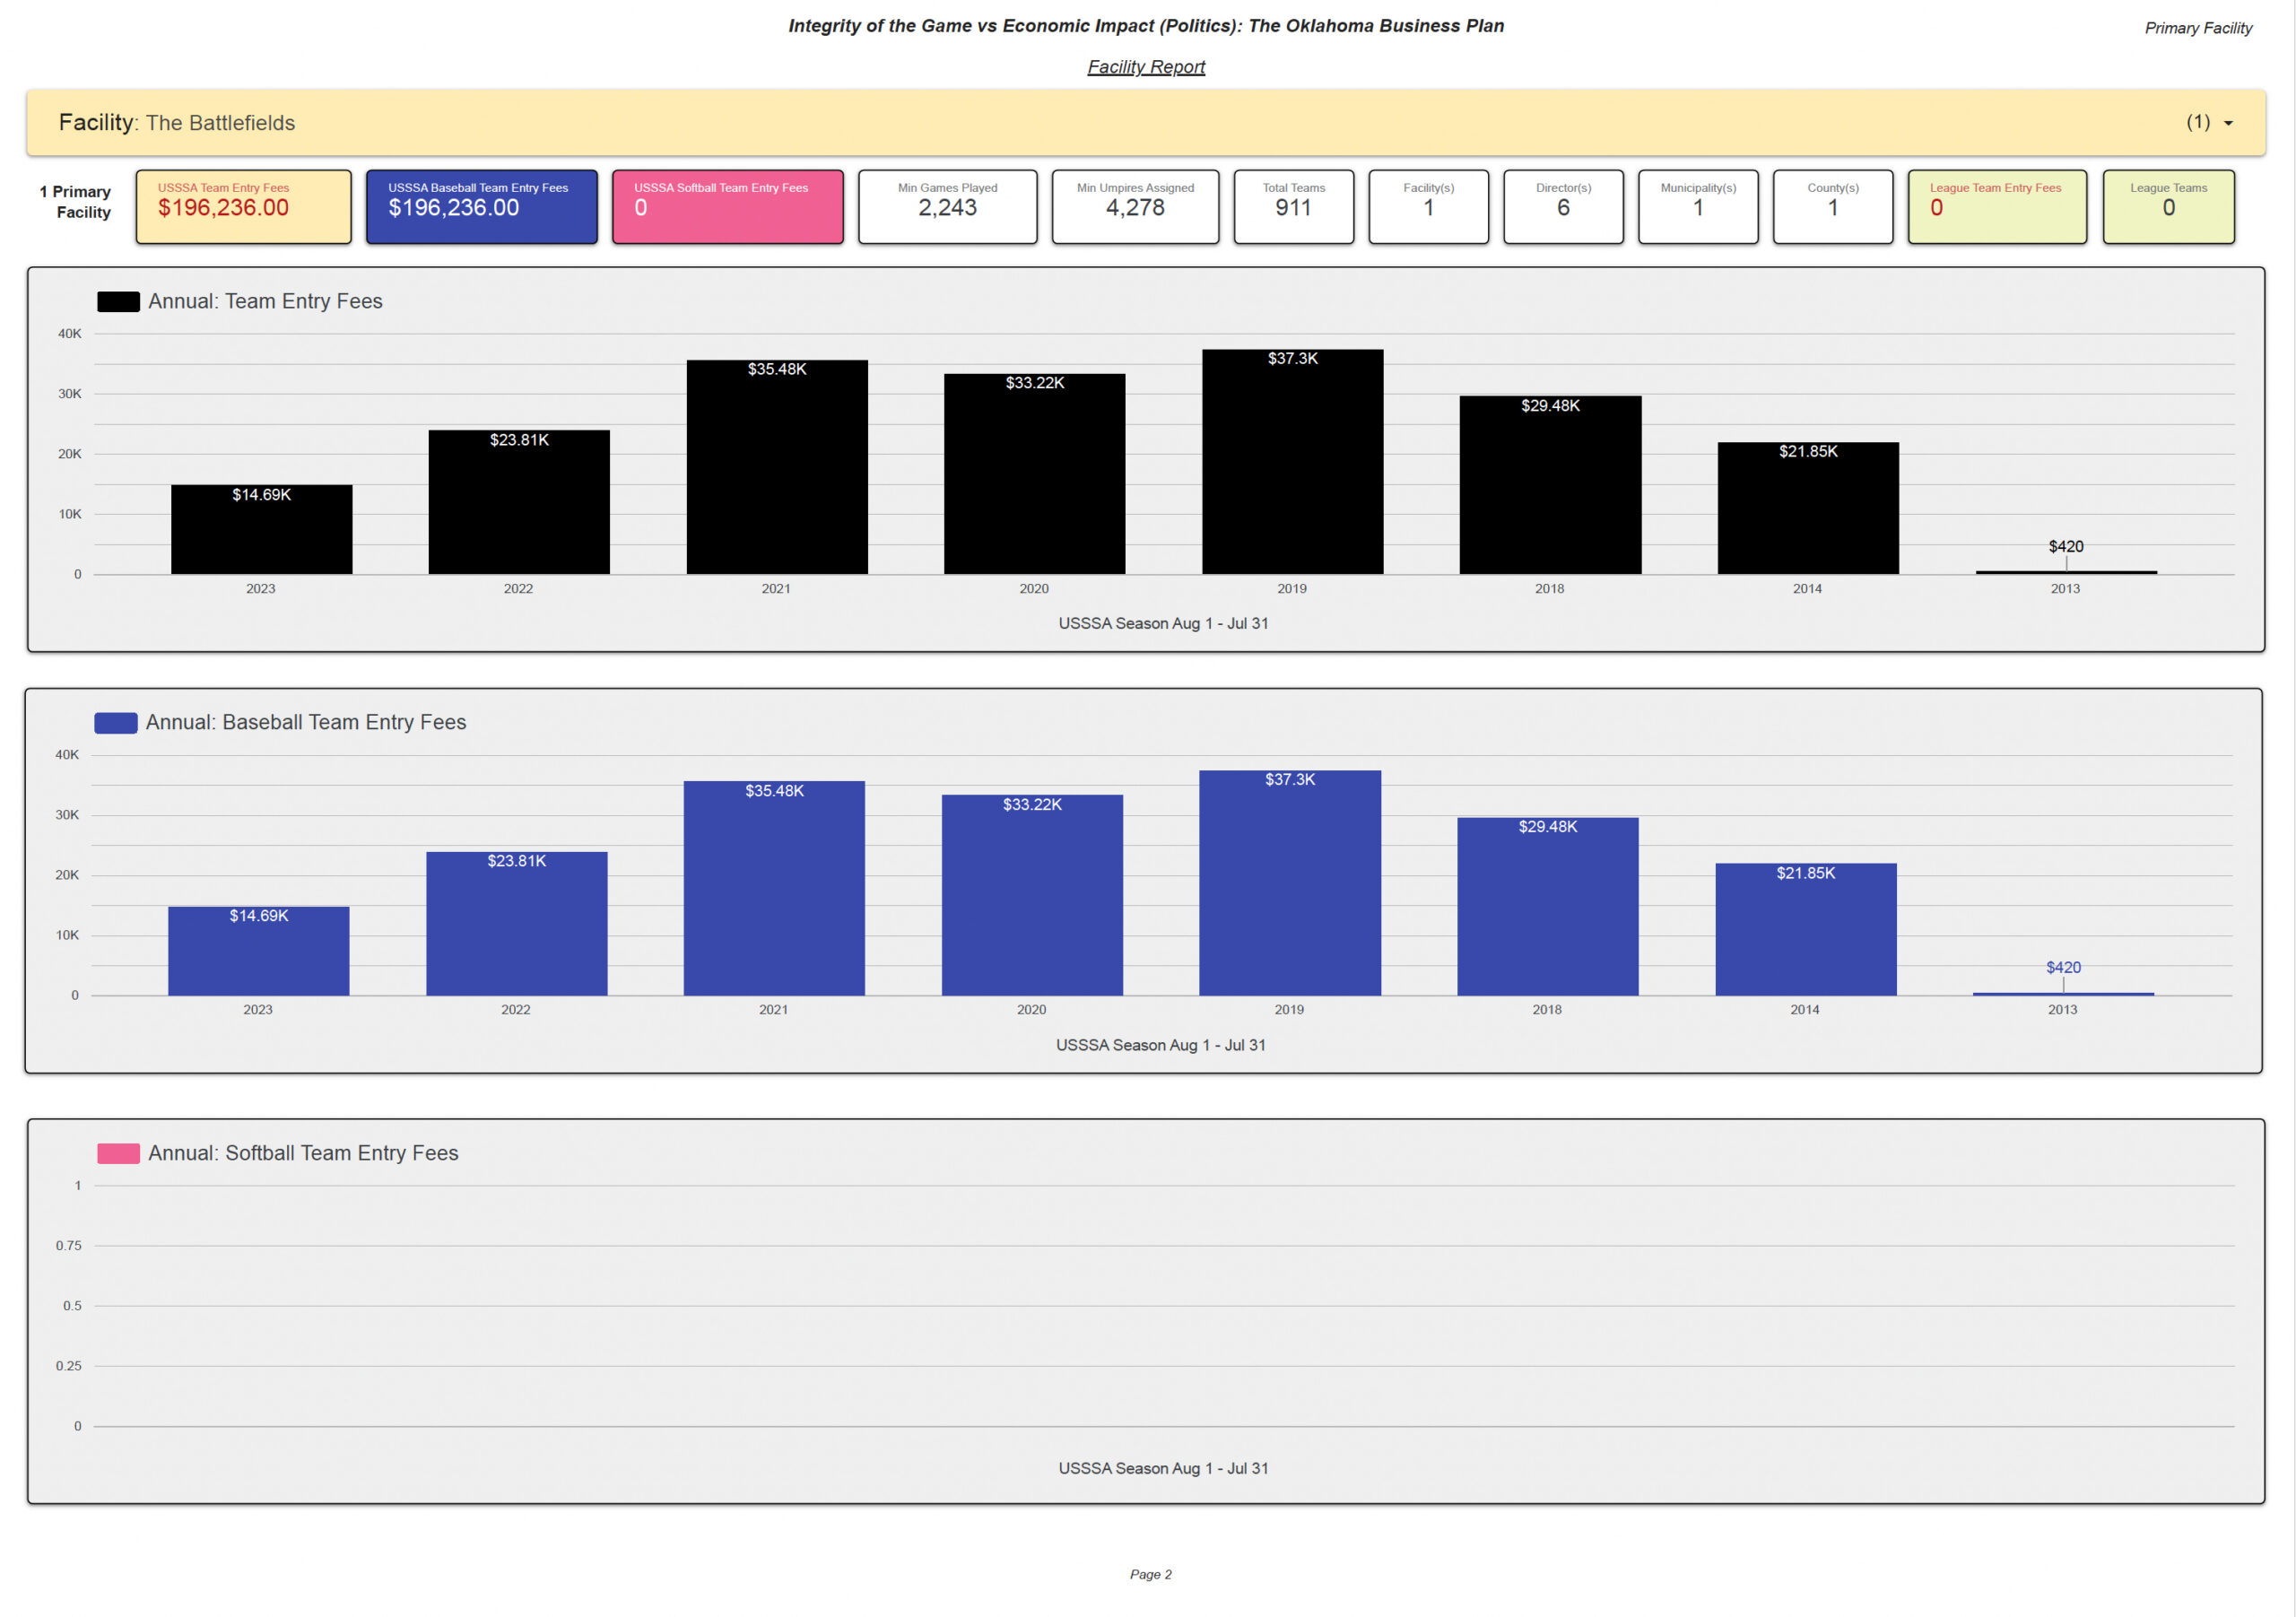
| USSSA Season | Calculated Team Entry Fees | Baseball | Softball |
|---|---|---|---|
| 2013 | $420 | $420 | $0 |
| 2014 | $21.85K | $21.85K | $0 |
| 2018 | $29.48K | $29.48K | $0 |
| 2019 | $37.30K | $37.30K | $0 |
| 2020 | $33.22K | $33.22K | $0 |
| 2021 | $35.48K | $35.48K | $0 |
| 2022 | $23.81K | $23.81K | $0 |
| 2023 | $14.69K | $14.69K | $0 |
The highest displayed direct season is 2019 at $37.30K, followed by 2021 ($35.48K) and 2020 ($33.22K). The annual charts show no softball Calculated Team Entry Fee activity.
Associated Multi-Facility / Satellite Activity
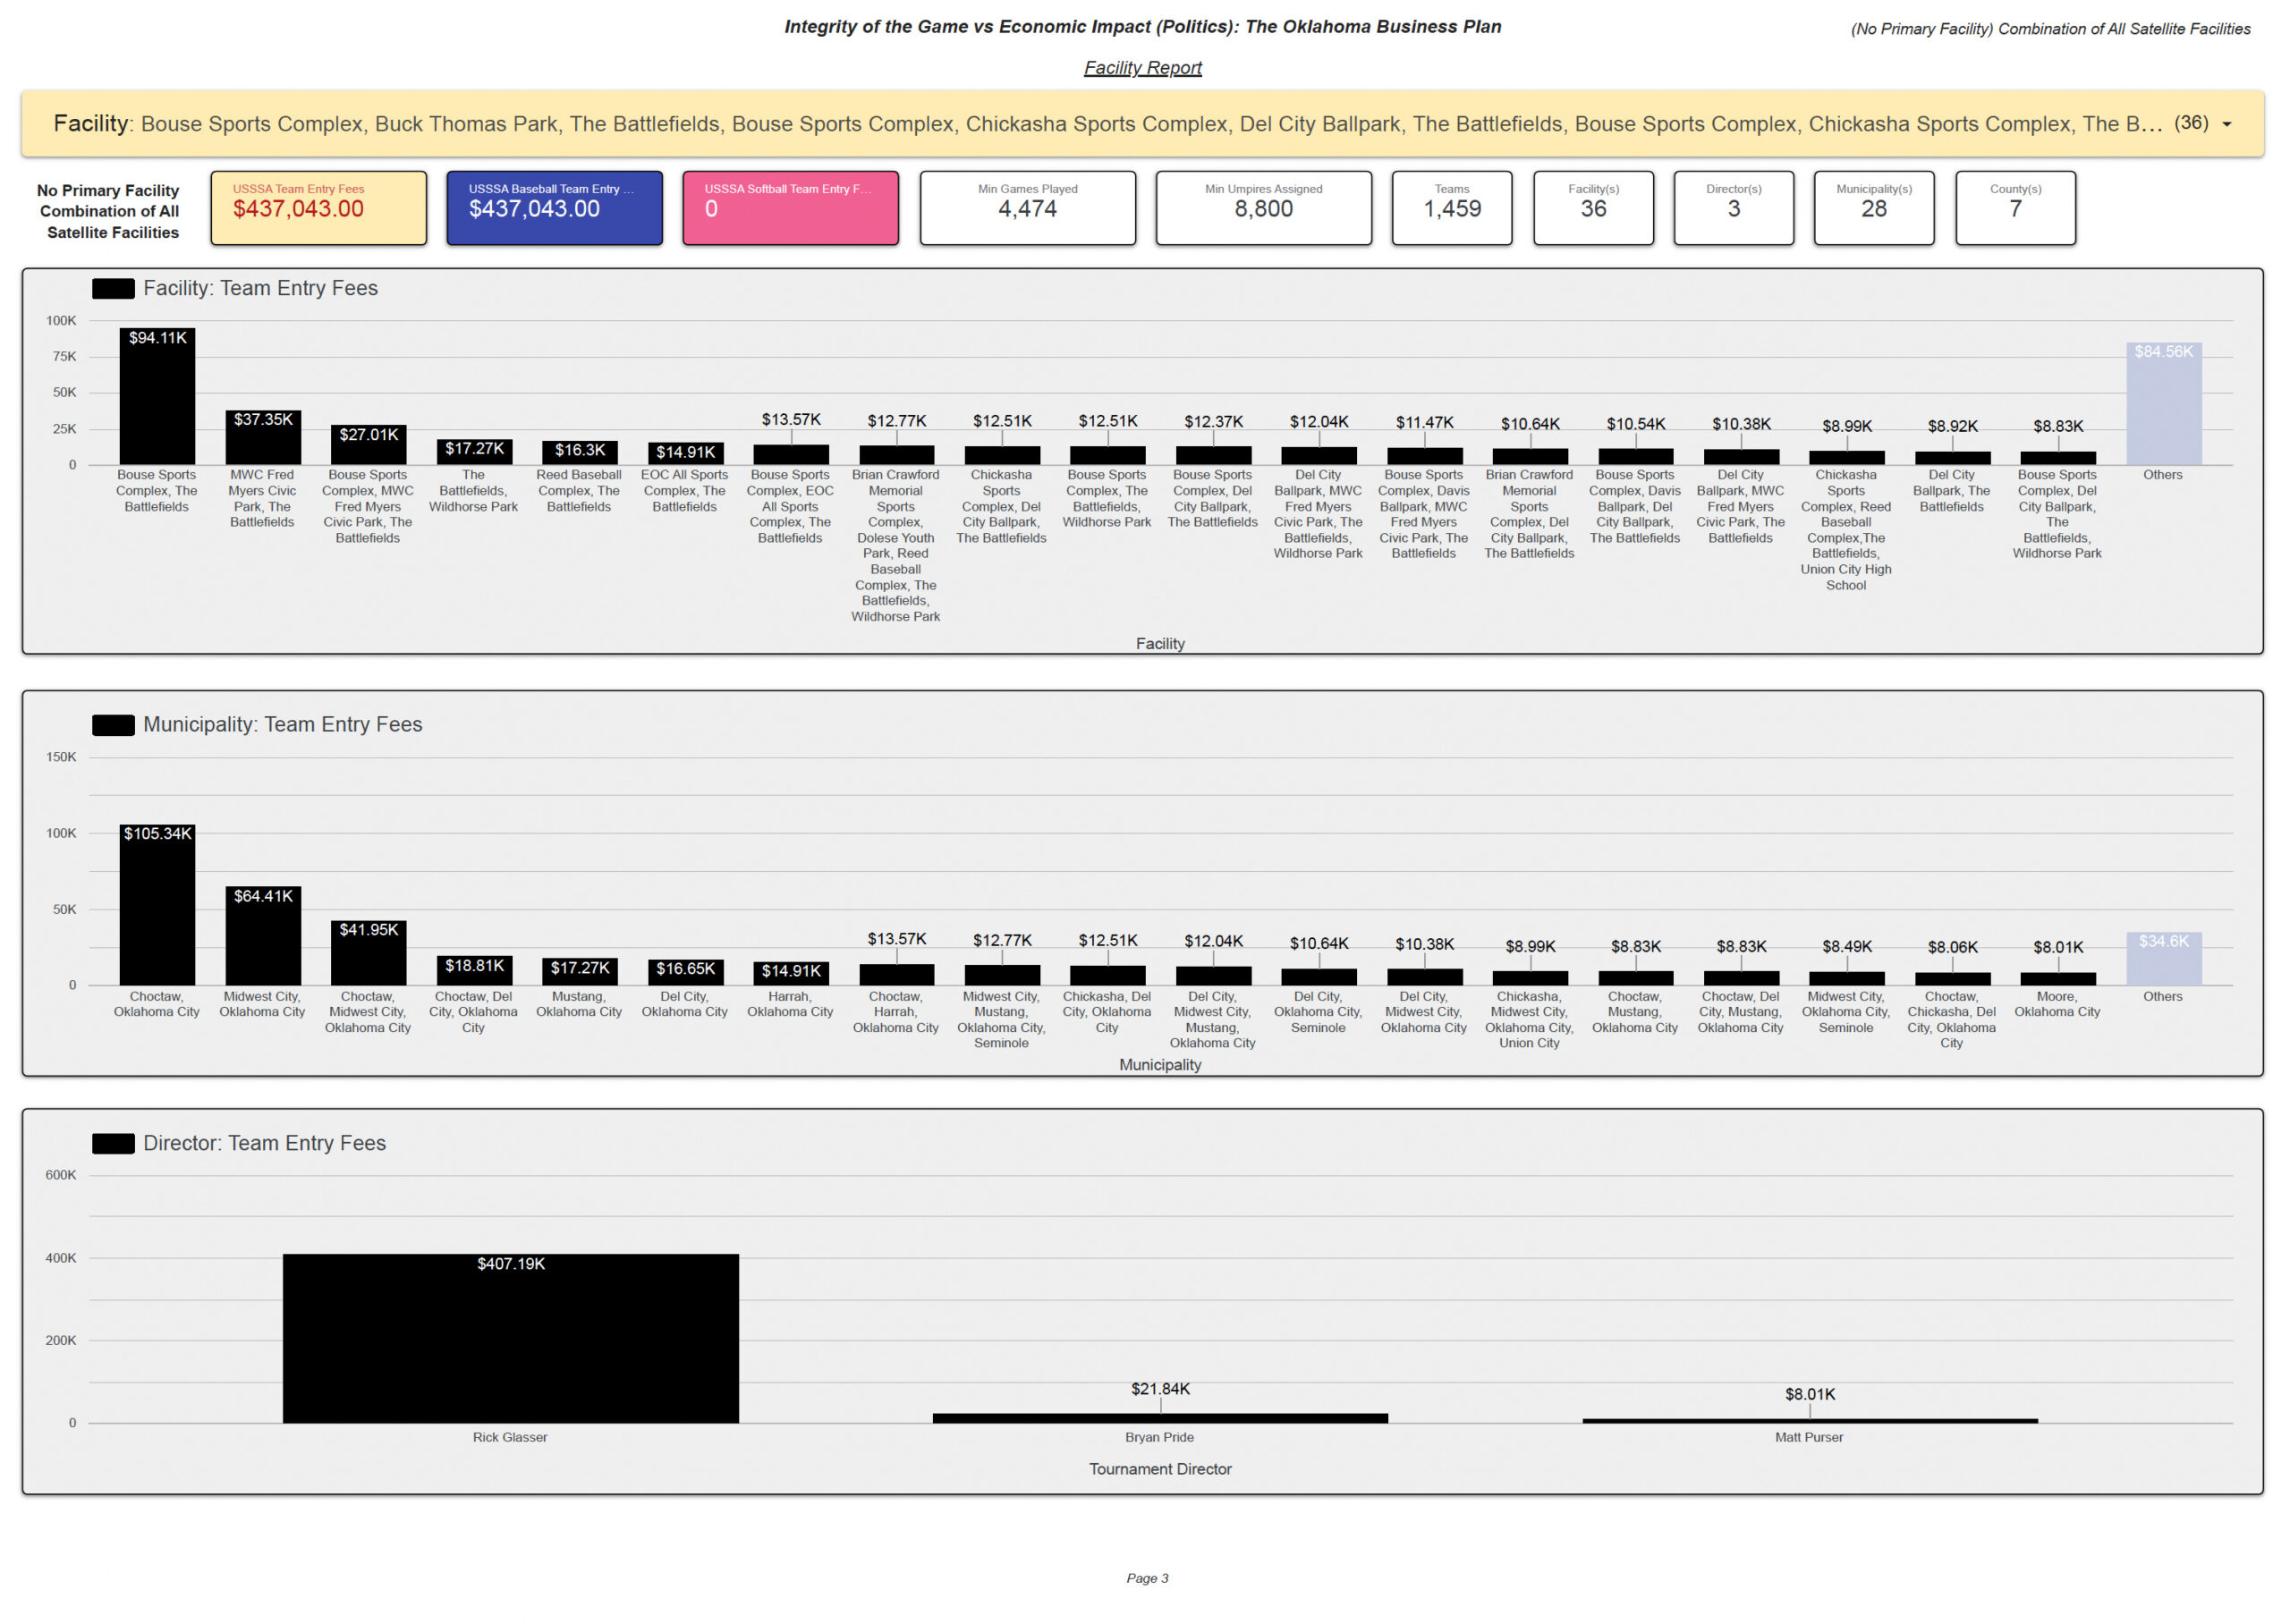
Page 3 excludes the stand-alone Primary Facility population and examines records where The Battlefields appears with one or more additional facilities. The report identifies $437,043 in associated Calculated Team Entry Fees, all baseball, involving 1,459 teams, at least 4,474 games, at least 8,800 officials, 36 facility configurations, 28 municipality configurations, 7 counties, and 3 directors.
Selected Facility Configurations
| Configuration | Calculated Activity |
|---|---|
| Bouse Sports Complex + The Battlefields | $94.11K |
| MWC Fred Myers Civic Park + The Battlefields | $37.35K |
| Bouse Sports Complex + MWC Fred Myers Civic Park + The Battlefields | $27.01K |
| The Battlefields + Wildhorse Park | $17.27K |
| Reed Baseball Complex + The Battlefields | $16.30K |
| EOC All Sports Complex + The Battlefields | $14.91K |
Combined Documented Facility Activity Footprint
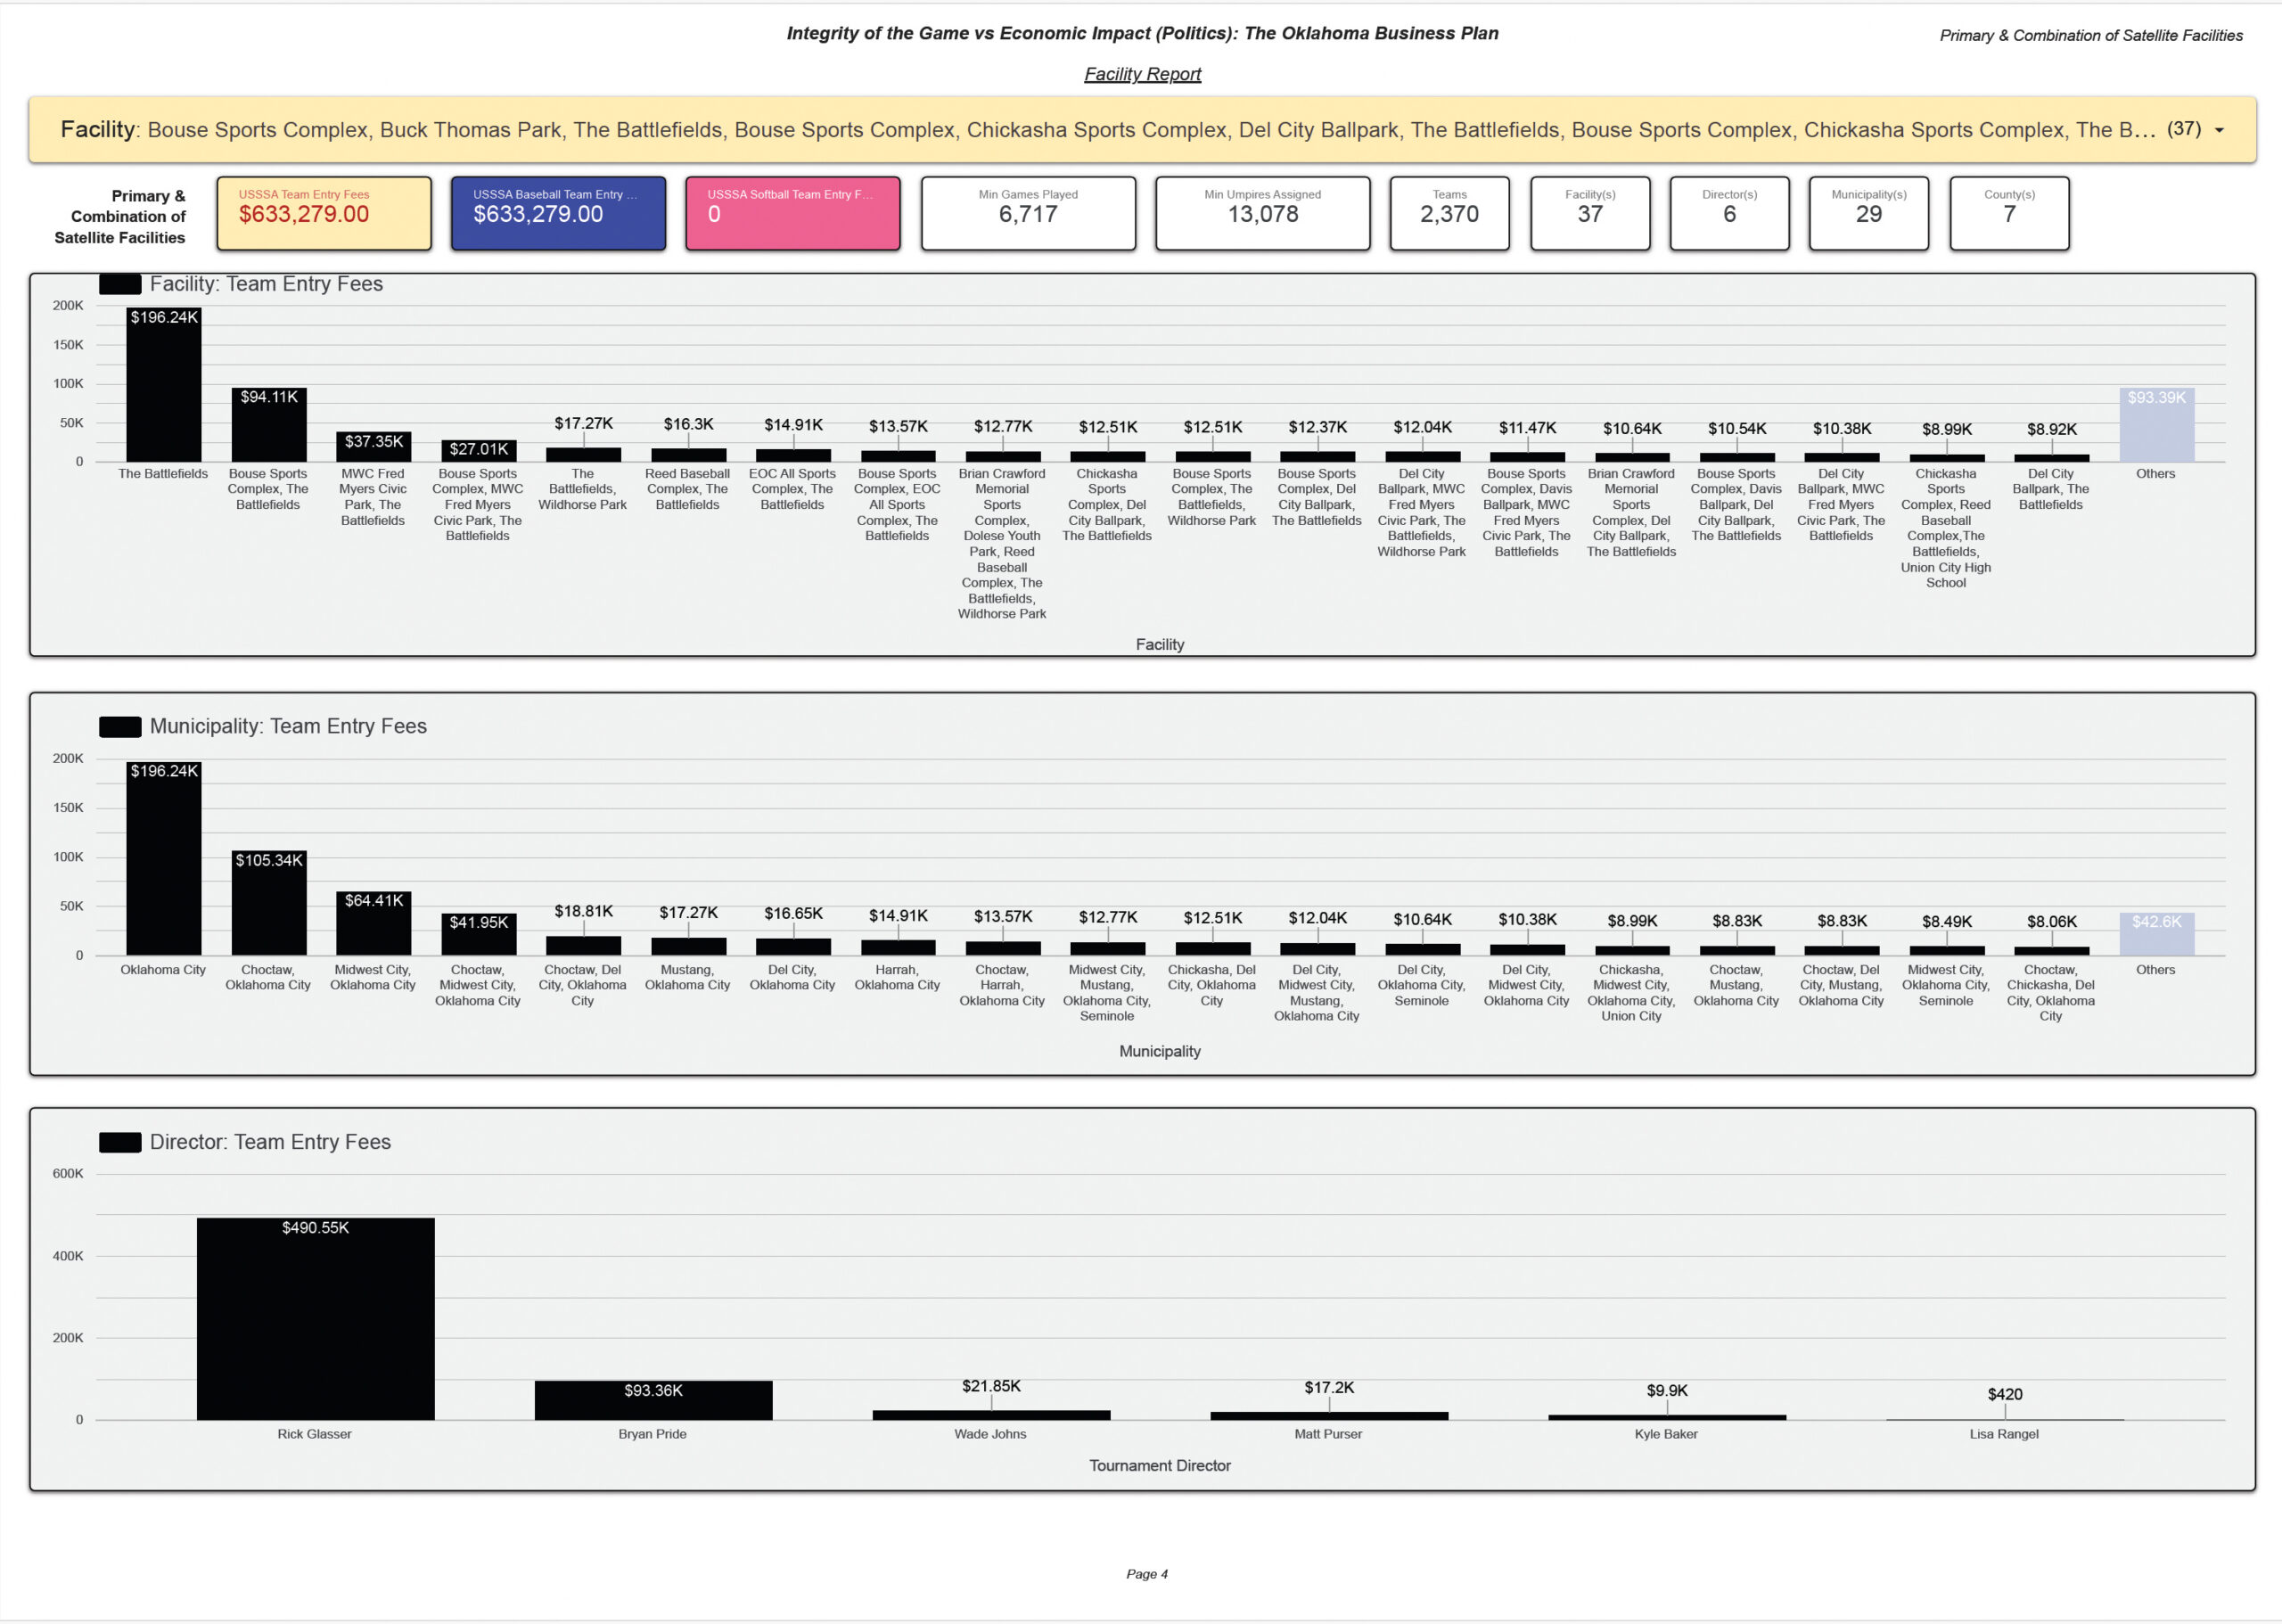
Pages 1–2 direct activity + Page 3 associated multi-facility activity = Page 4 combined documented facility activity footprint. This is the broadest documented activity footprint involving The Battlefields and should not be interpreted as proof that every dollar, team, game, or official occurred exclusively at the Primary Facility.
Leading Combined Concentrations
The combined report view identifies Rick Glasser at approximately $490.55K, Bryan Pride at $93.36K, Wade Johns at $21.85K, Matt Purser at $17.2K, Kyle Baker at $9.9K, and Lisa Rangel at $420.
Oklahoma City represents the $196.24K direct municipal concentration; additional municipality configurations reflect the broader multi-site event network.
Direct, Associated & Combined
Direct
Records listing The Battlefields independently as the event facility. Multi-facility combinations are excluded.
Associated
Records identifying The Battlefields together with one or more additional facilities in a multi-site configuration.
Combined
Direct Primary Facility activity plus associated multi-facility activity, producing the broadest documented footprint.
Calculated Team Entry Fees
Calculated Team Entry Fees are research measurements derived from publicly available USSSA information. They are not, by themselves, verified facility revenue, municipal revenue, director compensation, gross receipts, net income, profit, taxable income, bank deposits, gate revenue, concession revenue, or audited financial statements.
A public record showing a $0.00 Team Entry Fee is recorded as $0.00 and is not automatically treated as proof that no operational activity occurred. The public record alone may not establish whether a local fee existed, whether a fee was waived, or whether historical information is incomplete.
The Battlefields — Oklahoma City
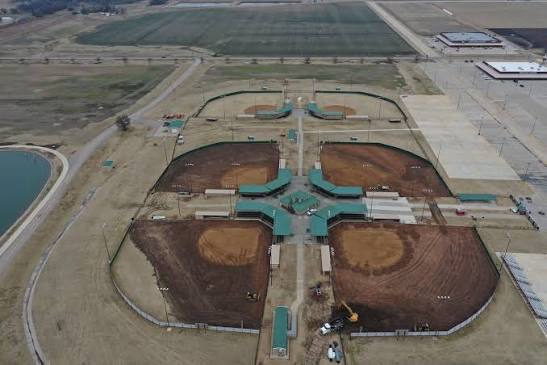
The supplied facility history places The Battlefields at 6011 S Anderson Rd, Oklahoma City, OK 73150. It describes a long-running youth baseball and training location that has operated under different identities over time, including an EOC Baseball Academy era and a later period associated with The Armory.
The supplied history further describes a revitalization by The Battery OKC beginning in late 2025 / early 2026, with work on the outdoor fields, improved infield dirt and grass surfaces, functional lighting, covered spectator seating, Wi-Fi, and access to indoor batting cages and hitting tunnels.
Operational Reach
The direct facility population is concentrated in Oklahoma City and one county. The associated multi-facility population extends across 28 municipality configurations and 7 counties, while the combined footprint spans 29 municipality configurations and 7 counties. The report also identifies facility combinations involving locations such as Bouse Sports Complex, MWC Fred Myers Civic Park, Wildhorse Park, Reed Baseball Complex, EOC All Sports Complex, Del City Ballpark, Chickasha Sports Complex, Brian Crawford Memorial Sports Complex, Dolese Youth Park, Davis Ballpark, and Union City High School.
The appearance of a facility, municipality, county, or director in the dataset establishes a documented association with the public event record. It does not, without additional evidence, establish ownership, employment, revenue sharing, contract terms, payment flows, or allocation of proceeds.
Facility Report Pages 1–4
What This Profile Establishes — and What It Does Not
The public dataset can establish or calculate
- Facility and multi-facility associations
- Teams, sports, seasons and tournament / league classification
- Minimum games and minimum officials
- Tournament directors associated with records
- Municipalities and counties
- Publicly posted Team Entry Fees
- Calculated Team Entry Fees
- Direct, associated and combined analytical populations
The dataset alone does not establish
- Actual payments collected or gross receipts
- Facility or municipal revenue
- Director compensation or personal income
- Profit, taxable income or tax liability
- Bank-account ownership or deposits
- Rental payments or revenue-sharing terms
- Allocation of multi-facility proceeds
- Ultimate disposition of event funds
The Battlefields — Documented USSSA Activity Profile
The Battlefields shows a documented baseball activity footprint across the research period of $196,236 in direct stand-alone Calculated Team Entry Fees and an additional $437,043 in associated multi-facility activity, producing a $633,279 combined documented facility activity footprint. Direct records identify 911 teams, at least 2,243 games, at least 4,278 officials, 6 directors, one municipality and one county. The direct annual series peaks in 2019 at $37.30K.
The broader associated multi-facility population contains 1,459 teams, at least 4,474 games, at least 8,800 officials, 36 facility configurations, 28 municipality configurations, 7 counties, and 3 directors. The largest displayed multi-facility configuration is Bouse Sports Complex + The Battlefields at $94.11K, followed by MWC Fred Myers Civic Park + The Battlefields at $37.35K and Bouse Sports Complex + MWC Fred Myers Civic Park + The Battlefields at $27.01K.
The combined view expands to 2,370 teams, at least 6,717 games, at least 13,078 officials, 37 facility configurations, 29 municipality configurations, 7 counties, and 6 directors. The figures demonstrate documented scale, participation, geographic reach and event association. They do not establish how multi-site activity was allocated or who ultimately collected, retained, distributed or financially benefited from the calculated amounts.
Research, Education, Transparency & Public Interest
Integrity of the Game vs Economic Impact (Politics): The Oklahoma Business Plan and the Hidden Valley — Integrity of the Game dataset are independent research products created for research, educational, public-interest, transparency and analytical purposes. This is not an official USSSA report and is not represented as being prepared, sponsored, endorsed, verified or approved by USSSA, its directors, affiliates, governmental entities, municipalities, tribes, school districts, facility owners or other organizations appearing in the research.
Calculated financial figures are research estimates derived from publicly available information and the methodology described above. They are not audits, tax determinations, forensic-accounting conclusions, legal findings or allegations that any person or organization received, retained, concealed, misreported or improperly used the calculated amounts. Identification of an individual, director, organization, facility, municipality or other entity does not by itself imply wrongdoing, misconduct, tax noncompliance, criminal activity or civil liability.