
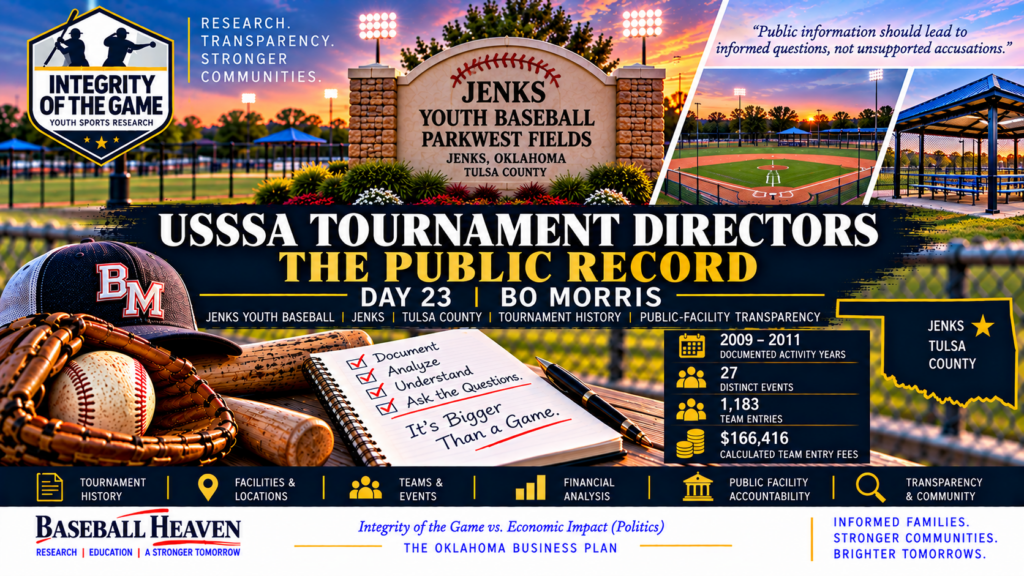
Bo Morris: Jenks Youth Baseball, 27 Historical Event Listings & the Parkwest Accountability Test
November 3, 2026 · 2009–2011 · Jenks, Tulsa County · Baseball tournament historical research
Independent historical analysis of documented activity, published entry-fee calculations, original tournament results and public-facility questions. No allegation of wrongdoing.
1. Source hierarchy, identity and careful counts
The controlling historical baseline is AIUSSSA - HVIOG 9-20-2026.csv, covering 2001–2026. The September 20 director master, annual and facility inventories were available and reconciled, together with the crosswalk and the existing Bo Morris research profile. The underlying division-level file was unavailable; original event IDs, day counts, cancellation codes and all 155 individual entry-fee rows therefore remain not independently reaudited in this installment.
The 27 distinct identifiers are reconstructed source-event counts, not necessarily 27 separate tournament weekends. 1,183 is a count of team-event-division entries, not a count of unique teams. The modeled minimum games and officiating assignments are workload measures, not proof that all games were completed or that thousands of distinct officials worked.
2. Season-by-season dataset totals
| Year | Events¹ | Division rows | Team entries² | Calc. advertised entry fees³ | Min. games⁴ | Official assignments⁴ |
|---|---|---|---|---|---|---|
| 2009 | 7 | 56 | 426 | $52,292 | 1,000 | 1,726 |
| 2010 | 9 | 50 | 387 | $57,600 | 900 | 1,602 |
| 2011 | 11 | 49 | 370 | $56,524 | 854 | 1,475 |
| 2009–2011 total | 27 | 155 | 1,183 | $166,416 | 2,754 | 4,803 |
Source: September 20, 2026 director-by-year and master inventories; same-population internal cross-check. Events: 7+9+11 = 27; division rows: 56+50+49 = 155; team entries: 426+387+370 = 1,183; calculated fees: $52,292+$57,600+$56,524 = $166,416; minimum games: 1,000+900+854 = 2,754; official assignments: 1,726+1,602+1,475 = 4,803. No event-level audit was possible without the original CSV.
The dataset includes a league designation in the supplemental director crosswalk, but the number of historical league entries, any $0 posted-fee divisions, original booked dates and admission days are not verifiable from the available aggregate evidence. A zero posted team entry fee is not evidence of zero local costs, zero audience admission, or any unrecorded fee collections.
3. Jenks Youth Baseball Complex: one venue, one accounting pool
The inventory associates the entire set of 27 events, 1,183 team entries, $166,416 in modeled advertised fees, 2,754 minimum games and 4,803 assignment equivalents with Jenks Youth Baseball Complex, Jenks, Tulsa County. Because this is the same set of records as the Bo Morris director total, those figures must not be added together.
Jenks Youth Baseball currently identifies the primary Parkwest fields as 201 S. Koa Street, Jenks, OK 74037. The City of Jenks describes Parkwest at West Main and Koa, stating that athletic fields are operated and regulated by private organizations. This supports present location/context but does not establish 2009–2011 event-specific field reservations or past operating contracts.
Do not confuse the Parkwest youth baseball fields with the separately named Jenks Sports Complex on S. Elwood Avenue, Morris Park in Glenpool, or school-owned athletic facilities. The current Jenks Youth Baseball description is contemporary context, not historical proof of operator identity or collection rights.
4. Original USSSA event evidence: verified examples
- March Grand Slam, March 5, 2010, 12AA — historical results explicitly states “Results provided by Bo Morris.” View pool schedule and view bracket with field-number references. Neither alone proves venue rental or financial collection.
- March Grand Slam, March 5, 2010, 13AA — separate division results. Same tournament name and date as 12AA. Do not count both results pages as two independent tournament weekends.
- Spring Slugfest, April 9, 2010 — 12A results. The legacy results attribute the posted results to Bo Morris.
- Oklahoma State Championship, June 25, 2010 — 12AA results. Preserves teams and scored bracket results. Does not document admissions or income.
The historical directory lists USSSA director ID 2147499. Its specific individual-profile endpoint could not be independently rendered. The official USSSA director lookup is provided rather than presenting an invented or unverified personal profile URL. The existing Baseball Heaven director research profile is distinct from an official USSSA profile.
Only specific 2010 division result examples were independently recovered in this research run. These examples are not proof that all 27 events occurred, that all 155 original division entries are correct, or that historical events used exactly the modern Parkwest entrance.
5. Transparent gate and concession models — assumptions, not collections
- Admission: $5 assumed per paying spectator per hypothetical admission day; the historical posted gate price is unverified.
- Spectators: 10 or 20 hypothetical paid spectator admissions per team-event-division entry per day; not independently counted visitors.
- Days: one or two hypothetical admission days per entry; not confirmed tournament lengths or league admission days.
- Concessions: hypothetical gross sales are 50% of modeled gate; assumed expenses are 80% of concession gross, leaving a 20% hypothetical contribution.
Equations: team-entry-days = 1,183 × assumed admission days; gate = team-entry-days × assumed spectators × $5; concession gross = gate × 0.50; concession costs = gross × 0.80; hypothetical net concessions = gross − costs.
| Illustrative scenario | Team-entry-days | Gate (modeled) | Concessions gross (modeled) | Concession costs assumed | Net concessions (modeled) |
|---|---|---|---|---|---|
| Lower-attendance, one hypothetical paid day | 1,183 | $59,150 | $29,575 | $23,660 | $5,915 |
| Illustrative base, one hypothetical paid day | 1,183 | $118,300 | $59,150 | $47,320 | $11,830 |
| Two hypothetical paid days, higher exposure | 2,366 | $236,600 | $118,300 | $94,640 | $23,660 |
Worked example: 1,183 entries × 1 assumed paid day × 20 assumed spectators × $5 = $118,300 modeled gate. Concession gross = $118,300 × 50% = $59,150. Costs = $59,150 × 80% = $47,320. Hypothetical net concession proceeds = $11,830.
6. Records-based public-facility oversight questions
- Which field-use agreements, permits and schedules actually governed Parkwest during the 2009–2011 source-listed dates?
- Which organization was authorized to operate the ballfields and charge team entry, gate or concession fees, if any?
- What municipal leases, rental invoices, deposits, waiver decisions or maintenance expenditures exist for these historical events?
- How were league registration fees, sanctioned tournament entry fees and other user fees classified and separated?
- Do completed score sheets, weather cancellations, refunds and field assignments support the dataset’s minimum-game and event-day assumptions?
- What records confirm who was responsible for umpire scheduling and payment, rather than assuming a $40 modeled cost represents a historical wage?
- How did local recreation leagues, scholarships and non-tournament users obtain field access?
- Were any facility or operator names changed, and can property/operating records reconcile those historical identities?
7. Sources and verifiability
- September 20 source methodology and control principles
- Existing Bo Morris director research profile
- Dataset-derived director directory
- Official March Grand Slam historical result
- Official historical bracket
- Official State Championship division result
- City of Jenks parks information
- Jenks Youth Baseball Parkwest location
The source crosswalk and annual totals are consistent, but both originate from the same reconstructed September 20 dataset. Unverified items: all 27 original event-specific source locators and event-ID joins; all 155 row-by-row fee multiplications; league versus weekend counts; $0-fee divisions; advertised historical admission prices; gate transactions; concession receipts/costs; individual compensation; historic contracts; contemporaneous park ownership/operation and event-level addresses.
Standing research disclaimer & corrections invitation
This publication is independent, evidence-based historical research. It is not affiliated with, endorsed by, sponsored by or prepared on behalf of USSSA, Bo Morris, Jenks Youth Baseball or the City of Jenks. Names and historical event associations do not imply wrongdoing. No finding of financial misconduct is made.
Team entry fees are calculated from posted data, not documented receipts. Games and official assignments are modeled minimum equivalents; admissions and concessions are assumption-driven scenarios, not audited figures. Public records may omit cancellations, refunds, waivers or additional costs. The absence of documents from this research does not prove that documents do not exist.
Documented corrections and responses are welcome from any named person, organization, official, family or researcher. Please identify the date/event and provide the primary record or exact URL to Kenneth@BCMSports.net. Verified updates will be reflected transparently.