
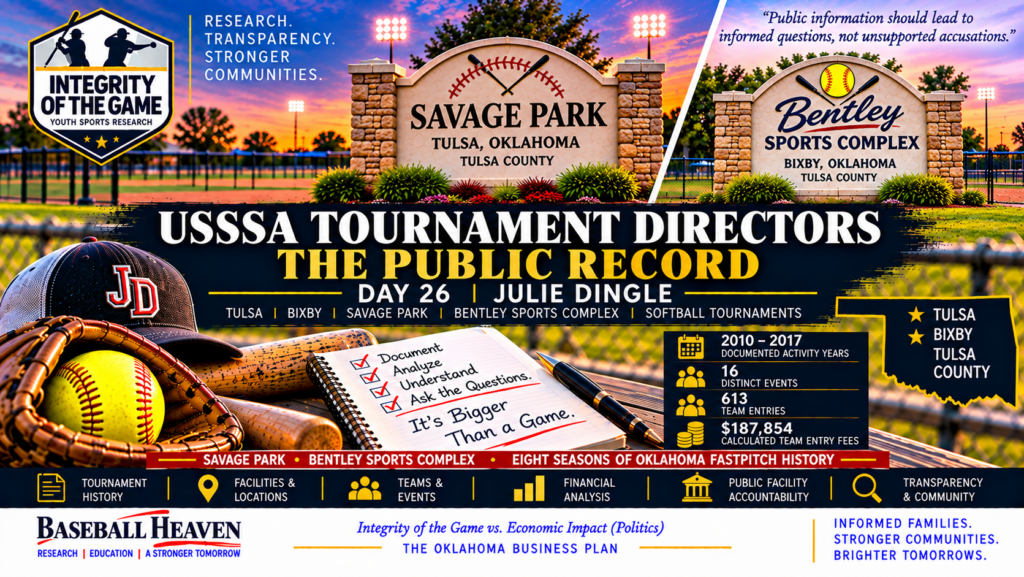
Julie Dingle: Savage Park, Bentley Sports Complex & Eight Seasons of Oklahoma Fastpitch History
2010–2017 | Tulsa & Bixby | Two Facilities, Sixteen Historical Event Identifiers
November 6, 2026 • Research, evidence reconciliation, financial modeling and public-facility transparency
Why This Record Matters
Oklahoma fastpitch tournaments leave a public historical record of participating teams, scheduled games, venues, and event organizers. Today’s entry in USSSA Tournament Directors — The Public Record examines Julie Dingle, whom the controlling September 20, 2026 Hidden Valley dataset associates with 16 event identifiers, 56 division rows, and 613 team-event-division entries between 2010 and 2017. The sport recorded in these rows is softball.
Two enduring USSSA results archives independently name Dingle: the July 20, 2010 USSSA Fastpitch World Series and the June 22, 2012 TGSF State. These independently accessible sources contain teams, game results and links to pool/bracket schedules. The 2010 results explicitly thank participants for visiting Savage Park. The historical sources verify identifiable events, not every underlying dataset row or any financial receipt.
The central accountability question is not whether a director personally received money—the dataset cannot establish that—but how historical event records can be reconciled against public sports-facility agreements, fee policies and reservation records.
1 | Controlling Dataset and Reconciliation
The primary source is the latest available AIUSSSA — HVIOG 9-20-2026(8).csv snapshot, added November 5, 2026. The complete file contains 20,305 division-level rows and 242 distinct nonblank director/organization names. It is not automatically interchangeable with earlier or differently scoped statewide inventories. The prior director crosswalk is used to test calculations, never to supersede the controlling division records.
All 56 Dingle division records were recalculated; team count × advertised per-team fee reconciles to the stored entry-fee field on every row. Divisions belonging to the same season and base TournamentID were consolidated once for event counts. The resulting totals match the September 20 director crosswalk for all ten checked metrics, including the calculated $187,854 entry-fee total, 1,645 minimum games and 3,264 modeled officiating assignments.
Scope: 613 team-event-division entries ≠ 613 distinct teams, unique organizations, paid registrations, or completed appearances.
Annual reconciliation
| Year | Events | Division rows | Team entries | Advertised fees | Min. games | Official assignments | Modeled gate |
|---|---|---|---|---|---|---|---|
| 2010 | 3 | 9 | 90 | $28,997 | 203 | 380 | $33,800 |
| 2011 | 2 | 6 | 80 | $22,320 | 154 | 308 | $24,000 |
| 2012 | 1 | 6 | 64 | $27,712 | 186 | 372 | $19,200 |
| 2013 | 2 | 4 | 53 | $14,611 | 155 | 310 | $15,500 |
| 2014 | 2 | 8 | 80 | $23,120 | 232 | 464 | $24,000 |
| 2015 | 2 | 7 | 89 | $25,721 | 260 | 520 | $23,200 |
| 2016 | 2 | 9 | 89 | $25,721 | 258 | 516 | $23,800 |
| 2017 | 2 | 7 | 68 | $19,652 | 197 | 394 | $20,400 |
| TOTAL | 16 | 56 | 613 | $187,854 | 1,645 | 3,264 | $183,900 |
Minimum games and officiating assignments are source-derived planning equivalents, not a verified final box-score total, staffing roster or payment ledger. The same team could participate in more than one event and is intentionally counted again as a separate event entry.
2 | Facility Register: One Verified Street, One Address Conflict
The dataset identifies Savage Park in Tulsa and one event assigned to Bentley Sports Complex in Bixby, both in Tulsa County. These are separate facility categories. We do not assign any event’s full attendance, entry fees or concession model simultaneously to both sites.
| Facility | Municipality / county | Address evidence | Source events | Team entries | Advertised fees | Minimum games | Official assignments |
|---|---|---|---|---|---|---|---|
| Bentley Sports Complex | Bixby, Tulsa County | Dataset: 8050 E 148th Street; City currently: 8505 E 148th Street South — DISCREPANCY, 2011 address not verified | 1 | 19 | $5,301 | 37 | 74 |
| Savage Park | Tulsa, Tulsa County | 17800 E. 21st Street (street confirmed by City; ZIP not independently established) | 15 | 594 | $182,553 | 1,608 | 3,190 |
Finding: the Bixby street number needs documentary reconciliation
The historical dataset names Bentley Sports Complex at 8050 E. 148th Street. The City of Bixby’s current official facility listing gives 8505 E. 148th Street South, Bixby, OK 74008. The 2011 dataset entry is associated with 19 team entries and $5,301 in calculated advertised fees. The historical street number is unverified; the record should not be silently “corrected” without a 2011 field map, event schedule or reservation record.
The City of Tulsa currently lists Savage at 17800 E. 21st Street and describes selected ballfield complexes as managed by user groups. That corroborates the street location, not the identity of the 2010–2017 operator, legal title, admission policy, specific fee collector or historical agreement. The source CSV includes ZIP code 74134; an independent facility listing has used a different ZIP. Therefore this study treats the ZIP as not conclusively verified and relies on the city-confirmed street location.
Facility evidence: City of Tulsa — Youth Sports/Field Contacts · City of Bixby — Bentley Park Sports Complex
3 | Sixteen Historical Event Identifiers
The register below derives from the base TournamentID + season grouping. Separate source event IDs are kept distinct even when weekends overlap. Overlap alone does not prove the same registration was charged twice, nor does it prove these were separate paid-admission events. No team-identity crosswalk has been verified.
| Year | Start | Event title | Source-listed facility | Divisions | Team entries | Advertised fees | USSSA reference (unverified) |
|---|---|---|---|---|---|---|---|
| 2010 | 6/18/2010 | USSSA State-Oklahoma | Savage Park | 6 | 49 | $12,887 | Source-listed event 1670 |
| 2010 | 6/19/2010 | USSSA State - Oklahoma | Savage Park | 2 | 11 | $1,920 | Source-listed event 1678 |
| 2010 | 7/20/2010 | USSSA Fastpitch World Series | Savage Park | 1 | 30 | $14,190 | Source-listed event 1691 |
| 2011 | 6/24/2011 | TGSF USSSA State Tournament | Savage Park | 5 | 61 | $17,019 | Source-listed event 1877 |
| 2011 | 6/24/2011 | TGSF USSSA State Tournament | Bentley Sports Complex | 1 | 19 | $5,301 | Source-listed event 1882 |
| 2012 | 6/22/2012 | TGSF State | Savage Park | 6 | 64 | $27,712 | Source-listed event 2207 |
| 2013 | 6/21/2013 | USSSA State Championship | Savage Park | 3 | 49 | $13,495 | Source-listed event 2545 |
| 2013 | 6/22/2013 | USSSA State Championship | Savage Park | 1 | 4 | $1,116 | Source-listed event 2556 |
| 2014 | 6/13/2014 | USSSA State Tournament | Savage Park | 5 | 51 | $14,739 | Source-listed event 3227 |
| 2014 | 6/20/2014 | Border Wars - USSSA State Tournament | Savage Park | 3 | 29 | $8,381 | Source-listed event 3238 |
| 2015 | 6/12/2015 | USSSA State Championship | Savage Park | 4 | 54 | $15,606 | Source-listed event 4042 |
| 2015 | 6/20/2015 | USSSA Border Wars | Savage Park | 3 | 35 | $10,115 | Source-listed event 4065 |
| 2016 | 6/10/2016 | USSSA State Tournament | Savage Park | 5 | 59 | $17,051 | Source-listed event 5560 |
| 2016 | 6/17/2016 | USSSA Border Wars | Savage Park | 4 | 30 | $8,670 | Source-listed event 5579 |
| 2017 | 6/9/2017 | USSSA State Tournament - East | Savage Park | 4 | 34 | $9,826 | Source-listed event 6356 |
| 2017 | 6/16/2017 | USSSA Border Wars State | Savage Park | 3 | 34 | $9,826 | Source-listed event 6385 |
Link status: The sixteen modern USSSA event-home links are present in the source CSV but their live content has not been individually corroborated; the CSV references route through a baseball path despite the source sport being softball. Independently confirmed historical fastpitch USSSA results are linked in Section 4. The table is a dataset ledger, not an exhaustive list of actual final brackets.
4 | Independent USSSA Results & Director Identity
July 20, 2010 — USSSA Fastpitch World Series (16B). Original USSSA 2010 results and schedule links names Julie Dingle as results provider and includes 30 teams for the cited 16B division, pool and bracket scores, and a reference to Savage Park. This corroborates one World Series division, not all 2010 records.
June 22, 2012 — TGSF State (12C). Original USSSA 2012 results, pool and bracket identifies Julie Dingle, participating teams and played-game results.
June 22, 2012 — TGSF State (14C). Original USSSA 2012 14C results provides additional division-level tournament corroboration. Multiple division results from one tournament must not be counted as multiple events.
Director profile: The research director directory identifies Julie Dingle as director ID 2525924; the official USSSA director-finder exists, but a reliably accessible individual current USSSA director profile could not be verified. The existing Baseball Heaven research profile is a secondary, published historical summary, not evidence of a current USSSA office.
These results pages are historical source evidence. They do not verify the source CSV's advertised entry-fee figures as payments, identify who collected admissions or concessions, or independently prove all sixteen event schedules.
5 | A Six-Day World Series and the Admission-Day Sensitivity Test
Most listed division rows use three modeled admission days, but the source also includes a six-day division listing for the July 2010 World Series, plus one- and two-day divisions. Using the source's modeled calendar without adjustment produces a different hypothetical gate total from a two-day cap. Neither model establishes that the event charged admission on each modeled date.
The model assumes 20 paying spectators per team entry for each modeled date. Team-event entries can represent repeating people across days; no actual attendance count, gate price, refund or admission receipt has been reviewed.
6 | Gate and Concession Models: All Assumptions Exposed
Working assumptions: 20 hypothetical paying spectator admissions per team-entry per modeled admission day; $5 admission per person per day; hypothetical gross concessions equal to 50% of gate; operating/inventory costs equal to 80% of gross concessions; hypothetical net concession proceeds therefore equal to 20% of gross concession sales, or 10% of the modeled gate.
Formulas: Gate = team entries × days × 20 × $5. Gross concessions = gate × 0.50. Concession costs = gross concessions × 0.80. Net concession proceeds = gross concessions − concession costs.
| Alternative scenario | Gate model | Gross concessions | Concession costs | Net concession proceeds |
|---|---|---|---|---|
| Source-listed modeled calendar | $183,900 | $91,950 | $73,560 | $18,390 |
| Cap charged days at two | $121,500 | $60,750 | $48,600 | $12,150 |
| Two days for every team-event entry | $122,600 | $61,300 | $49,040 | $12,260 |
| One day for every team-event entry | $61,300 | $30,650 | $24,520 | $6,130 |
Scenario calculation example (two-day cap): Gate $121,500 × 50% = $60,750 hypothetical gross concessions; $60,750 × 80% = $48,600 hypothetical operating costs; $60,750 − $48,600 = $12,150 hypothetical net concession proceeds.
These are alternative scenarios, not additive revenues. Source-calendar estimates are not actual admissions. Net concessions are an assumed operational contribution before any other costs, not proof of profit or who received money.
Why the database “Event Net” must not be called profit
The controlling dataset stores $463,704 in modeled Event Income, derived from $187,854 calculated entry fees + $183,900 modeled gate + $91,950 modeled gross concessions. Its $325,814 modeled Event Net deducts $130,560 modeled umpire fees and $7,330 calculated USSSA sanction fees from that modeled income. These arithmetic fields reconcile, but they do not establish real collections, umpire payments, complete expenses or net profits.
Concession-cost sensitivity only: $325,814 − $73,560 assumed concession operating costs = $252,254 before all remaining, unverified operating expenses — still not profit.
Avoid double counting: the source's $463,704 already includes entry fees, gate and gross concessions; these components must not be added to it again. If using net concession proceeds instead, substitute the net figure rather than adding it to gross concessions.
7 | Known Evidence Gaps and Research Controls
- Actual entry-fee receipts: no deposits, payment batches, waived fees, refunds, or reconciliation statements were available; $187,854 is a calculated advertised-fee total.
- Historical site assignment: Savage and Bentley venue labels appear in the source; individual field numbers and proof of all game locations are not available.
- Bentley address: 8050 in the source versus the current city listing of 8505 E. 148th Street South; historical address unresolved.
- Director record: USSSA director lookup exists and the director directory provides ID 2525924; no usable current individual USSSA profile page was independently verified.
- Event links: source-listed modern links are not individually verified and use a baseball URL route for a softball dataset; three historical fastpitch USSSA results links are independently supported.
- Event overlap: distinct event IDs on overlapping weekends are counted once each; duplicative team registrants across events, if any, are unverified.
- Actual admissions or concessions: attendance, gate policy, receipts, cost records, concession operator and retained proceeds not established.
- Historical agreements: ownership/lease/license, insurance, utilities, public subsidy, reservations and operator duties during 2010–2017 not established by later parks webpages.
- Game/officiating counts: 1,645 and 3,264 are modeled minimum-game/assignment equivalents, not certified games played or distinct paid officials.
8 | Public-Facility Oversight Questions
- Who owned and controlled the fields identified as Savage Park and Bentley Sports Complex in the eight historical seasons?
- Which dated agreements, permits, rental schedules or field reservations authorized the corresponding events?
- Was the 2011 Bentley event held at the present-day park address, and why does the source list 8050 rather than 8505?
- Which entity, if any, was authorized by an agreement to collect or retain admissions and concessions at each complex?
- What were the actual admission policies for the six-day 2010 World Series and overlapping state-tournament weekends?
- What capital, maintenance, utilities, staffing or insurance support did public entities provide, if any, during the event years?
- What financial reports, event settlement statements or payments to public entities were contractually required, if any?
- Can original field-by-field schedules substantiate exact historical host facilities and distinct event attendance?
- What did the historical permits say about concession licensing, health compliance, vendor access and food-service control?
- Can event-level participant counts, registration payments and refunds be reconciled against the 56 division entries without conflating repeat teams with unique organizations?
These are questions intended to identify relevant public records. They are not accusations of misconduct against any individual or organization.
9 | Sources, Corrections and Right of Response
Primary source: AIUSSSA — HVIOG 9-20-2026(8).csv, a 20,305-row division-level snapshot most recently available November 5, 2026. Director crosswalk dated September 20, 2026 was used only to check totals. Relevant primary historical USSSA results and official city facility listings are linked above; the entire 16-event source register and calculation worksheets accompany this article.
Baseball Heaven welcomes corrections supported by event schedules, dated park maps, permits, operating agreements, payment reports or other verifiable documents. A clarification from a director, facility operator, city staff member or participating team should be evaluated on the evidence and incorporated into the public correction history where appropriate. Send documentation to Kenneth@BCMSports.net.
Standing Research Disclaimer
Baseball Heaven is an independent educational and public-interest research publication. It is not affiliated with or endorsed by USSSA or by the municipalities identified. Inclusion of any director, person, facility or organization in this historical study does not imply wrongdoing, an allegation, financial impropriety or legal liability.
Calculated advertised team-entry fees are reconstructed from historical listings and may differ from actual paid registrations because of cancellations, discounts, complimentary entries, refunds or other unknown changes. Team-event entries are not distinct teams. Minimum-game and umpire-assignment numbers are source-derived estimates, not verified completed games, distinct individuals or payroll. Gate and concessions are hypothetical models; their assumptions are openly stated and do not represent receipts or personal compensation. Modeled “event income” and “event net” are not verified income or profit. All historical property arrangements and cash-flow authority require contemporaneous documentary verification.
All findings remain open to documented correction. Public information should prompt informed questions, not unsupported accusations.