
Oklahoma Public-School Athletic Facilities & Youth-Sports Tournament Economy
Oklahoma Public-School Athletic Facilities& Youth-Sports Tournament Economy
A statewide research portal examining educational athletic facilities identified within Oklahoma youth-sports tournament records, the scale of associated activity, tournament-network structure, public-asset governance questions, and the evidentiary distinction between facility association and financial allocation.
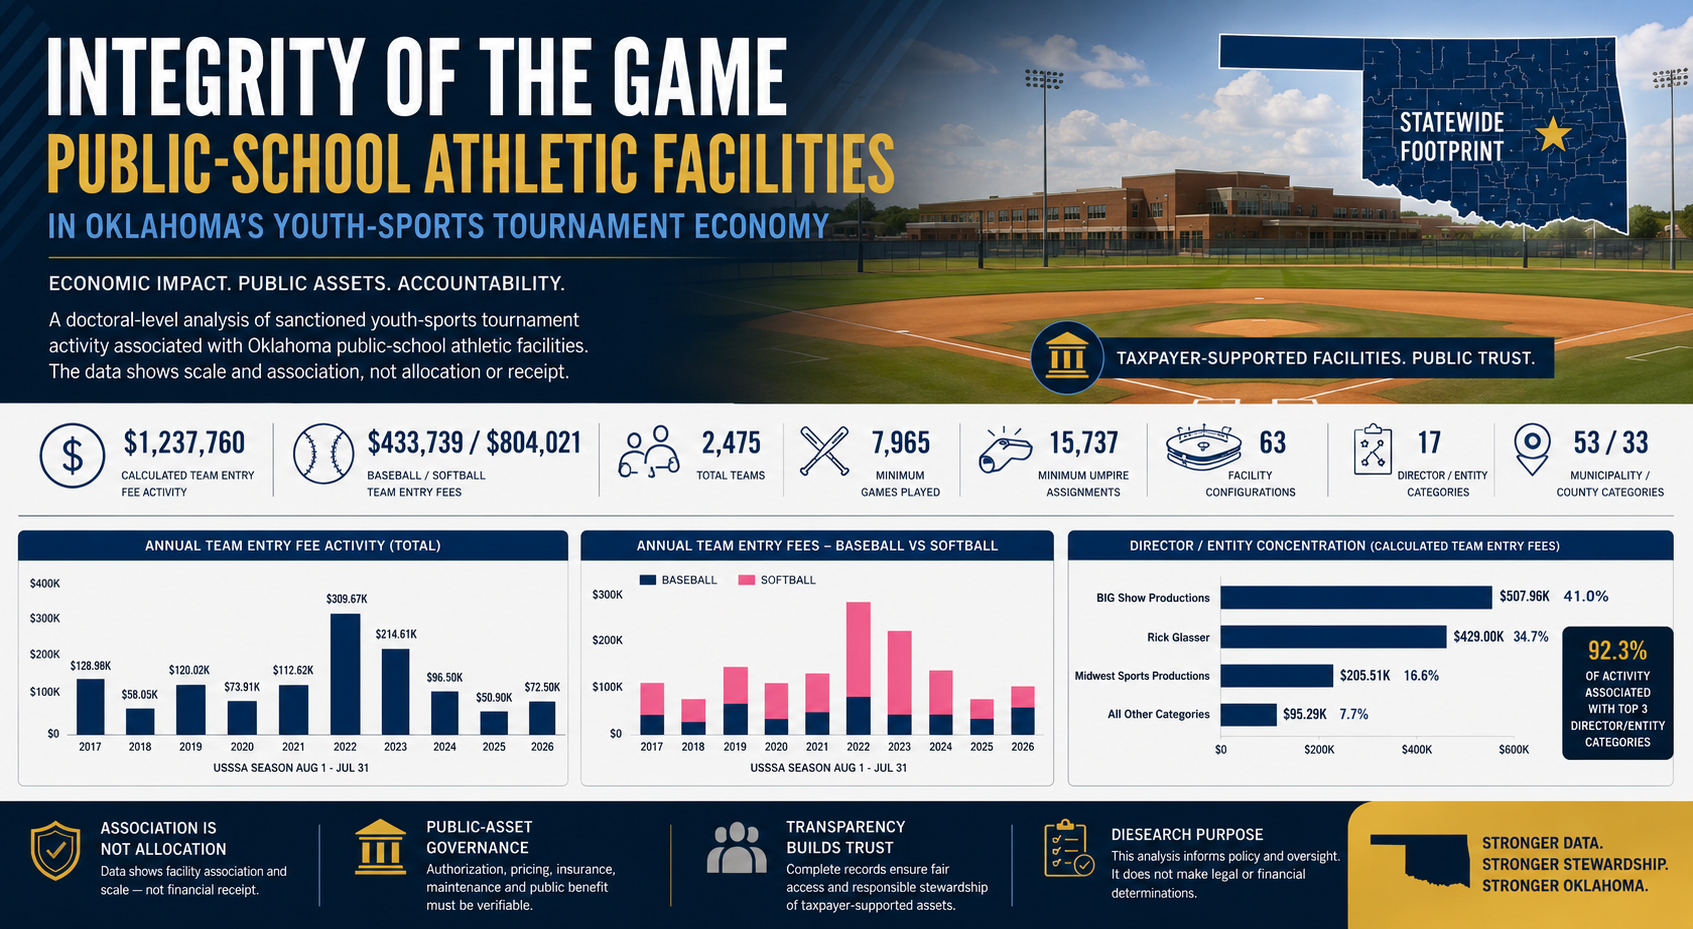
Educational-Facility Associated Tournament Activity
This profile is a statewide thematic analysis rather than a single-facility report. The filter captures records in which an educational facility field is populated. The figures below measure activity associated with those event records and facility configurations.
Facility, Municipality & Director / Entity Concentration
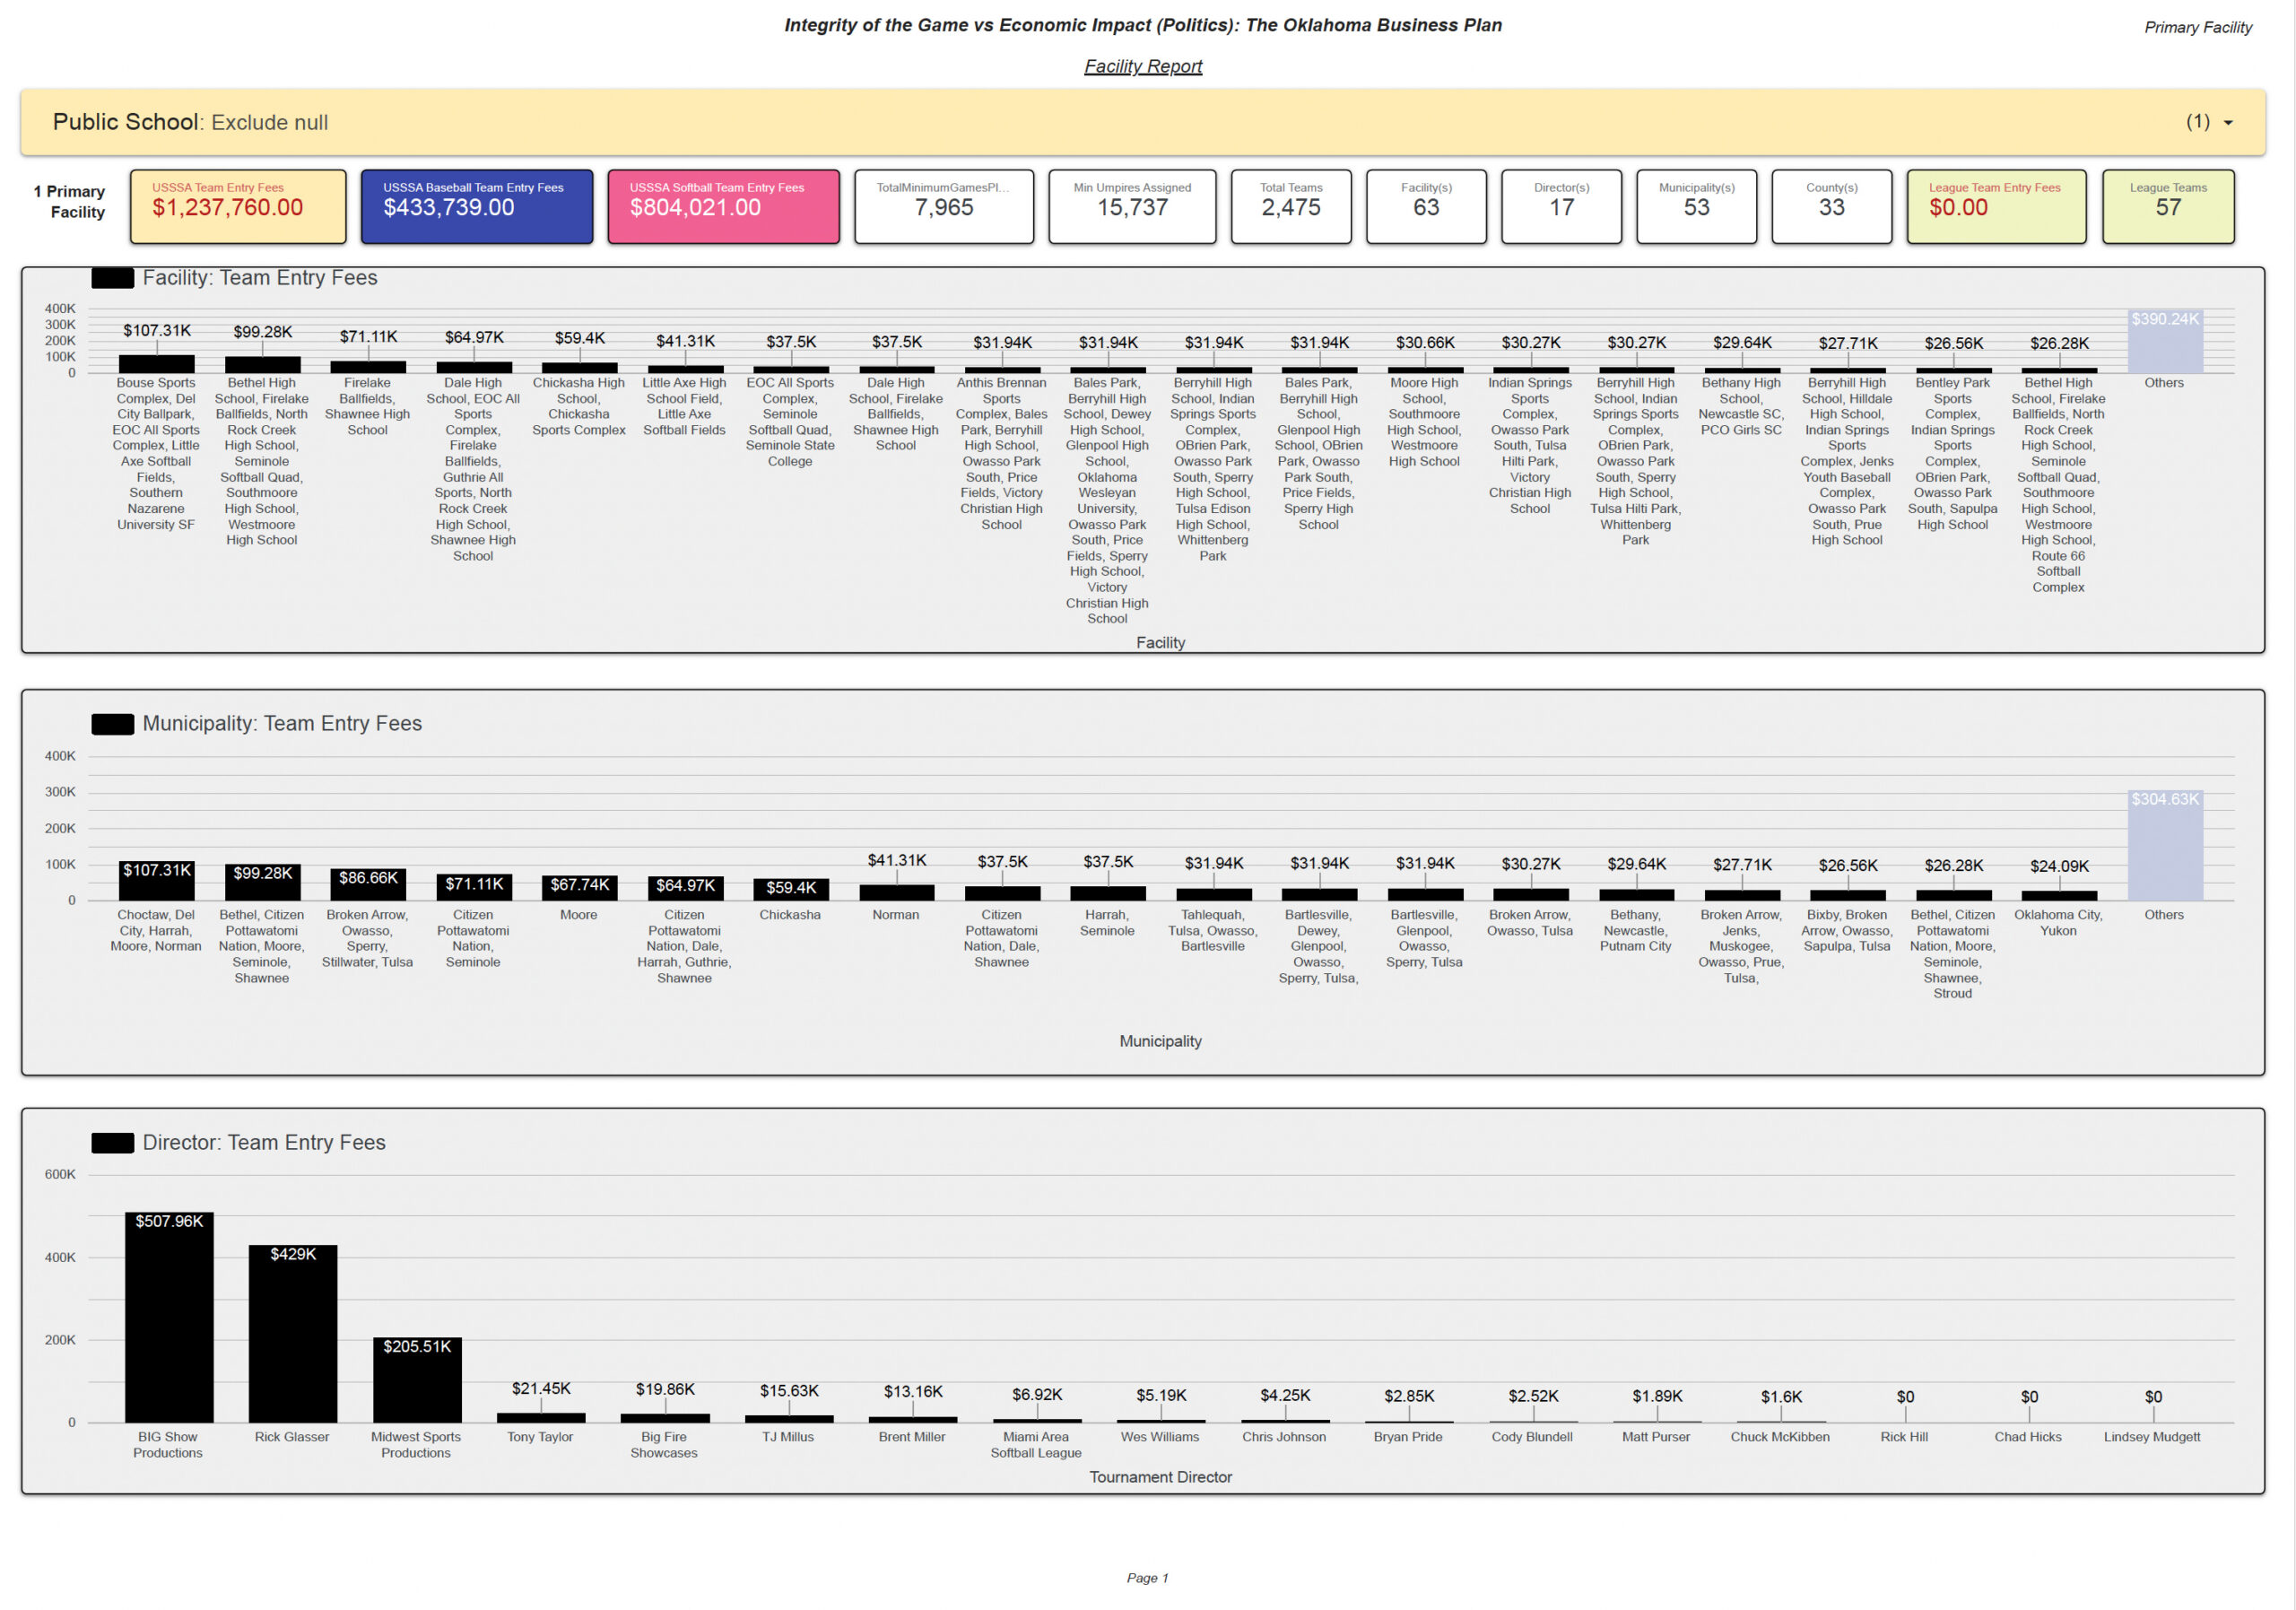
The Page 1 report displays the leading facility configurations, municipality combinations, and tournament director/entity categories within the filtered population. The largest displayed director/entity concentrations are BIG Show Productions at approximately $507.96K, Rick Glasser at approximately $429.00K, and Midwest Sports Productions at approximately $205.51K.
| Director / Entity | Calculated Activity | Approx. Share |
|---|---|---|
| BIG Show Productions | $507.96K | 41.0% |
| Rick Glasser | $429.00K | 34.7% |
| Midwest Sports Productions | $205.51K | 16.6% |
| All other displayed categories | Approx. $95.29K | 7.7% |
Annual Total, Baseball & Softball Trends
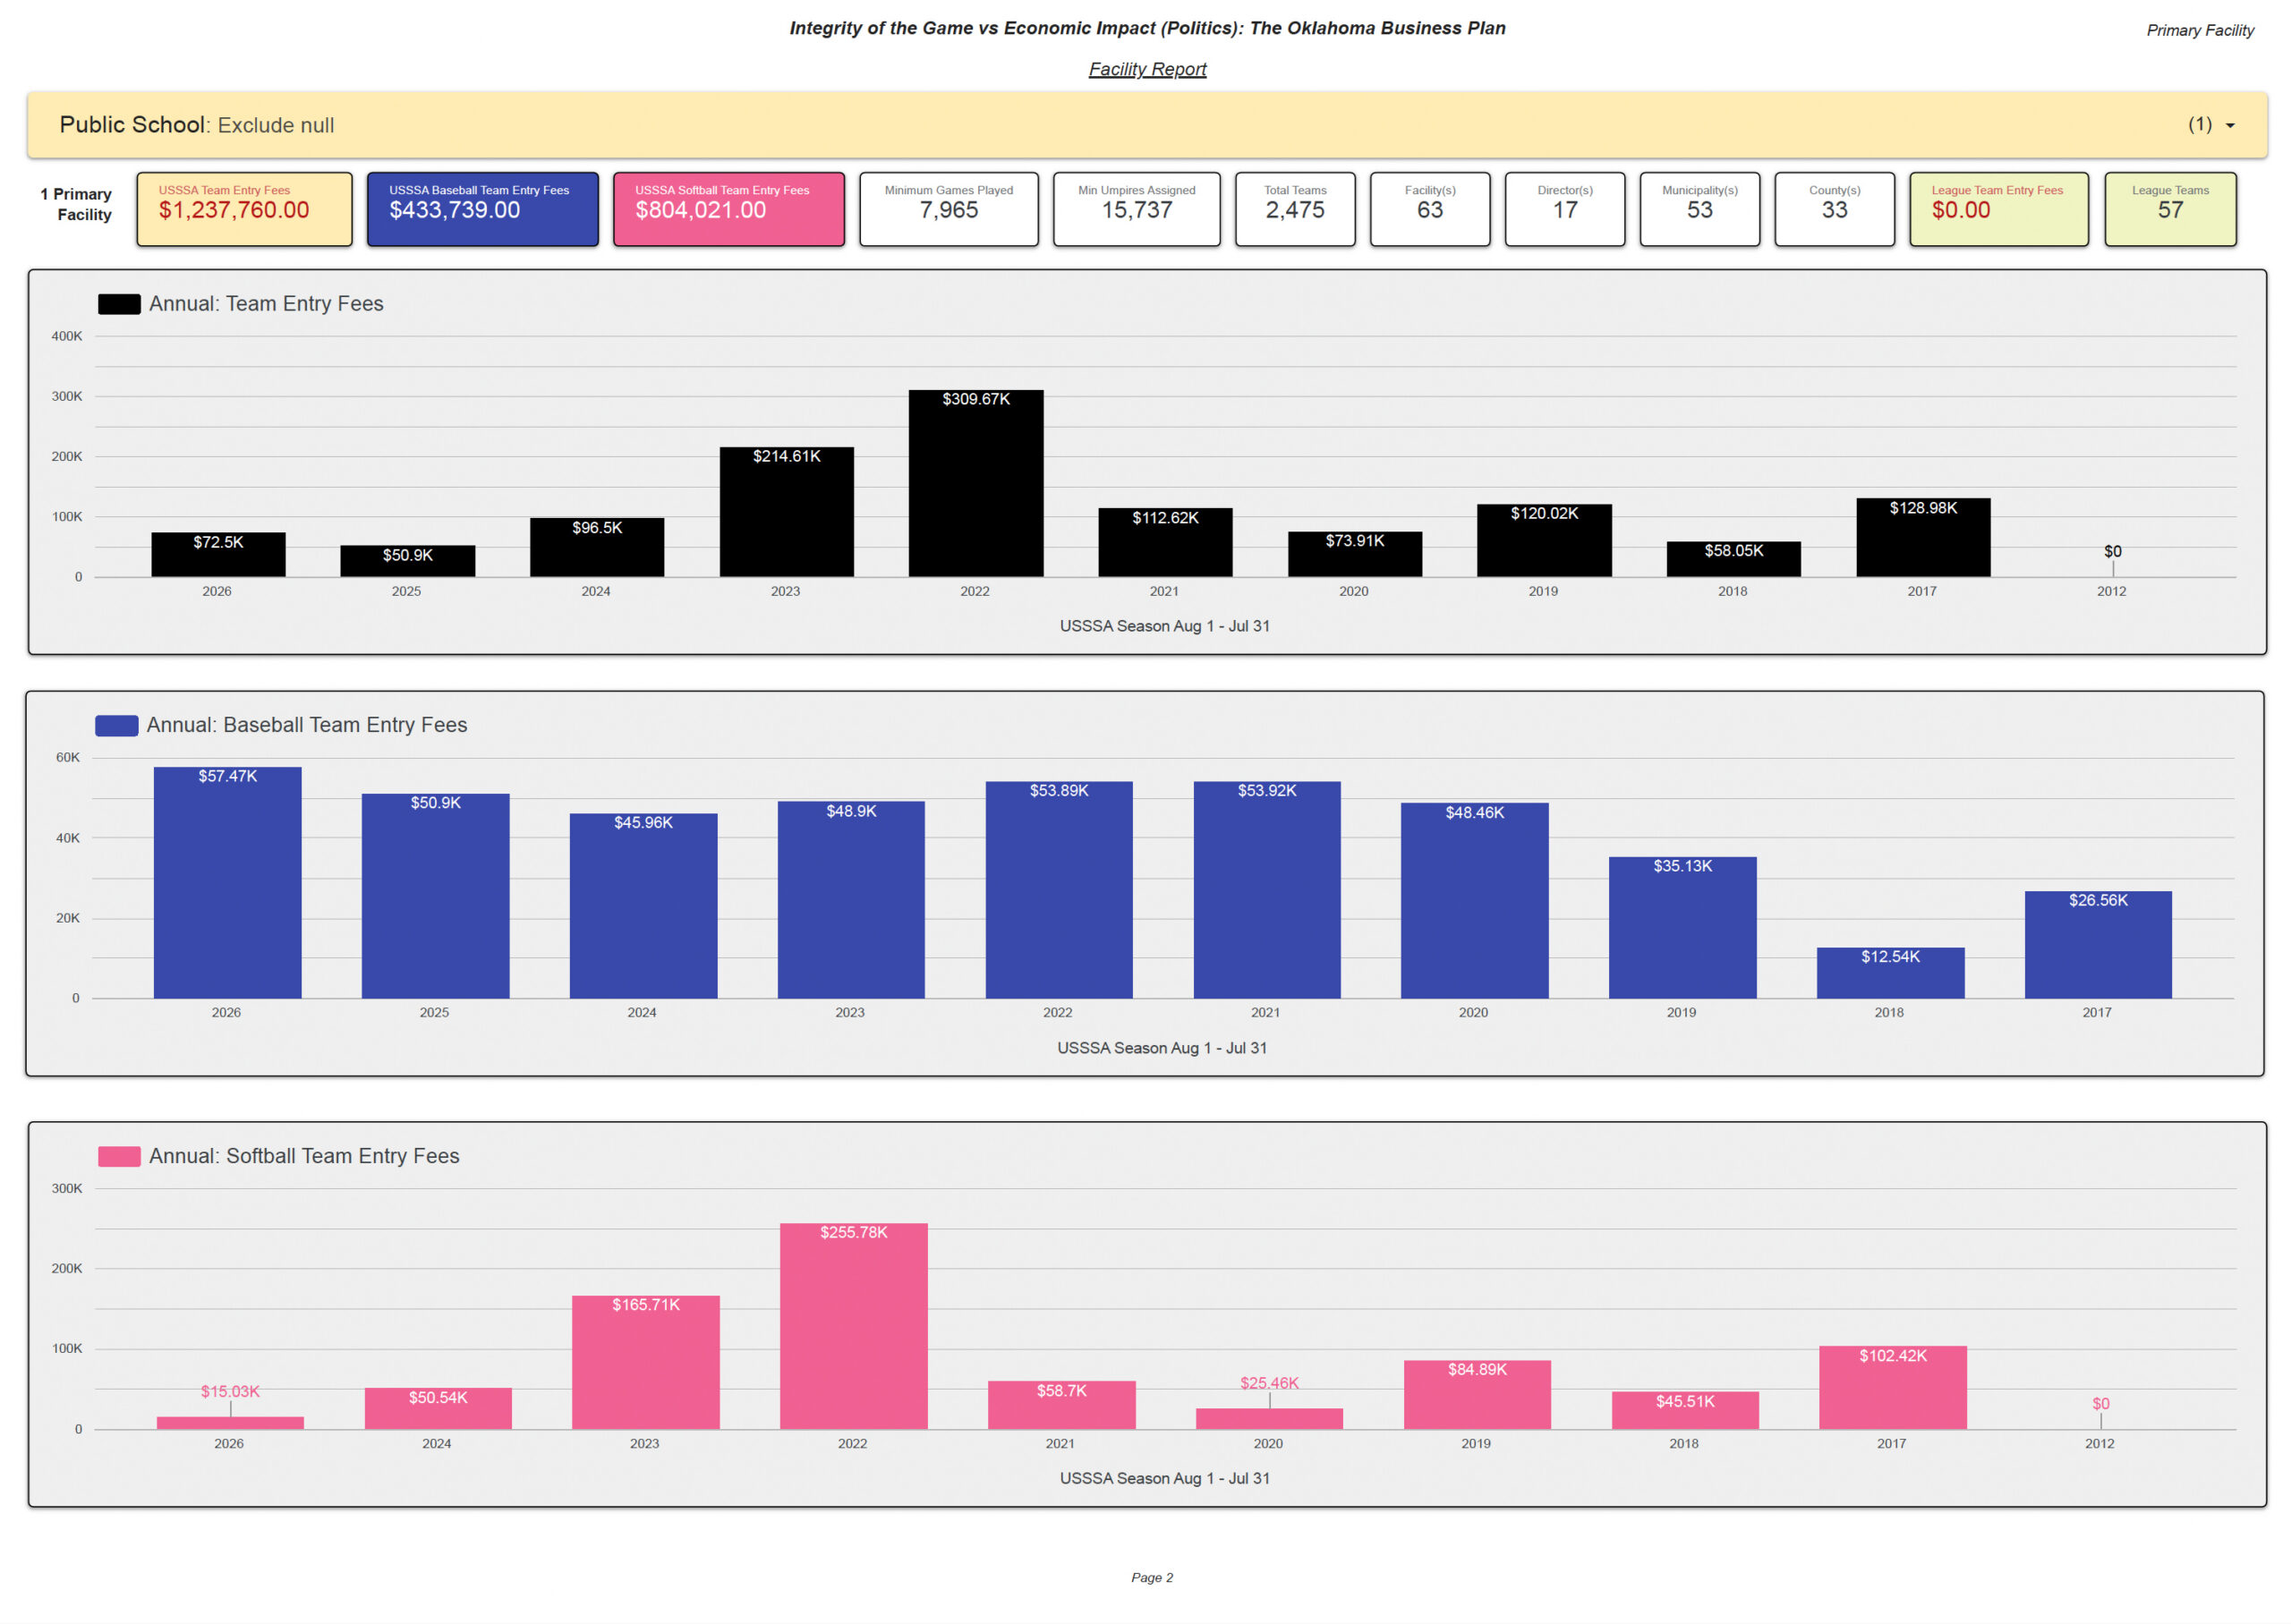
The annual pattern demonstrates recurring educational-facility association across multiple tournament cycles. The largest displayed season is 2022 at approximately $309.67K, followed by 2023 at approximately $214.61K. Softball is the larger component of the filtered activity in several peak seasons.
| Season | Total | Baseball | Softball |
|---|---|---|---|
| 2026 | $72.50K | $57.47K | $15.03K |
| 2025 | $50.90K | $50.90K | — |
| 2024 | $96.50K | $45.96K | $50.54K |
| 2023 | $214.61K | $48.90K | $165.71K |
| 2022 | $309.67K | $53.89K | $255.78K |
| 2021 | $112.62K | $53.92K | $58.70K |
| 2020 | $73.91K | $48.46K | $25.46K |
| 2019 | $120.02K | $35.13K | $84.89K |
| 2018 | $58.05K | $12.54K | $45.51K |
| 2017 | $128.98K | $26.56K | $102.42K |
| 2012 | $0.00 | — | $0.00 |
Educational Facilities as Supplemental Tournament Infrastructure
What the Dataset Shows
Educational facilities repeatedly appear inside event configurations that also include municipal parks, tribal facilities, colleges, private facilities, and other sports complexes. This indicates that educational athletic sites can function as supplemental capacity within larger tournament networks.
What the Dataset Does Not Show
The dataset does not independently establish ownership, lease terms, authorization, facility-use rates, actual collections, school revenue, district revenue, profit, revenue sharing, or how activity was allocated among facilities.
How the Financial Measure Is Constructed
Calculated Team Entry Fees are analytical measurements derived from publicly available tournament information. Without independent financial documentation, they do not establish actual payments collected, gross receipts, facility or district revenue, director compensation, profit, taxable income, bank deposits, net proceeds, gate or concession revenue, or audited financial results.
The report also identifies 57 league teams with $0.00 in displayed League Team Entry Fees. A public $0.00 listing does not prove that no operational activity occurred and should not be replaced with an unsupported fee estimate.
Questions the Data Raises for Policymakers & Auditors
Authorization & Terms
Who approved outside tournament use? What board policies, permits, facility-use agreements, MOUs, rate schedules, or scheduling rules governed access?
Cost Recovery
Were field rental, lights, utilities, custodial labor, maintenance, security, and field preparation billed or reimbursed?
Financial Receipt
What amounts were invoiced, paid, deposited, and recorded? In what district, activity-fund, or institutional account were receipts posted?
Gate, Parking & Concessions
Who held collection rights, and what remittance or revenue-sharing terms applied, if any?
Risk Management
What insurance, additional-insured, indemnification, and incident-response requirements applied?
Public Benefit
What measurable benefit accrued to students, athletic programs, facilities, districts, institutions, or taxpayers?
49 Normalized Educational Facilities / Institutions Identified
The current screening field includes public K–12 schools, public higher education, and private educational institutions. Legal ownership and governance should be classified before describing the entire population as public-school property.
- Berryhill High School
- Bethany High School
- Bethel High School
- Binger High School
- Carl Albert High School
- Cashion High School
- Chickasha High School
- Choctaw High School
- Choctaw Junior High School
- Collinsville High School
- Dale High School
- Del City High School
- Del Crest Middle School
- Dewey High School
- Dibble High School
- El Reno High School
- Glenpool High School
- Hilldale High School
- Little Axe High School Field
- McLoud High School
- Miami High School
- Mid America Christian University
- Midwest City High School
- Minco High School
- Moore High School
- Muldrow High School
- Noble High School Sports Complex
- North Rock Creek High School
- Oklahoma City University SF
- Oklahoma Wesleyan University
- Prue High School
- Putnam City High School
- Putnam City North High School
- Putnam City West High School
- Sallisaw High School
- Sapulpa High School
- Seminole State College
- Shawnee High School
- Skiatook High School
- Southern Nazarene University SF
- Southmoore High School
- Sperry High School
- Tecumseh High School
- Tulsa Edison High School
- Tuttle High School
- Union City High School
- Victory Christian High School
- Westmoore High School
- Yukon Middle School
Public K–12, Public Higher Education & Private Institutions Must Be Separated
Public K–12
District-controlled athletic facilities should be evaluated through school-board policy, district accounting, facility-use agreements, and local public-record documentation.
Public Higher Education
State public higher-education facilities should be analyzed separately because ownership, governing authority, contracting, and accounting structures differ from local school districts.
Private Educational Institutions
Private schools and universities may appear in the event network but should not be characterized as taxpayer-owned public-school property without evidence.
Research Documents
Download the Supporting Reports
Evidentiary Boundaries
Established or Calculated
Educational-facility associations; team entries; sports; displayed seasons; minimum games; minimum umpire assignments; director/entity categories; municipality and county categories; publicly posted fees; Calculated Team Entry Fees; and tournament/league activity.
Not Established by the Dataset Alone
Actual receipts; school or district revenue; director compensation; profits; taxable income; bank ownership; facility rental payments; revenue sharing; allocation of multi-facility proceeds; locally collected fees; legal authorization; or ultimate disposition of funds.
What the Current Data Tells Us
The filtered dataset identifies a statewide pattern of educational athletic facilities appearing within youth-sports tournament and league records carrying substantial calculated activity. The population contains $1.23776 million in Calculated Team Entry Fees, 2,475 team entries, 7,965 minimum games, 15,737 minimum umpire assignments, 63 facility configurations, 17 director/entity categories, 53 municipality categories, and 33 county categories.
The strongest public-policy finding is not that educational institutions received the calculated amounts. Rather, the evidence indicates that educational athletic infrastructure can serve as part of a larger event-delivery network. That creates a legitimate public-accountability question about authorization, cost recovery, accounting, insurance, access, and measurable public benefit where the identified site is a taxpayer-supported facility.
The next phase of research should verify ownership/governance classification for every educational facility and then obtain primary records from the relevant district or institution. That documentary layer is necessary to move from event association to defensible conclusions about authorization, payments, costs, accounting, and public benefit.
This Hidden Valley — Integrity of the Game page is an independent research and analytical publication for research, education, transparency, and public-interest purposes. It is not an official USSSA report and is not represented as sponsored, endorsed, verified, or approved by USSSA or by any government, municipality, tribe, school district, educational institution, facility owner, director, or other organization appearing in the research. Calculated figures are research estimates derived from publicly available information and the stated methodology; they are not audits, tax determinations, forensic-accounting conclusions, legal findings, or allegations. Identification in the dataset does not itself imply wrongdoing, misconduct, tax noncompliance, criminal activity, or civil liability.