
Oklahoma Statewide USSSA Activity Profile
Statewide analysis of publicly available Oklahoma USSSA activity contained in the Hidden Valley research dataset, including tournament and league activity, baseball and softball, teams, divisions, minimum games, minimum required officials, Calculated Team Entry Fees, seasons, municipalities/jurisdictions, counties and facilities.
Profile Scope: Oklahoma Statewide
This page represents the aggregate Oklahoma dataset rather than one named Area Director. USSSA materials state that Tournament Directors at the state level and below are classified as Area Directors and that appointees generally operate as independent contractors rather than employees.

USSSA — Oklahoma Statewide Institutional Profile
Hidden Valley remains the quantitative research engine. Better Together adds the institutional question: what role does a large sanctioning and tournament organization perform within Oklahoma's youth-sports ecosystem, where does that model create value, where does it intersect public facilities and community programs, and what conditions could allow tournament sports and community recreation to coexist?
How the USSSA Model Is Represented in This Research
The Hidden Valley dataset documents statewide Oklahoma USSSA tournament and league activity and provides organizational and payment-process context. It does not, by itself, establish every contractual, financial or operational relationship within the organization.
Competition & Sanctioning Structure
The source report depicts USSSA National → State Director → Area Director → Tournament Director → Tournament/Event → Teams. The statewide dataset measures Oklahoma activity associated with that ecosystem.
Event & Payment Structure
The source report depicts applicable online payments as Teams → USSSA Online Payment System → USSSA → ACH → Event/Fiscal Director → Tournament Operations. Subsequent disposition of event funds is not determined unless independently documented.
Better Together Evidence Standard
Oklahoma Statewide Activity Snapshot
Calculated Team Entry Fees reflect participating teams multiplied by publicly posted Team Entry Fees where a fee is identified. They are calculated economic activity based on public USSSA information and are not represented as USSSA-reported aggregate financial totals.
Updated Statewide Analytical Measures
The September 14, 2026 research dataset contains separate modeled and calculated measures. These measures describe different parts of the tournament economy and should not be added together as though they were independent pools of revenue.
What the Hidden Valley Dataset Represents
Tournament and League Activity
The broader Hidden Valley dataset includes both tournament and league play. Some league records may document teams, divisions, dates, facilities and other operational activity while displaying a $0.00 Team Entry Fee.
$0.00 in Calculated Team Entry Fees does not necessarily mean $0.00 in documented operational activity. The dataset does not estimate or impute an unsupported fee.
Calculated Team Entry Fee Methodology
Participating Teams × Publicly Posted Team Entry Fee = Calculated Team Entry Fees.
These figures should not be interpreted as USSSA-reported revenue, director income, compensation, profit, taxable income, net proceeds or audited financial statements.
Statewide Distribution
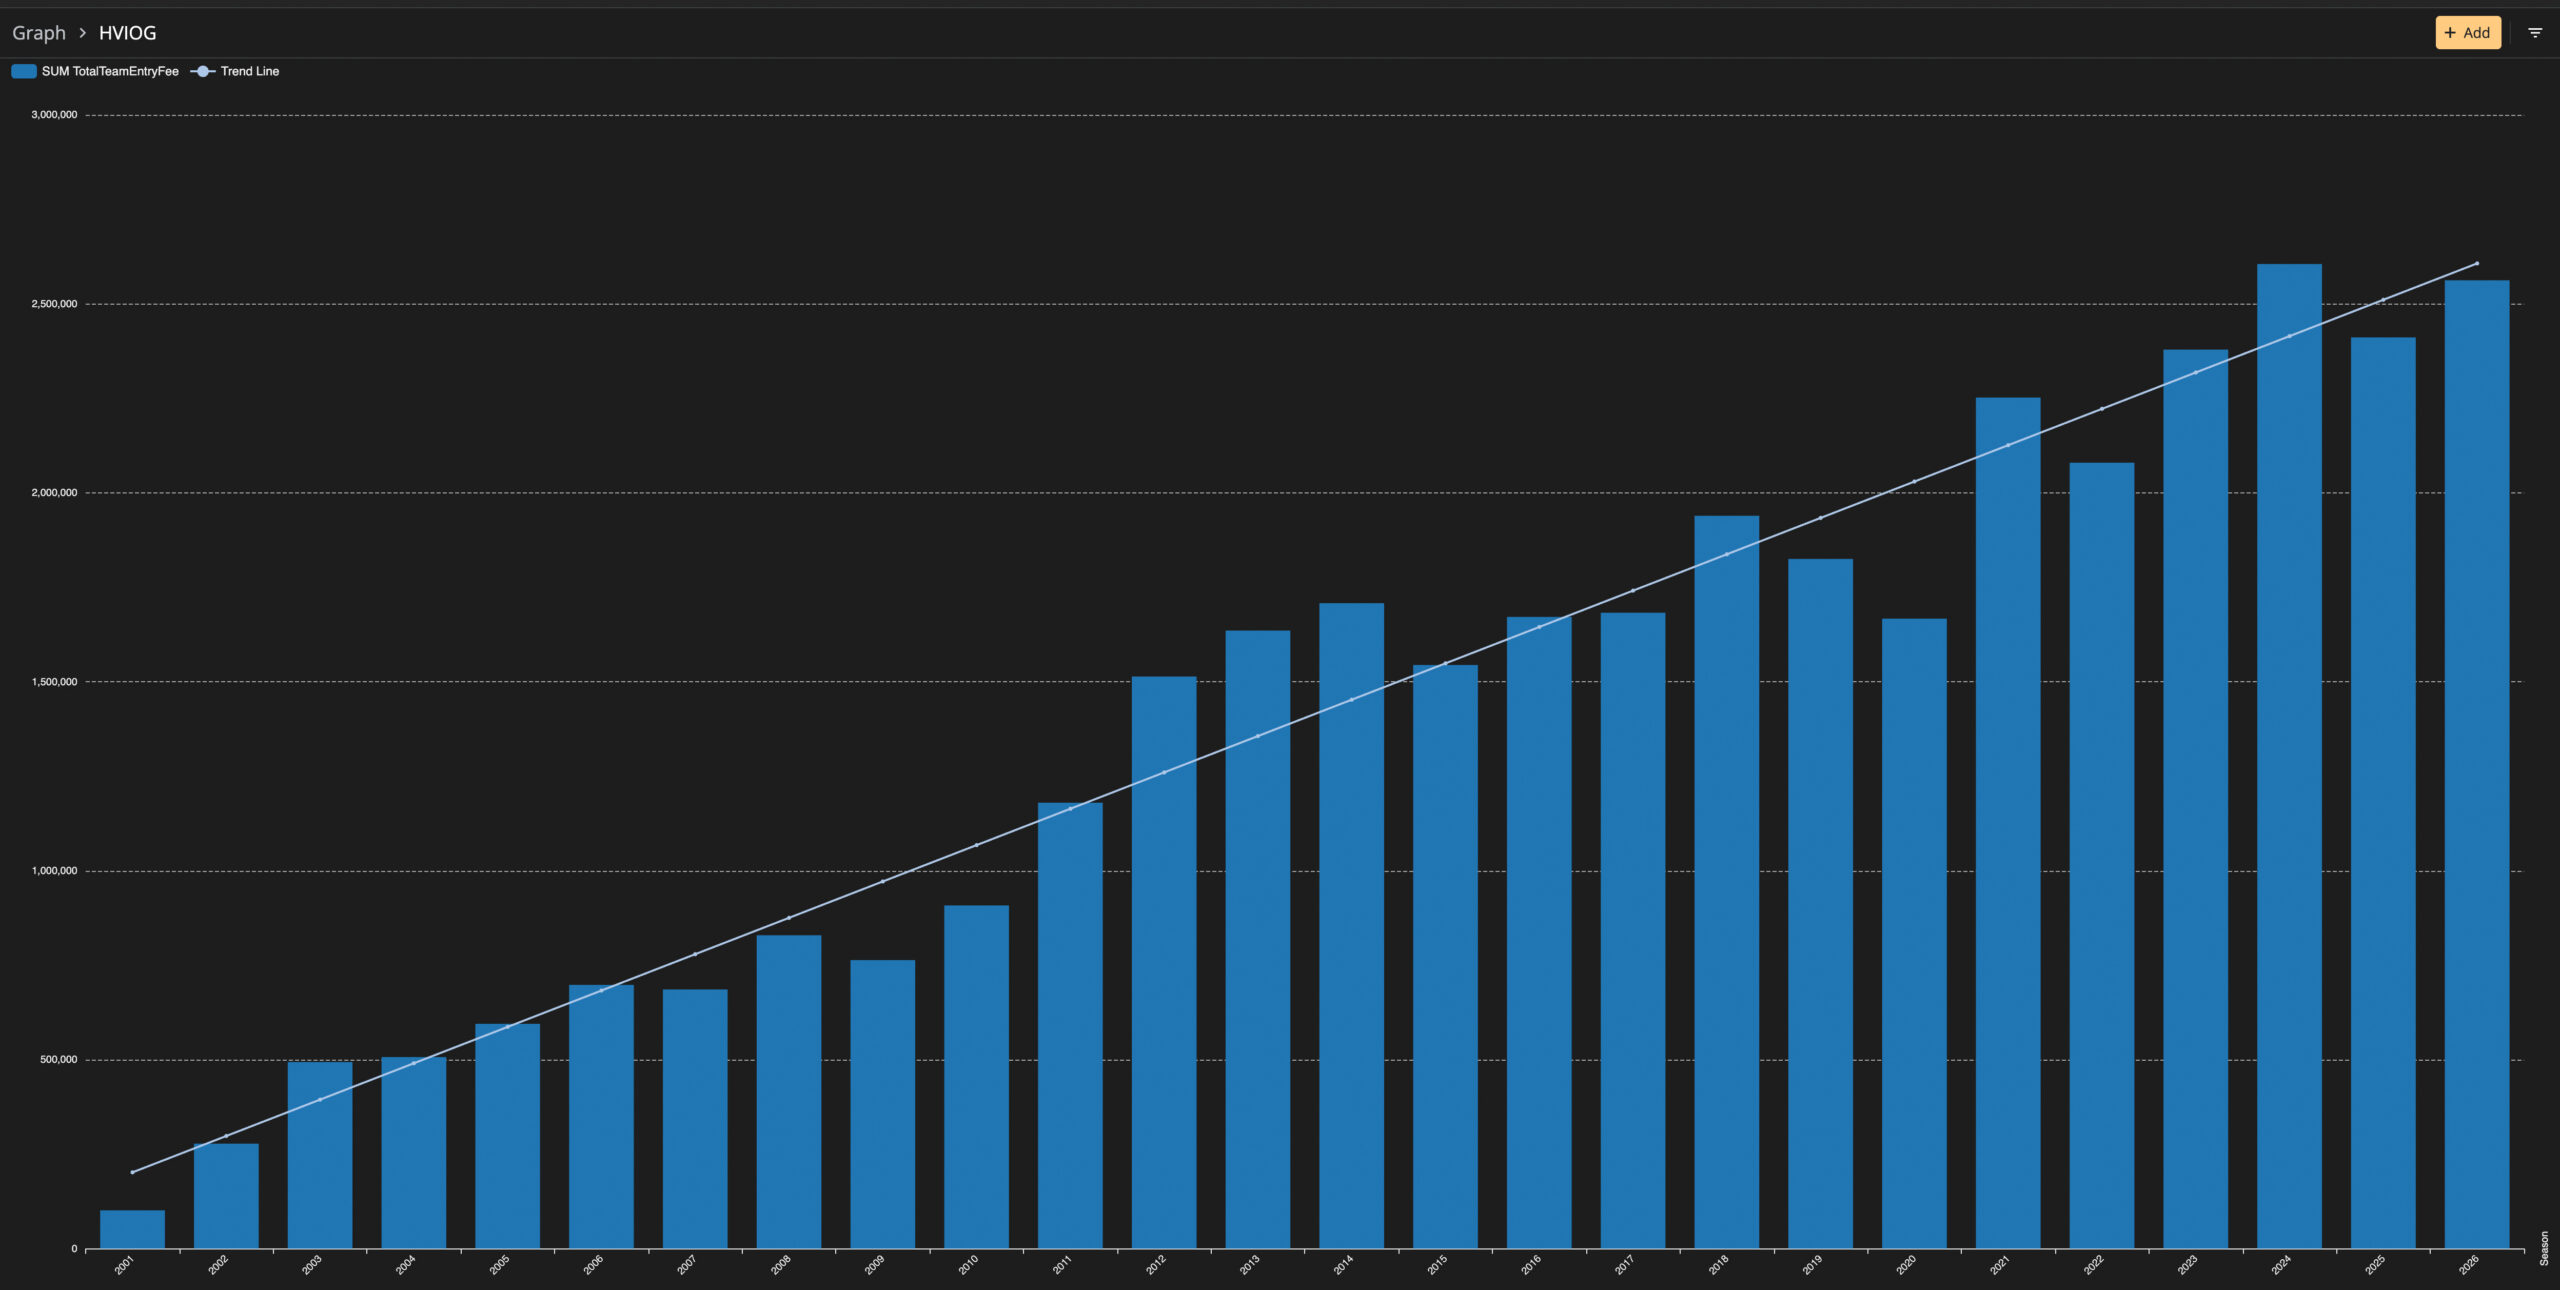
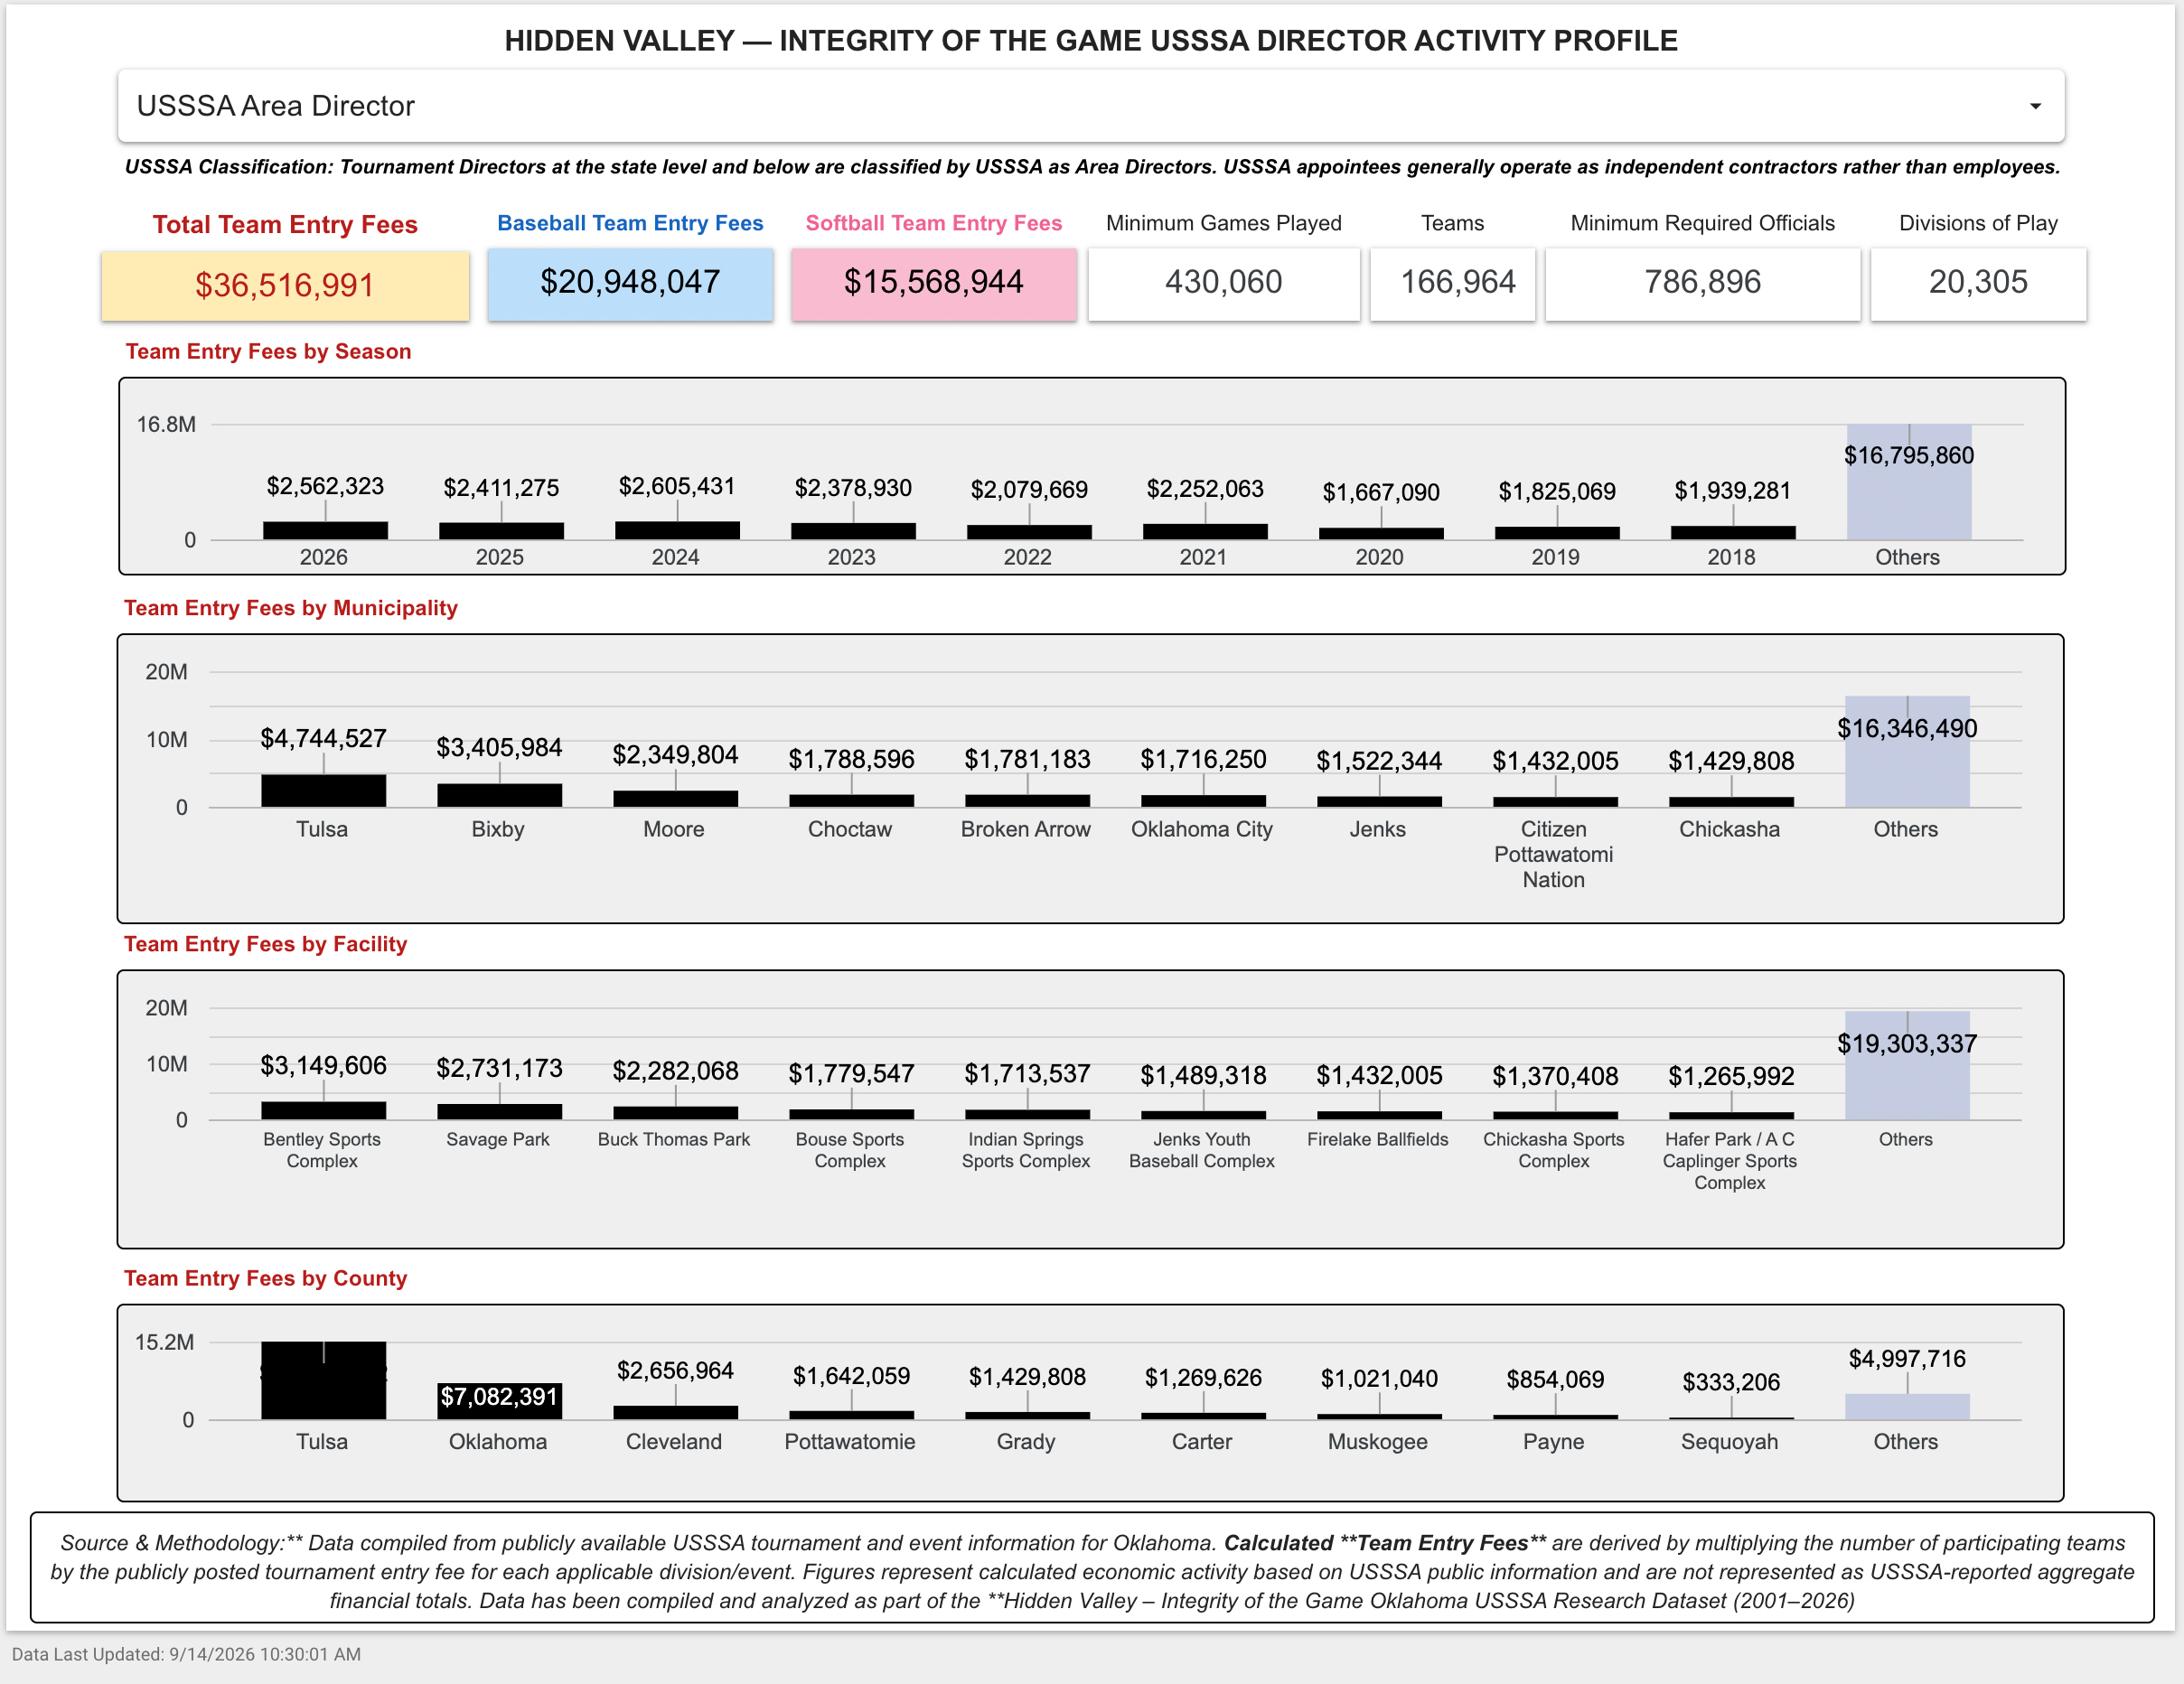
Team Entry Fees by Season
2026 — $2,562,323
2025 — $2,411,275
2024 — $2,605,431
2023 — $2,378,930
2022 — $2,079,669
2021 — $2,252,063
2020 — $1,667,090
2019 — $1,825,069
2018 — $1,939,281
Others — $16,795,860
2024 is the largest individually displayed season. “Others” aggregates additional years not individually displayed.
Team Entry Fees by Municipality / Jurisdiction
Tulsa — $4,744,527
Bixby — $3,405,984
Moore — $2,349,804
Choctaw — $1,788,596
Broken Arrow — $1,781,183
Oklahoma City — $1,716,250
Jenks — $1,522,344
Citizen Potawatomi Nation — $1,432,005
Chickasha — $1,429,808
Others — $16,346,490
These amounts represent geographic associations in event records and should not be interpreted as municipal or tribal revenue.
Team Entry Fees by County
Tulsa — $15,230,112
Oklahoma — $7,082,391
Cleveland — $2,656,964
Pottawatomie — $1,642,059
Grady — $1,429,808
Carter — $1,269,626
Muskogee — $1,021,040
Payne — $854,069
Sequoyah — $333,206
Others — $4,997,716
Why the “Others” Categories Matter
The statewide dashboard intentionally displays leading categories and aggregates the remainder. The “Others” totals are substantial: $16,795,860 by season, $16,346,490 by municipality/jurisdiction, $19,303,337 by facility/configuration and $4,997,716 by county/configuration.
These aggregated categories demonstrate that statewide activity extends substantially beyond the individually displayed top categories.
Team Entry Fees by Facility
Facility classifications require careful interpretation. Multi-facility categories represent one pool of Calculated Team Entry Fee activity associated with the combined facility configuration and should not be duplicated across individual facilities.
Statewide Research Visuals
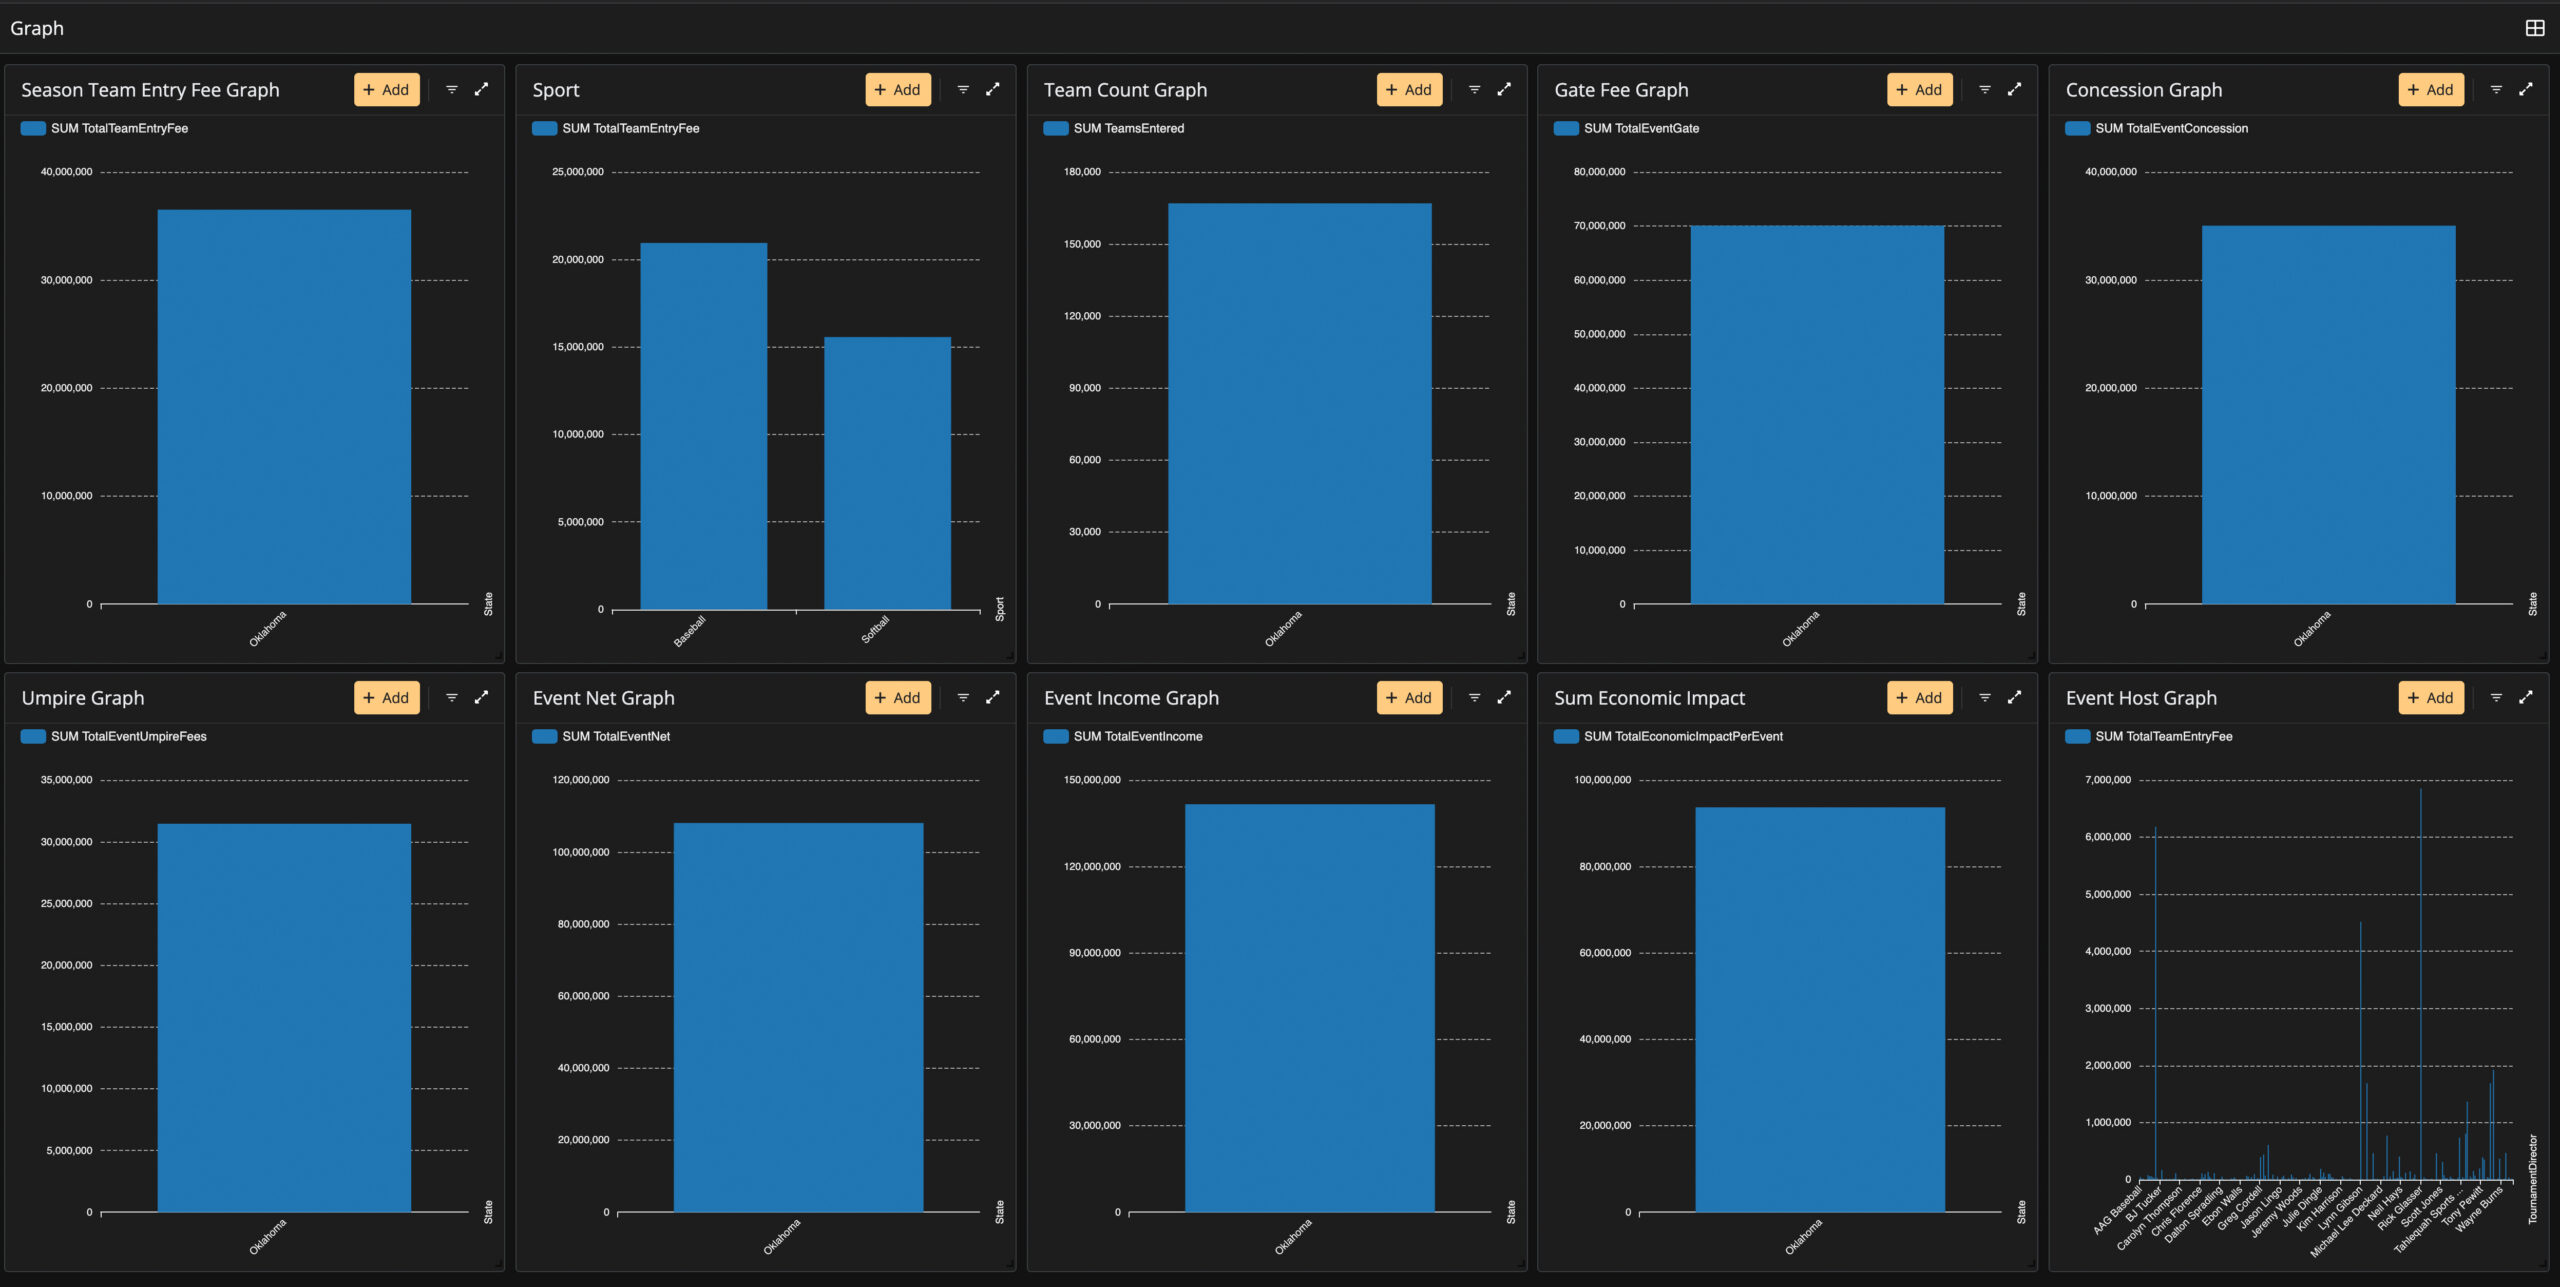
Oklahoma USSSA Activity Profile Report
The visual report below presents the statewide Director Activity Profile dashboard. Use the PDF buttons for the full report and professional statewide summary.
What This Statewide Profile Establishes — and What It Does Not
Publicly Documented / Calculated
- Statewide Oklahoma USSSA activity represented in the underlying public information.
- Baseball and softball Calculated Team Entry Fees.
- Teams, divisions, seasons, minimum games and minimum required officials.
- Municipality/jurisdiction, county and facility associations.
- Tournament and league activity contained in the broader Hidden Valley dataset.
- $0.00-fee records may still represent documented operational activity.
Not Established by This Dataset Alone
- Personal income or compensation to any individual director.
- Actual event net profit, taxable income or audited financial results.
- Allocation of multi-facility event proceeds or facility revenue.
- Whether a $0.00-fee league collected fees locally.
- Ownership, legal liability, tax liability or ultimate disposition of event funds unless independently documented.
USSSA Organizational & Financial Structure
The source report provides organizational and payment-process context rather than additional statewide financial findings. It depicts the organizational authority flow as USSSA National → State Director → Area Director → Tournament Director → Tournament/Event → Teams.
The financial-flow portion depicts applicable online event payments as Teams → USSSA Online Payment System → USSSA → ACH → Event/Fiscal Director → Tournament Operations. The subsequent disposition of event funds is not determined by the dataset unless independently documented.
Oklahoma Statewide Profile Summary
September 14, 2026 Dataset Revision
Where the USSSA Model Appears to Create Value
Better Together requires examination of documented capacity and potential strengths, not only accountability questions.
Large-Scale Playing Opportunity
The dataset documents substantial baseball and softball activity across seasons, communities, counties and facilities.
Baseball and Softball
The September 14 profile contains $20,948,047 in baseball and $15,568,944 in softball Calculated Team Entry Fee activity.
Facility Utilization
Activity appears across numerous Oklahoma facilities and jurisdictions, creating a broad evidence base for examining tournament demand and local infrastructure.
Officials Demand
The dataset models 786,896 minimum required officials, demonstrating the scale of shared workforce demand associated with documented activity.
Where the Model Raises Structural Questions
Public-Facility Intersection
Facility activity does not establish rental terms, revenue sharing or community-program effects.
Financial Transparency
Calculated and modeled activity establishes analytical scale but not individual income, audited profit, tax liability or ultimate disposition of event funds.
Shared Officials Workforce
Tournament demand may intersect the officials pool used by community leagues and schools; actual effects require workforce evidence.
Community Recreation
The dataset alone does not establish whether tournament activity complements, competes with or displaces community programs at a particular facility.
What We Still Don't Know
Public Facilities
How much statewide activity occurs on publicly owned facilities, and what contractual terms govern access?
Community Benefit
How much tournament-related facility revenue, if any, is reinvested into community recreation, maintenance or capital improvements?
Scheduling & Access
How does tournament scheduling interact with community leagues, schools and other local users?
Participation
What do independently verified statewide baseball and softball participation trends show across community and travel models?
Officials Development
What role does USSSA play in recruiting, training, evaluating and retaining the shared Oklahoma officials workforce?
Successful Coexistence
Where are Oklahoma communities already demonstrating that community recreation and tournament sports can share facilities successfully?
Better Together Collaboration Opportunity
The research question is not whether Oklahoma should choose community recreation or tournament sports. It is what each model is best equipped to provide and what safeguards allow both to serve families and communities.
What USSSA Can Contribute
Competition infrastructure, scheduling capacity, sanctioning systems, baseball and softball event opportunities, team networks, tournament expertise and demand capable of supporting regional facilities and officials.
What Oklahoma Communities Can Contribute
Transparent facility agreements, protected community access, sustainable maintenance, clear scheduling priorities, accountable public-asset stewardship, officials-development partnerships and evidence-based measurement of community benefit.
Research & Methodology Disclaimer
This page is an independent research and analytical publication and is not affiliated with, endorsed by, sponsored by, or prepared on behalf of USSSA (United States Specialty Sports Association) or any governmental entity. Information is compiled from publicly available USSSA tournament/event information, USSSA materials, public records and related research materials.
Calculated Team Entry Fees are estimates derived from publicly reported team participation multiplied by publicly posted Team Entry Fees where a fee is identified. They should not be interpreted as USSSA-reported revenue, director income, profit, taxable income or audited financial statements.
Public records and online information may contain omissions, revisions, errors, cancellations, refunds, discounts, payment adjustments or other circumstances that cannot be independently verified from public information alone. The Hidden Valley methodology does not fill evidentiary gaps with unsupported assumptions.