
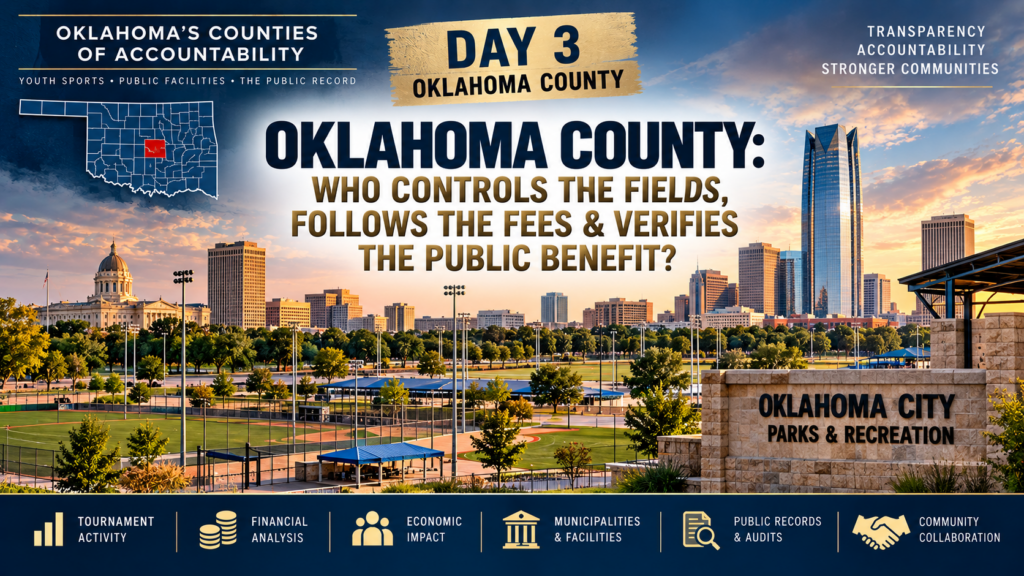
Oklahoma's Counties of Accountability • Day 3 • October 18, 2026
Oklahoma County: Who Controls the Fields, Follows the Fees & Verifies the Public Benefit?
Oklahoma City • Edmond • Choctaw • Midwest City • Harrah • Del City • Combined-site activity | Hidden Valley, 2001–2026
Oklahoma County brings together municipal parks, youth leagues, independent tournament directors, privately branded complexes and intercity tournaments. Who owns a field, who schedules it, and who receives fees can be three different answers. This day-three research provides every countywide calculation, comparable municipality/owner tables, exact multi-site holding rows and public-record questions—without passing estimates off as collections or proven new economic benefit.
County field is exactly Oklahoma. It includes 19 rows with potentially inconsistent geographic labels that require primary-host confirmation; 215 separate cross-county source rows are excluded. These are provisional dataset calculations, not a determination of which physical site hosted every event.1. Oklahoma County: historical tournament and financial activity
The following amounts come directly from source division rows, except illustrative net concessions, which applies an explicitly hypothetical 50% margin to the source modeled gross concession field. Gross entry fees, gate and concessions are not retained income or government receipts. Dates span source seasons 2001–2026.
| Measure | Source or scenario result | Measurement / warning |
|---|---|---|
| Source county label | Oklahoma | Exactly matches the County field; 19 geography questions remain |
| Division rows | 3,421 | Division-level records, not unique tournaments |
| Distinct events | 913 | Seasonid + base TournamentID (strip division suffix) |
| Team participations | 29,410 | Count of team entries; not unique lifetime organizations |
| Gross calculated entry fees | $7,082,391 | Source TotalTeamEntryFee; not audited receipts |
| Minimum games | 77,610 | Stored historical minimum-game model |
| Officiating assignment slots | 141,978 | Scheduled/estimated assignments; not unique people |
| Modeled umpire expenses | $5,679,120 | Source row fee/pay model; not payroll audit |
| Modeled gate | $12,412,400 | Attendance × admission × event days |
| Modeled gross concessions | $6,206,200 | Source model equals 50% modeled gate in this county extract |
| Illustrative net concessions @ 50% | $3,103,100 | Hypothetical margin; NOT a dataset net-sales field |
| Modeled USSSA sanction fees | $348,985 | Source component total; no proof of payment |
| Modeled day trips | $3,056,985 | Visitor spending proxy, not verified |
| Modeled overnight stays | $15,364,974 | Visitor spending proxy, not verified |
| TOTAL modeled visitor spending | $18,421,959 | Sum of historical source-row models; NOT incremental local benefit |
2. Municipality / geographic activity — fully reconciled
The Municipality field is a research-location label, not evidence of ownership, receipt of admissions, or exclusive municipality control. Combined-city strings are assigned as a single unallocated geographic bucket; amounts are not split between locations. Event counts within groups are non-additive.
| Source municipality / owner group | Unique events* | Division rows | Teams | Gross entry | Minimum games | Official slots | Modeled umpire expense |
|---|---|---|---|---|---|---|---|
| Edmond | 268 | 1,307 | 9,520 | $1,339,193 | 20,814 | 35,886 | $1,435,440 |
| Oklahoma City | 264 | 911 | 7,165 | $1,716,250 | 18,765 | 35,010 | $1,400,400 |
| Choctaw | 225 | 545 | 5,929 | $1,788,596 | 17,703 | 33,327 | $1,333,080 |
| Midwest City | 93 | 266 | 2,415 | $749,397 | 6,785 | 13,036 | $521,440 |
| Multi-municipality / unspecified (owner unallocated) | 65 | 183 | 2,646 | $1,022,824 | 8,665 | 16,604 | $664,160 |
| Harrah | 66 | 118 | 1,049 | $284,499 | 3,206 | 4,972 | $198,880 |
| Del City | 36 | 90 | 677 | $179,787 | 1,646 | 3,091 | $123,640 |
| Jones | 1 | 1 | 9 | $1,845 | 26 | 52 | $2,080 |
| COUNTY: SOURCE LABEL OKLAHOMA | 913 | 3,421 | 29,410 | $7,082,391 | 77,610 | 141,978 | $5,679,120 |
| Source municipality / owner group | Modeled gate | Concessions gross | Concessions net† | Sanction model | Day-trip model | Overnight model | Total economic model |
|---|---|---|---|---|---|---|---|
| Edmond | $5,825,400 | $2,912,700 | $1,456,350 | $115,075 | $1,227,450 | $4,866,760 | $6,094,210 |
| Oklahoma City | $2,418,500 | $1,209,250 | $604,625 | $88,125 | $613,870 | $4,136,168 | $4,750,038 |
| Choctaw | $1,771,700 | $885,850 | $442,925 | $66,460 | $552,565 | $2,544,934 | $3,097,499 |
| Midwest City | $786,500 | $393,250 | $196,625 | $28,560 | $229,975 | $1,254,838 | $1,484,813 |
| Multi-municipality / unspecified (owner unallocated) | $919,700 | $459,850 | $229,925 | $28,170 | $235,270 | $1,731,399 | $1,966,669 |
| Harrah | $483,200 | $241,600 | $120,800 | $13,785 | $139,545 | $429,743 | $569,288 |
| Del City | $204,700 | $102,350 | $51,175 | $8,720 | $57,545 | $395,930 | $453,475 |
| Jones | $2,700 | $1,350 | $675 | $90 | $765 | $5,202 | $5,967 |
| COUNTY: SOURCE LABEL OKLAHOMA | $12,412,400 | $6,206,200 | $3,103,100 | $348,985 | $3,056,985 | $15,364,974 | $18,421,959 |
Reconciliation: Every one of the 3,421 source-coded division rows appears in exactly one line above; summing fees, teams, games, slots, gate, concessions, sanctions and economic model fields reproduces the county total. Distinct event counts do not sum to 913, because one event can have separate location groups.
3. Facility-owner attribution: presumed municipality unless contrary evidence
Specific source-backed examples: the City of Choctaw publicly lists Bouse Sports Complex but states that Big Show Productions currently manages league play; the City says it does not collect those league fees through its website. That current league-management statement does not prove who ran all earlier tournaments. Midwest City lists Reed Baseball Complex and the MAC as municipal reservation facilities; the MAC identifies a 2018 general-obligation-bond financing program. Edmond publishes its annual municipal audit and governs city park operations. None proves a director/owner’s historical share of any tournament’s gross receipts.
| Assumed/verified ownership reporting category | Unique events* | Division rows | Teams | Gross entry | Minimum games | Official slots | Modeled umpire expense |
|---|---|---|---|---|---|---|---|
| City of Edmond municipal parks (assumed title) | 263 | 1,280 | 9,324 | $1,304,399 | 20,379 | 35,090 | $1,403,600 |
| Oklahoma City (assumed owner, no deed verified) | 258 | 859 | 6,286 | $1,197,017 | 15,804 | 29,116 | $1,164,640 |
| City of Choctaw municipal complex (assumed title; league operator separate) | 222 | 535 | 5,872 | $1,779,547 | 17,542 | 33,010 | $1,320,400 |
| Multi-venue / owner unallocated | 102 | 291 | 3,773 | $1,408,240 | 11,867 | 22,525 | $901,000 |
| City of Midwest City facilities (official municipal listings; title unverified) | 81 | 189 | 1,573 | $440,844 | 4,310 | 8,150 | $326,000 |
| Harrah (assumed owner, no deed verified) | 64 | 116 | 951 | $212,959 | 2,864 | 4,630 | $185,200 |
| Del City (assumed owner, no deed verified) | 34 | 88 | 662 | $176,475 | 1,607 | 3,013 | $120,520 |
| Unknown exact venue / owner unallocated | 5 | 49 | 860 | $499,378 | 2,897 | 5,766 | $230,640 |
| School or university campus / title unverified | 7 | 12 | 59 | $27,452 | 171 | 340 | $13,600 |
| Geographic mismatch: Reaves Park / City of Norman (host unverified) | 1 | 1 | 41 | $34,235 | 143 | 286 | $11,440 |
| Jones (assumed owner, no deed verified) | 1 | 1 | 9 | $1,845 | 26 | 52 | $2,080 |
| COUNTY: SOURCE LABEL OKLAHOMA | 913 | 3,421 | 29,410 | $7,082,391 | 77,610 | 141,978 | $5,679,120 |
| Assumed/verified ownership reporting category | Modeled gate | Concessions gross | Concessions net† | Sanction model | Day-trip model | Overnight model | Total economic model |
|---|---|---|---|---|---|---|---|
| City of Edmond municipal parks (assumed title) | $5,766,700 | $2,883,350 | $1,441,675 | $112,515 | $1,210,790 | $4,723,127 | $5,933,917 |
| Oklahoma City (assumed owner, no deed verified) | $2,100,300 | $1,050,150 | $525,075 | $78,885 | $539,155 | $3,551,810 | $4,090,965 |
| City of Choctaw municipal complex (assumed title; league operator separate) | $1,754,600 | $877,300 | $438,650 | $65,590 | $547,720 | $2,511,988 | $3,059,708 |
| Multi-venue / owner unallocated | $1,247,900 | $623,950 | $311,975 | $41,240 | $331,065 | $2,384,828 | $2,715,893 |
| City of Midwest City facilities (official municipal listings; title unverified) | $543,700 | $271,850 | $135,925 | $19,015 | $158,405 | $796,484 | $954,889 |
| Harrah (assumed owner, no deed verified) | $453,800 | $226,900 | $113,450 | $12,805 | $131,215 | $373,099 | $504,314 |
| Del City (assumed owner, no deed verified) | $200,200 | $100,100 | $50,050 | $8,420 | $56,270 | $387,260 | $443,530 |
| Unknown exact venue / owner unallocated | $312,500 | $156,250 | $78,125 | $8,975 | $73,100 | $573,376 | $646,476 |
| School or university campus / title unverified | $17,700 | $8,850 | $4,425 | $1,040 | $5,015 | $34,102 | $39,117 |
| Geographic mismatch: Reaves Park / City of Norman (host unverified) | $12,300 | $6,150 | $3,075 | $410 | $3,485 | $23,698 | $27,183 |
| Jones (assumed owner, no deed verified) | $2,700 | $1,350 | $675 | $90 | $765 | $5,202 | $5,967 |
| COUNTY: SOURCE LABEL OKLAHOMA | $12,412,400 | $6,206,200 | $3,103,100 | $348,985 | $3,056,985 | $15,364,974 | $18,421,959 |
City-versus-owner caution: Labels such as Davis Ballpark, The Battlefields and private-branded sportsplexes are attributed to their displayed single municipality only under the requested assumption. Contracts, deeds, leases, and operating rights must supersede this classification when obtained. Schools and campuses are not relabeled as municipal property.
4. Exact facility labels and mixed-site inventory
Each facility entry is preserved exactly as displayed in the CSV. A comma-separated list of facilities is one combined-site data label, not a separate count at each venue. Reproducing the same event under every named facility would inflate historical activity. All 81 source facility groups are preserved below, and the complete machine-readable reconciliation accompanies this article.
Expand all 81 facility labels — event, team, games, umpire and entry-fee counts
| Exact source facility or combined-site label | Unique events* | Division rows | Teams | Gross entry | Minimum games | Official slots | Modeled umpire expense |
|---|---|---|---|---|---|---|---|
| Hafer Park / A C Caplinger Sports Complex | 259 | 1,270 | 9,221 | $1,265,992 | 20,071 | 34,509 | $1,380,360 |
| Bouse Sports Complex | 222 | 535 | 5,872 | $1,779,547 | 17,542 | 33,010 | $1,320,400 |
| Davis Ballpark | 81 | 361 | 2,850 | $477,422 | 6,671 | 11,496 | $459,840 |
| OKC Boomtown Ballyards | 39 | 171 | 998 | $197,272 | 2,291 | 4,368 | $174,720 |
| Legends Sports Complex DBAT SportsPlex | 54 | 160 | 1,301 | $261,508 | 4,305 | 8,386 | $335,440 |
| The Battlefields | 77 | 152 | 911 | $196,236 | 2,243 | 4,278 | $171,120 |
| Reed Baseball Complex | 61 | 126 | 1,021 | $283,291 | 2,790 | 5,207 | $208,280 |
| EOC All Sports Complex | 58 | 102 | 819 | $157,481 | 2,407 | 3,915 | $156,600 |
| Del City Ballpark | 34 | 88 | 662 | $176,475 | 1,607 | 3,013 | $120,520 |
| Midwest City MAC, Reed Baseball Complex | 34 | 67 | 760 | $264,899 | 2,218 | 4,374 | $174,960 |
| Oklahoma City Area | 5 | 49 | 860 | $499,378 | 2,897 | 5,766 | $230,640 |
| Midwest City MAC | 25 | 43 | 380 | $121,073 | 1,029 | 2,058 | $82,320 |
| Bouse Sports Complex, The Battlefields | 18 | 33 | 357 | $94,114 | 1,023 | 2,006 | $80,240 |
| Hafer Park / A C Caplinger Sports Complex, Mitch Park | 8 | 27 | 196 | $34,794 | 435 | 796 | $31,840 |
| MWC Fred Myers Civic Park | 10 | 20 | 172 | $36,480 | 491 | 885 | $35,400 |
| MWC Fred Myers Civic Park, The Battlefields | 12 | 20 | 165 | $37,349 | 428 | 820 | $32,800 |
| Bouse Sports Complex, EOC All Sports Complex | 12 | 14 | 431 | $245,913 | 1,571 | 3,101 | $124,040 |
| TNT Ballpark | 7 | 14 | 132 | $55,478 | 457 | 715 | $28,600 |
| Bouse Sports Complex, Reed Baseball Complex | 6 | 12 | 102 | $24,147 | 331 | 540 | $21,600 |
| Bouse Sports Complex, Del City Ballpark | 5 | 10 | 170 | $61,737 | 561 | 952 | $38,080 |
| Mitch Park | 6 | 10 | 103 | $38,407 | 308 | 581 | $23,240 |
| Bouse Sports Complex, Buck Thomas Park | 4 | 7 | 69 | $18,975 | 236 | 349 | $13,960 |
| Bouse Sports Complex, MWC Fred Myers Civic Park, The Battlefields | 4 | 7 | 93 | $27,013 | 304 | 608 | $24,320 |
| Bouse Sports Complex, Oklahoma City Area | 1 | 7 | 86 | $27,452 | 165 | 317 | $12,680 |
| Gametime Stars SB Indoor | 1 | 7 | 117 | $17,550 | 0 | 0 | $0 |
| Wheeler Park | 5 | 7 | 76 | $19,474 | 179 | 358 | $14,320 |
| Bouse Sports Complex, Choctaw Junior High | 1 | 6 | 24 | $5,414 | 66 | 127 | $5,080 |
| Bouse Sports Complex, MWC Fred Myers Civic Park | 4 | 5 | 44 | $11,360 | 143 | 262 | $10,480 |
| MWC Fred Myers Civic Park, Reed Baseball Complex | 2 | 5 | 37 | $8,769 | 106 | 212 | $8,480 |
| MWC Fred Myers Civic Park, Reed Baseball Complex, The Battlefields | 2 | 5 | 5 | $1,068 | 6 | 12 | $480 |
| Bouse Sports Complex, Buck Thomas Park, Reed Baseball Complex | 2 | 4 | 52 | $18,348 | 179 | 358 | $14,320 |
| Carl Albert High School | 1 | 4 | 4 | $650 | 8 | 14 | $560 |
| Reed Baseball Complex, The Battlefields | 3 | 4 | 56 | $16,304 | 148 | 296 | $11,840 |
| Bouse Sports Complex, EOC All Sports Complex, The Battlefields | 2 | 3 | 42 | $13,566 | 145 | 259 | $10,360 |
| Choctaw High School Softball Complex, EOC All Sports Complex | 1 | 3 | 27 | $0 | 92 | 150 | $6,000 |
| Del City Ballpark, PCO Girls Softball Complex | 2 | 3 | 83 | $60,447 | 288 | 576 | $23,040 |
| Del City Ballpark, The Battlefields | 2 | 3 | 36 | $8,922 | 105 | 210 | $8,400 |
| Oklahoma City University SF | 1 | 3 | 19 | $19,855 | 64 | 128 | $5,120 |
| Bouse Sports Complex, Buck Thomas Park, Dolese Youth Park | 2 | 2 | 49 | $19,551 | 170 | 340 | $13,600 |
| Bouse Sports Complex, Davis Ballpark, MWC Fred Myers Civic Park, The Battlefields | 1 | 2 | 37 | $11,470 | 128 | 256 | $10,240 |
| Bouse Sports Complex, Del City Ballpark, The Battlefields | 2 | 2 | 41 | $12,374 | 132 | 264 | $10,560 |
| Bouse Sports Complex, TNT Ballpark | 2 | 2 | 19 | $12,377 | 61 | 122 | $4,880 |
| Choctaw Junior High School | 2 | 2 | 15 | $3,635 | 43 | 86 | $3,440 |
| Del City Ballpark, Mitch Park | 2 | 2 | 145 | $105,850 | 506 | 1,012 | $40,480 |
| Del City High School | 2 | 2 | 15 | $3,312 | 39 | 78 | $3,120 |
| EOC All Sports Complex, TNT Ballpark | 2 | 2 | 98 | $71,540 | 342 | 342 | $13,680 |
| EOC All Sports Complex, The Battlefields | 2 | 2 | 43 | $14,907 | 131 | 262 | $10,480 |
| Midwest City MAC, Reed Baseball Complex, The Battlefields | 1 | 2 | 19 | $5,561 | 55 | 110 | $4,400 |
| Midwest City MAC, The Battlefields | 1 | 2 | 14 | $4,126 | 40 | 80 | $3,200 |
| Bethany High School, PCO Girls SC | 1 | 1 | 36 | $18,720 | 125 | 250 | $10,000 |
| Bouse Sports Complex, Buck Thomas Park, MWC Fred Myers Civic Park | 1 | 1 | 28 | $10,304 | 97 | 194 | $7,760 |
| Bouse Sports Complex, Buck Thomas Park, Reed Baseball Complex, TNT Ballpark | 1 | 1 | 11 | $4,389 | 38 | 76 | $3,040 |
| Bouse Sports Complex, Buck Thomas Park, The Battlefields | 1 | 1 | 10 | $3,680 | 34 | 68 | $2,720 |
| Bouse Sports Complex, Choctaw High School Softball Complex | 1 | 1 | 12 | $0 | 35 | 70 | $2,800 |
| Bouse Sports Complex, Davis Ballpark, Del City Ballpark, The Battlefields | 1 | 1 | 34 | $10,540 | 118 | 236 | $9,440 |
| Bouse Sports Complex, Davis Ballpark, The Battlefields | 1 | 1 | 23 | $7,130 | 80 | 160 | $6,400 |
| Bouse Sports Complex, Del City Ballpark, EOC All Sports Complex | 1 | 1 | 17 | $5,270 | 59 | 118 | $4,720 |
| Bouse Sports Complex, Del City Ballpark, MWC Fred Myers Civic Park | 1 | 1 | 8 | $2,480 | 27 | 54 | $2,160 |
| Bouse Sports Complex, Dolese Youth Park | 1 | 1 | 6 | $1,230 | 20 | 20 | $800 |
| Bouse Sports Complex, Dolese Youth Park, Reed Baseball Complex | 1 | 1 | 9 | $3,591 | 31 | 62 | $2,480 |
| Bouse Sports Complex, Midwest City MAC | 1 | 1 | 17 | $6,783 | 59 | 118 | $4,720 |
| Bouse Sports Complex, Midwest City MAC, Reed Baseball Complex | 1 | 1 | 29 | $13,717 | 144 | 288 | $11,520 |
| Bouse Sports Complex, Mitch Park | 1 | 1 | 22 | $7,524 | 76 | 152 | $6,080 |
| Bouse Sports Complex, Reed Baseball Complex, The Battlefields | 1 | 1 | 12 | $3,468 | 41 | 82 | $3,280 |
| Choctaw High School Softball Complex | 1 | 1 | 6 | $0 | 17 | 34 | $1,360 |
| Choctaw Junior High School, Del Crest Middle School | 1 | 1 | 7 | $3,129 | 24 | 48 | $1,920 |
| Davis Ballpark, Del City Ballpark | 1 | 1 | 27 | $6,534 | 121 | 242 | $9,680 |
| Davis Ballpark, Del City Ballpark, The Battlefields | 1 | 1 | 21 | $7,728 | 73 | 146 | $5,840 |
| Del City Ballpark, EOC All Sports Complex | 1 | 1 | 13 | $5,122 | 64 | 128 | $5,120 |
| Del City Ballpark, MWC Fred Myers Civic Park, The Battlefields | 1 | 1 | 25 | $10,375 | 87 | 174 | $6,960 |
| Del City Ballpark, Reed Baseball Complex | 1 | 1 | 10 | $2,370 | 29 | 58 | $2,320 |
| Del City Ballpark, TNT Ballpark | 1 | 1 | 15 | $7,860 | 52 | 52 | $2,080 |
| Del City High School, Midwest City High School | 1 | 1 | 13 | $2,665 | 51 | 102 | $4,080 |
| Dolese Youth Park, Reed Baseball Complex | 1 | 1 | 12 | $4,788 | 41 | 82 | $3,280 |
| EOC All Sports Complex, MWC Fred Myers Civic Park | 1 | 1 | 15 | $3,555 | 52 | 104 | $4,160 |
| EOC All Sports Complex, Reed Baseball Complex | 1 | 1 | 22 | $9,900 | 109 | 218 | $8,720 |
| Kiwanis Ballpark Jones | 1 | 1 | 9 | $1,845 | 26 | 52 | $2,080 |
| MWC Fred Myers Civic Park, Wildhorse Park | 1 | 1 | 6 | $1,230 | 20 | 20 | $800 |
| PCO Girls Softball Complex | 1 | 1 | 33 | $27,555 | 115 | 230 | $9,200 |
| Reaves Park | 1 | 1 | 41 | $34,235 | 143 | 286 | $11,440 |
| Reed Baseball Complex, Wildhorse Park | 1 | 1 | 13 | $5,811 | 45 | 90 | $3,600 |
| COUNTY: SOURCE LABEL OKLAHOMA | 913 | 3,421 | 29,410 | $7,082,391 | 77,610 | 141,978 | $5,679,120 |
Expand all 81 facility labels — gate, concessions, sanctions and economic-impact model
| Exact source facility or combined-site label | Modeled gate | Concessions gross | Concessions net† | Sanction model | Day-trip model | Overnight model | Total economic model |
|---|---|---|---|---|---|---|---|
| Hafer Park / A C Caplinger Sports Complex | $5,742,200 | $2,871,100 | $1,435,550 | $111,410 | $1,202,035 | $4,682,089 | $5,884,124 |
| Bouse Sports Complex | $1,754,600 | $877,300 | $438,650 | $65,590 | $547,720 | $2,511,988 | $3,059,708 |
| Davis Ballpark | $1,096,200 | $548,100 | $274,050 | $33,695 | $246,630 | $1,800,181 | $2,046,811 |
| OKC Boomtown Ballyards | $322,300 | $161,150 | $80,575 | $12,905 | $84,170 | $604,299 | $688,469 |
| Legends Sports Complex DBAT SportsPlex | $400,700 | $200,350 | $100,175 | $16,835 | $118,730 | $629,731 | $748,461 |
| The Battlefields | $252,500 | $126,250 | $63,125 | $13,985 | $77,435 | $466,446 | $543,881 |
| Reed Baseball Complex | $379,900 | $189,950 | $94,975 | $12,145 | $111,485 | $482,630 | $594,115 |
| EOC All Sports Complex | $409,700 | $204,850 | $102,425 | $11,335 | $119,995 | $283,798 | $403,793 |
| Del City Ballpark | $200,200 | $100,100 | $50,050 | $8,420 | $56,270 | $387,260 | $443,530 |
| Midwest City MAC, Reed Baseball Complex | $218,800 | $109,400 | $54,700 | $8,725 | $64,600 | $412,692 | $477,292 |
| Oklahoma City Area | $312,500 | $156,250 | $78,125 | $8,975 | $73,100 | $573,376 | $646,476 |
| Midwest City MAC | $111,500 | $55,750 | $27,875 | $5,075 | $32,300 | $212,415 | $244,715 |
| Bouse Sports Complex, The Battlefields | $112,200 | $56,100 | $28,050 | $3,870 | $30,345 | $221,085 | $251,430 |
| Hafer Park / A C Caplinger Sports Complex, Mitch Park | $58,700 | $29,350 | $14,675 | $2,560 | $16,660 | $143,633 | $160,293 |
| MWC Fred Myers Civic Park | $52,300 | $26,150 | $13,075 | $1,795 | $14,620 | $101,439 | $116,059 |
| MWC Fred Myers Civic Park, The Battlefields | $48,600 | $24,300 | $12,150 | $1,950 | $14,025 | $92,769 | $106,794 |
| Bouse Sports Complex, EOC All Sports Complex | $124,600 | $62,300 | $31,150 | $4,460 | $36,635 | $235,535 | $272,170 |
| TNT Ballpark | $44,100 | $22,050 | $11,025 | $1,470 | $11,220 | $89,301 | $100,521 |
| Bouse Sports Complex, Reed Baseball Complex | $85,300 | $42,650 | $21,325 | $1,005 | $19,030 | $55,199 | $74,229 |
| Bouse Sports Complex, Del City Ballpark | $57,000 | $28,500 | $14,250 | $1,700 | $14,450 | $115,600 | $130,050 |
| Mitch Park | $24,500 | $12,250 | $6,125 | $1,105 | $8,755 | $41,038 | $49,793 |
| Bouse Sports Complex, Buck Thomas Park | $26,400 | $13,200 | $6,600 | $690 | $5,865 | $56,355 | $62,220 |
| Bouse Sports Complex, MWC Fred Myers Civic Park, The Battlefields | $32,100 | $16,050 | $8,025 | $930 | $7,905 | $65,892 | $73,797 |
| Bouse Sports Complex, Oklahoma City Area | $34,400 | $17,200 | $8,600 | $935 | $7,310 | $74,562 | $81,872 |
| Gametime Stars SB Indoor | $0 | $0 | $0 | $0 | $2,925 | $0 | $2,925 |
| Wheeler Park | $18,700 | $9,350 | $4,675 | $1,135 | $6,460 | $32,079 | $38,539 |
| Bouse Sports Complex, Choctaw Junior High | $7,200 | $3,600 | $1,800 | $315 | $2,040 | $13,872 | $15,912 |
| Bouse Sports Complex, MWC Fred Myers Civic Park | $14,700 | $7,350 | $3,675 | $440 | $3,740 | $29,767 | $33,507 |
| MWC Fred Myers Civic Park, Reed Baseball Complex | $10,500 | $5,250 | $2,625 | $370 | $3,145 | $19,652 | $22,797 |
| MWC Fred Myers Civic Park, Reed Baseball Complex, The Battlefields | $1,500 | $750 | $375 | $200 | $425 | $2,890 | $3,315 |
| Bouse Sports Complex, Buck Thomas Park, Reed Baseball Complex | $18,400 | $9,200 | $4,600 | $520 | $4,420 | $38,148 | $42,568 |
| Carl Albert High School | $1,200 | $600 | $300 | $40 | $340 | $2,312 | $2,652 |
| Reed Baseball Complex, The Battlefields | $16,800 | $8,400 | $4,200 | $710 | $4,760 | $32,368 | $37,128 |
| Bouse Sports Complex, EOC All Sports Complex, The Battlefields | $16,800 | $8,400 | $4,200 | $420 | $3,570 | $36,414 | $39,984 |
| Choctaw High School Softball Complex, EOC All Sports Complex | $8,100 | $4,050 | $2,025 | $345 | $2,295 | $15,606 | $17,901 |
| Del City Ballpark, PCO Girls Softball Complex | $28,900 | $14,450 | $7,225 | $830 | $7,055 | $59,534 | $66,589 |
| Del City Ballpark, The Battlefields | $10,800 | $5,400 | $2,700 | $435 | $3,060 | $20,808 | $23,868 |
| Oklahoma City University SF | $5,700 | $2,850 | $1,425 | $265 | $1,615 | $10,982 | $12,597 |
| Bouse Sports Complex, Buck Thomas Park, Dolese Youth Park | $19,600 | $9,800 | $4,900 | $490 | $4,165 | $42,483 | $46,648 |
| Bouse Sports Complex, Davis Ballpark, MWC Fred Myers Civic Park, The Battlefields | $14,800 | $7,400 | $3,700 | $370 | $3,145 | $32,079 | $35,224 |
| Bouse Sports Complex, Del City Ballpark, The Battlefields | $14,400 | $7,200 | $3,600 | $410 | $3,485 | $29,767 | $33,252 |
| Bouse Sports Complex, TNT Ballpark | $5,700 | $2,850 | $1,425 | $190 | $1,615 | $10,982 | $12,597 |
| Choctaw Junior High School | $4,500 | $2,250 | $1,125 | $300 | $1,275 | $8,670 | $9,945 |
| Del City Ballpark, Mitch Park | $43,500 | $21,750 | $10,875 | $1,450 | $12,325 | $83,810 | $96,135 |
| Del City High School | $4,500 | $2,250 | $1,125 | $300 | $1,275 | $8,670 | $9,945 |
| EOC All Sports Complex, TNT Ballpark | $29,400 | $14,700 | $7,350 | $980 | $8,330 | $56,644 | $64,974 |
| EOC All Sports Complex, The Battlefields | $12,900 | $6,450 | $3,225 | $505 | $3,655 | $24,854 | $28,509 |
| Midwest City MAC, Reed Baseball Complex, The Battlefields | $5,700 | $2,850 | $1,425 | $190 | $1,615 | $10,982 | $12,597 |
| Midwest City MAC, The Battlefields | $4,200 | $2,100 | $1,050 | $215 | $1,190 | $8,092 | $9,282 |
| Bethany High School, PCO Girls SC | $10,800 | $5,400 | $2,700 | $360 | $3,060 | $20,808 | $23,868 |
| Bouse Sports Complex, Buck Thomas Park, MWC Fred Myers Civic Park | $11,200 | $5,600 | $2,800 | $280 | $2,380 | $24,276 | $26,656 |
| Bouse Sports Complex, Buck Thomas Park, Reed Baseball Complex, TNT Ballpark | $4,400 | $2,200 | $1,100 | $110 | $935 | $9,537 | $10,472 |
| Bouse Sports Complex, Buck Thomas Park, The Battlefields | $4,000 | $2,000 | $1,000 | $100 | $850 | $8,670 | $9,520 |
| Bouse Sports Complex, Choctaw High School Softball Complex | $3,600 | $1,800 | $900 | $120 | $1,020 | $6,936 | $7,956 |
| Bouse Sports Complex, Davis Ballpark, Del City Ballpark, The Battlefields | $13,600 | $6,800 | $3,400 | $340 | $2,890 | $29,478 | $32,368 |
| Bouse Sports Complex, Davis Ballpark, The Battlefields | $9,200 | $4,600 | $2,300 | $230 | $1,955 | $19,941 | $21,896 |
| Bouse Sports Complex, Del City Ballpark, EOC All Sports Complex | $6,800 | $3,400 | $1,700 | $170 | $1,445 | $14,739 | $16,184 |
| Bouse Sports Complex, Del City Ballpark, MWC Fred Myers Civic Park | $3,200 | $1,600 | $800 | $80 | $680 | $6,936 | $7,616 |
| Bouse Sports Complex, Dolese Youth Park | $2,400 | $1,200 | $600 | $60 | $510 | $5,202 | $5,712 |
| Bouse Sports Complex, Dolese Youth Park, Reed Baseball Complex | $3,600 | $1,800 | $900 | $90 | $765 | $7,803 | $8,568 |
| Bouse Sports Complex, Midwest City MAC | $6,800 | $3,400 | $1,700 | $170 | $1,445 | $14,739 | $16,184 |
| Bouse Sports Complex, Midwest City MAC, Reed Baseball Complex | $8,700 | $4,350 | $2,175 | $290 | $2,465 | $16,762 | $19,227 |
| Bouse Sports Complex, Mitch Park | $4,400 | $2,200 | $1,100 | $220 | $1,870 | $6,358 | $8,228 |
| Bouse Sports Complex, Reed Baseball Complex, The Battlefields | $3,600 | $1,800 | $900 | $120 | $1,020 | $6,936 | $7,956 |
| Choctaw High School Softball Complex | $1,800 | $900 | $450 | $135 | $510 | $3,468 | $3,978 |
| Choctaw Junior High School, Del Crest Middle School | $2,800 | $1,400 | $700 | $70 | $595 | $6,069 | $6,664 |
| Davis Ballpark, Del City Ballpark | $8,100 | $4,050 | $2,025 | $345 | $2,295 | $15,606 | $17,901 |
| Davis Ballpark, Del City Ballpark, The Battlefields | $8,400 | $4,200 | $2,100 | $285 | $1,785 | $18,207 | $19,992 |
| Del City Ballpark, EOC All Sports Complex | $3,900 | $1,950 | $975 | $205 | $1,105 | $7,514 | $8,619 |
| Del City Ballpark, MWC Fred Myers Civic Park, The Battlefields | $10,000 | $5,000 | $2,500 | $250 | $2,125 | $21,675 | $23,800 |
| Del City Ballpark, Reed Baseball Complex | $3,000 | $1,500 | $750 | $100 | $850 | $5,780 | $6,630 |
| Del City Ballpark, TNT Ballpark | $6,000 | $3,000 | $1,500 | $150 | $1,275 | $13,005 | $14,280 |
| Del City High School, Midwest City High School | $3,900 | $1,950 | $975 | $130 | $1,105 | $7,514 | $8,619 |
| Dolese Youth Park, Reed Baseball Complex | $4,800 | $2,400 | $1,200 | $120 | $1,020 | $10,404 | $11,424 |
| EOC All Sports Complex, MWC Fred Myers Civic Park | $4,500 | $2,250 | $1,125 | $150 | $1,275 | $8,670 | $9,945 |
| EOC All Sports Complex, Reed Baseball Complex | $6,600 | $3,300 | $1,650 | $220 | $1,870 | $12,716 | $14,586 |
| Kiwanis Ballpark Jones | $2,700 | $1,350 | $675 | $90 | $765 | $5,202 | $5,967 |
| MWC Fred Myers Civic Park, Wildhorse Park | $2,400 | $1,200 | $600 | $60 | $510 | $5,202 | $5,712 |
| PCO Girls Softball Complex | $9,900 | $4,950 | $2,475 | $330 | $2,805 | $19,074 | $21,879 |
| Reaves Park | $12,300 | $6,150 | $3,075 | $410 | $3,485 | $23,698 | $27,183 |
| Reed Baseball Complex, Wildhorse Park | $5,200 | $2,600 | $1,300 | $205 | $1,105 | $11,271 | $12,376 |
| COUNTY: SOURCE LABEL OKLAHOMA | $12,412,400 | $6,206,200 | $3,103,100 | $348,985 | $3,056,985 | $15,364,974 | $18,421,959 |
Six prominent source facility groups (not exhaustive)
| Exact facility label | Events* | Rows | Teams | Gross entry | Min. games | Umpire slots | Modeled umpire cost |
|---|---|---|---|---|---|---|---|
| Hafer Park / A C Caplinger Sports Complex | 259 | 1,270 | 9,221 | $1,265,992 | 20,071 | 34,509 | $1,380,360 |
| Bouse Sports Complex | 222 | 535 | 5,872 | $1,779,547 | 17,542 | 33,010 | $1,320,400 |
| Davis Ballpark | 81 | 361 | 2,850 | $477,422 | 6,671 | 11,496 | $459,840 |
| OKC Boomtown Ballyards | 39 | 171 | 998 | $197,272 | 2,291 | 4,368 | $174,720 |
| Legends Sports Complex DBAT SportsPlex | 54 | 160 | 1,301 | $261,508 | 4,305 | 8,386 | $335,440 |
| The Battlefields | 77 | 152 | 911 | $196,236 | 2,243 | 4,278 | $171,120 |
The full 81-row facility reporting inventory is visible in the expandable tables; owners and operators must still be checked with facility-specific public records. Combined-venue labels are retained as rows even when all venues are inside the same municipality.
5. Economic impact: a separate, transparent historical visitor-spending model
The Hidden Valley field TotalEconomicImpactPerEvent is named “PerEvent,” but values are present at the division row level. They are added once per county-assigned source row and are not multiplied by number of divisions or recounted per tournament. The model is a descriptive spending scenario, not measured hotel bookings, measured tourism, additional county economic output, net-new spending, sales taxes or public benefits.
DayImpact = TeamsEntered × DayTripRate × DayStayOvernightImpact = TeamsEntered × NightTripRate × OverNightStayTotalEconomicImpactPerEvent = DayImpact + OvernightImpact (stored division-row amount; source exceptions retained)Worked row-level example, 2001: One Davis Ballpark division entry lists five teams, a $85 day-trip rate and one day-stay multiplier: 5 × $85 × 1 = $425. Its overnight rate is $289 and overnight-stay multiplier is two: 5 × $289 × 2 = $2,890. Combined source-model amount: $3,315 for that division record. This is hypothetical modeled spending per participating team under the dataset assumptions, not five documented trip receipts.
| Assumption or factor | Values actually observed in Oklahoma County source-coded rows | Interpretive limitation |
|---|---|---|
| DayTripRate | $85 in 3,218 rows; $25 in 203 rows | Row-level rate used; no single universal rate substituted |
| NightTripRate | $289 in 3,219 rows; $0 in 202 rows | Zero night model does not document absence of travel |
| DayStay | 0–36 source day multiplier; 3,292 rows use 1 | Long leagues can create large day multipliers; not hotel evidence |
| OverNightStay | 0–6; 2 in 2,452 rows; 1 in 477; 0 in 274 | A scenario assumption, not room-night receipt |
| Admissions | $5 daily price in 3,381 rows; $0 in 40 | Some no-fee entries still show model activity |
| Concession gross | Source equals 50% of modeled gate in this extract | Not cash register transaction data |
| Historical umpire pay | $40 per assignment in 3,378 rows; $0 in 43 | Source model, not verified actual annual labor rates |
DayImpact = $0 and OvernightImpact = $0; applying displayed input rates naively produces $765 + $2,601 = $3,366. The source ledger preserves the stored $0 values. The mismatch is separately disclosed, not silently overridden.As an illustrative sensitivity scenario only, limit each row’s modeled day-stay exposure to a maximum of 3 days and its overnight exposure to a maximum of 2; preserve zero-valued exceptions instead of imputing them. Under that alternate modeling ceiling the same source rows yield $2,426,035 day plus $14,282,380 overnight = $16,708,415. This is a cap-based stress test, not a revised verified economic-impact finding. A truly incremental local model would additionally exclude local spending displaced from elsewhere, identify party origin, verify room occupancy and receipts, and address double-counting, leakages and costs.
6. Reproducible arithmetic and integrity controls
| Reported measure | Exact computational rule | Disclosure / caveat |
|---|---|---|
| County extraction | Keep only source County == “Oklahoma” | Mixed-county strings go to host watchlist; geographic contradictions disclosed |
| Unique events | Distinct (Seasonid, TournamentID after removing last dash-number division suffix) | A one-event/multi-division or multi-site pair counts once countywide |
| Division rows | Count CSV source records, exactly once | Not an independent tournament count |
| Teams | Sum TeamsEntered | Re-entries across events are counted multiple times |
| Gross entry fees | Sum source TotalTeamEntryFee | Underlying conceptual formula: TeamsEntered × advertised entry fee. Missing/inconsistent source field retained; not imputed |
| Minimum games | Sum source TotalMinimumGamesPlayed | Stored derived guarantee/game model; not known games actually played |
| Official assignment slots | Sum source TotalEventUmpires | Usually source minimum games × officials per game; exceptions remain uncorrected |
| Modeled umpire expenses | Sum source TotalEventUmpireFees | Modeled slots × source row pay rates; not actual payroll |
| Modeled gate | Sum source TotalEventGate | Row gate assumption DailyFans × DailyAdmissionFee × TotalEventDays |
| Concession gross | Sum source TotalEventConcession | Source modeled concession total, equal to 50% gate in this extract |
| Scenario concession net | TotalEventConcession × selected margin (50%; range 30–70%) | No evidence of actual costs, contracts, wages, taxes, operator margin |
| USSSA sanction model | Sum source TotalUSSSASanctionFees | Model of team/event sanction categories, not paid receipts |
| Day-trip spending model | Sum source DayImpact; row formula teams × DayTripRate × DayStay | Preserve year/event model inputs and source exceptions |
| Overnight spending model | Sum source OvernightImpact; row formula teams × NightTripRate × OverNightStay | No independent room nights, prices or traveler-origin validation |
| Total economic model | Sum TotalEconomicImpactPerEvent, division by division | Numerically reconciles to sum of source DayImpact and OvernightImpact |
| Reconciliation | Additive fields reconcile across municipality, owner class, exact facility label | Unique event numbers are intentionally nonadditive |
Illustrative concession margin sensitivity: 30% net margin gives $1,861,860; 50% gives $3,103,100; 70% gives $4,344,340. The published 50% row is a scenario, not verified income. Fees, admissions and gross concessions must never be added to modeled visitor impact without evaluating overlap.
All three independent grouping systems—source municipality, exact facility string and provisional owner class—pass full additive reconciliations to the 3,421-row county ledger. The companion CSV contains those groups and is useful for reproducing the arithmetic in spreadsheet software.
7. Primary-host county verification, apparent mapping conflicts and exclusions
The strongest county approach is to assign the event to the county of its independently established primary host facility. A source municipality is a lead, not proof. If several venues are listed across county lines, preserve the record in a watchlist until event-date brackets, venue schedules, approved field reservations, signed agreements or similar primary evidence confirms location.
| Geographic audit bucket | Division rows | Unique event IDs* | Teams | Gross entry | Modeled economic total | County-ledger treatment |
|---|---|---|---|---|---|---|
| Source County exactly Oklahoma (headline) | 3,421 | 913 | 29,410 | $7,082,391 | $18,421,959 | INCLUDED provisionally |
| Within headline: possible out-of-county venue mismatch | 19 | 7 | 279 | $116,523 | $243,355 | SUBSET of headline; do not add again |
| Cross-county source labels mentioning Oklahoma | 215 | 80 | 3,473 | $1,602,978 | $2,511,835 | EXCLUDED until primary host verified |
For example, the CSV places a Reaves Park division in an Oklahoma County/Midwest City field, although the City of Norman identifies Reaves Park as a Norman park. Other source-coded combinations mention Buck Thomas Park / Moore or Wildhorse Park / Mustang. Some are combined-site entries and might correctly have had an Oklahoma County primary host elsewhere; the point is to flag and verify, not automatically move an event. These 19 rows remain visible inside the source-labelled county totals pending host adjudication.
The cross-county watchlist has 215 rows, 80 distinct watchlisted event IDs and $1,602,978 source-calculated gross entry fees outside the Oklahoma-only ledger. Watchlist event IDs can overlap events already represented in the Oklahoma-only extract, so adding them directly to the headline would inflate the analysis.
A separate October 16 evidence audit of 123 multi-facility Oklahoma USSSA event leads found event-date host documents unverified for many entries. Before making new requests, compare pending City reservations/agreements already requested against the specific 2011–2017 candidate event dates. The downloadable watchlist below identifies each mixed-county event and each in-ledger geographic anomaly.
8. Public facilities, shared opportunities and the money-flow questions
Choctaw: Bouse Sports Complex
Official City materials identify Bouse as a public-recreation facility and specifically say that Big Show Productions currently manages league play. This illustrates the difference between public facilities and private/independent operations; it does not assign historic tournament receipts.
Midwest City: MAC and Reed
City facility listings offer tournament rentals. The MAC page identifies development under the 2018 municipal general-obligation bond program. For comparative accounting, seek bond issue reports, payments, annual operations and concession agreements, not gross-event estimates.
Edmond: Hafer/Caplinger and Mitch
City parks and historical tournament labels show a sizable research footprint. Compare facilities’ management transitions, capital-improvement financing, scheduling rights, public access, municipal ledger receipts and the separately published audited city statements.
Oklahoma City, Del City and Harrah
Determine physical field title and outside operators, historical permits, tournament license agreements, public contributions and distribution of admissions/concessions. Events spanning more than one city require primary-host selection before county reallocation.
Economic development must be evaluated from both directions: potential visitor activity and local opportunity costs. A true net public benefit would also account for capital and operating spending, facility depreciation, field access for residents, potential displacement of regular leagues, public revenue actually deposited, concession recipients, and whether outside visitors would have spent locally anyway. Shared reservation standards, transparent rate sheets, cross-city emergency scheduling and public fee reports are practical collaboration opportunities worth exploring without presuming any misconduct.
9. Courts, allegations, outcomes and Oklahoma County DA jurisdiction
Oklahoma County is within Oklahoma District Attorney District 7, whose DA is Vicki Zemp Behenna according to the Oklahoma District Attorneys Council. That office prosecutes relevant state criminal charges within its jurisdiction; it is not the municipal audit department, public-record adjudicator, USSSA sanctioning body, or a substitute for agency fact-finding. Cleveland or Canadian County venue questions may belong to other judicial districts once the location is independently verified.
Case-outcome verification status, October 18, 2026: This edition has not established an Oklahoma County case number, charging document, judgment, dismissal or acquittal directly tied to the tournament rows published here. Therefore no individual or organization is labeled as charged, convicted, cleared or liable on the basis of this dataset. Claims in complaints or pending litigation, when located later, will be distinguished from findings and docket dispositions. Court-research leads include the Oklahoma State Courts Network docket search and actual filed pleadings, orders and certified outcomes; this is not a claim that no relevant case exists.
10. Independent audits: exact findings, scopes and limitations
Municipal annual financial statements and state/county audits have distinct scopes. Neither the existence of an audit finding nor a clean financial-statement opinion proves how historical USSSA tournaments distributed entry fees, admissions or concessions. Below are actual reviewed official report contents and specific audit limitations, not findings imputed to youth sports.
| Official audit | Verified result with source pages | Related corrective action/status | Youth-sports relevance |
|---|---|---|---|
| City of Oklahoma City, FY2024 Single Audit, year ended June 30, 2024; federal report signed Jan. 7, 2026 | Unmodified financial statement and major-program opinions; Finding 2024-001 financial-reporting MATERIAL WEAKNESS after Oracle ERP implementation, audit report p.9; see official single-audit PDF pp.7–9. | Auditor called for improved reconciliations/reporting; management response described planned and ongoing reporting changes, not independently completed. | Financial-reporting context, NOT a tournament gate/concession or park-funds finding. |
| Same FY2024 OKC Single Audit | Findings 2024-002 (SLFRF invoice approval), 2024-003 (SLFRF federal reporting) and 2024-004 (CDBG duplicated payroll, $23,263 questioned costs); report pp.10–15. | City management concurred and outlined strengthened payment approval, monitoring and HUD reimbursement/offset follow-up; subsequent completion unverified here. | These are federal grant compliance findings, NOT findings against youth-sports organizers. |
| City of Edmond, FY2025 ACFR, year ended June 30, 2025; auditor report Dec. 22, 2025 | Independent auditor issued an unmodified fair-presentation opinion; printed financial report pp.9–11. | A routine municipal financial-statement opinion, not a concession/tournament source-ledger attestation. | Provides financial controls context; no specific tournament misconduct finding established. |
| Oklahoma County countywide audits and State Auditor and Inspector | Official audit directories identified for follow-up; county and city reports are different entities. No specific county youth-sports audit finding is established by these inventories. | Obtain report year, finding ID, exact opinion, page, county response and corrective-action evidence before attributing any finding. | No inferred sports-related fault. |
Primary-source documents: Oklahoma City FY2024 Single Audit Report (24-page PDF; schedule of findings pp.9–15); Edmond FY2025 Annual Comprehensive Financial Report (auditor pp.9–11); Choctaw yearly audit library; Oklahoma County finance and audit index; Oklahoma State Auditor & Inspector.
11. Existing public-record requests and the missing primary receipts
Before submitting overlapping Oklahoma Open Records Act requests, check the existing city productions and determine which event-date reservation, host declaration, permits and finance ledgers are not already covered. The status below is the most recently documented status available in the research archive—not a guarantee of current processing as of October 18.
| Agency and research records request | Documented date and status | Evidence sought / what remains unverified |
|---|---|---|
| City of Choctaw, Bouse Sports Complex, Public Records Request 389 | Received Oct. 13, 2026; City Clerk confirmed processing in same-day email; no later disposition established here | Facility operations and contracts, 2015–2026; reservations, permits, vendor/concession rights, operating costs, municipal deposit and tournament agreements |
| City of Edmond, ORR-2026-771 | Submitted Oct. 13, 2026; portal screenshot that day shows “In Progress”; no later production established here | Hafer/Caplinger, Mitch and Edmond 66; EASI and EYSA transitions, lease periods, event reservations, revenues, concessions, municipal costs |
| Oklahoma City, Midwest City, Del City, Harrah and Oklahoma County offices | No newly submitted request is asserted in this Day 3 edition | Check existing request inventory; then seek date-specific reservations, rental contracts, ledger deposits, bond capital costs and auditor follow-ups instead of requesting nonexistent new reports |
Useful public-facing access routes: Oklahoma County open records, City of Oklahoma City records requests and City of Edmond request portal. Ask for existing records rather than demanding new retrospective financial analyses.
12. Research sources, right of response and correction policy
- Controlling research dataset:
AIUSSSA - HVIOG 9-20-2026.csv, historical Oklahoma USSSA events and divisions, 2001–2026, 65 columns. Current working copy provided with the research series; not an audited financial ledger. - Event/date host research: Hidden Valley October 16, 2026 123-event municipality archive/primary-host audit; candidate locations are not finally assigned absent event-specific reservation/bracket evidence.
- City of Choctaw, Bouse Sports Complex public operations/league-play page, accessed for this edition Oct. 18, 2026.
- City of Midwest City, MAC facility and GO-bond overview. Also inspect City Reed Complex municipal listing.
- City of Norman, Reaves Park location for source mismatch review.
- Oklahoma District Attorneys Council, current districts and jurisdiction.
- Oklahoma City FY2024 Single Audit, signed Jan. 7, 2026 for federal audit; numbered findings are not a tournament conclusion.
- Edmond FY2025 ACFR, opinion dated Dec. 22, 2025.
- Oklahoma State Courts Network for any future case-specific disposition review.
- Historical City of Choctaw Request 389 Oct. 13 receipt and City of Edmond ORR-2026-771 Oct. 13 portal status, retained in the project public-record archive.
Readers who can verify a primary tournament host, identify field ownership, supply a dated facility-use agreement or provide a full official docket or audit disposition are invited to submit documentation for review at kenneth@bcmsports.net. Corrections will identify the source, affected row, date and recalculated county/municipal totals; raw input values and the change log should be preserved.