
Jenks Youth Baseball Complex
Oklahoma USSSA Facility Activity Profile | 2001-2026
An independent research profile organizing publicly available Oklahoma USSSA baseball and softball information into direct Primary Facility activity, associated multi-facility activity, annual trends, league records, operational scale, geographic relationships, and a combined documented activity footprint.
Direct / Stand-Alone Primary Facility Activity
Pages 1-2 represent records listing Jenks Youth Baseball Complex independently as the event facility and exclude multi-facility combinations. This is the report's most conservative facility-specific population.
Jenks Youth Baseball Complex
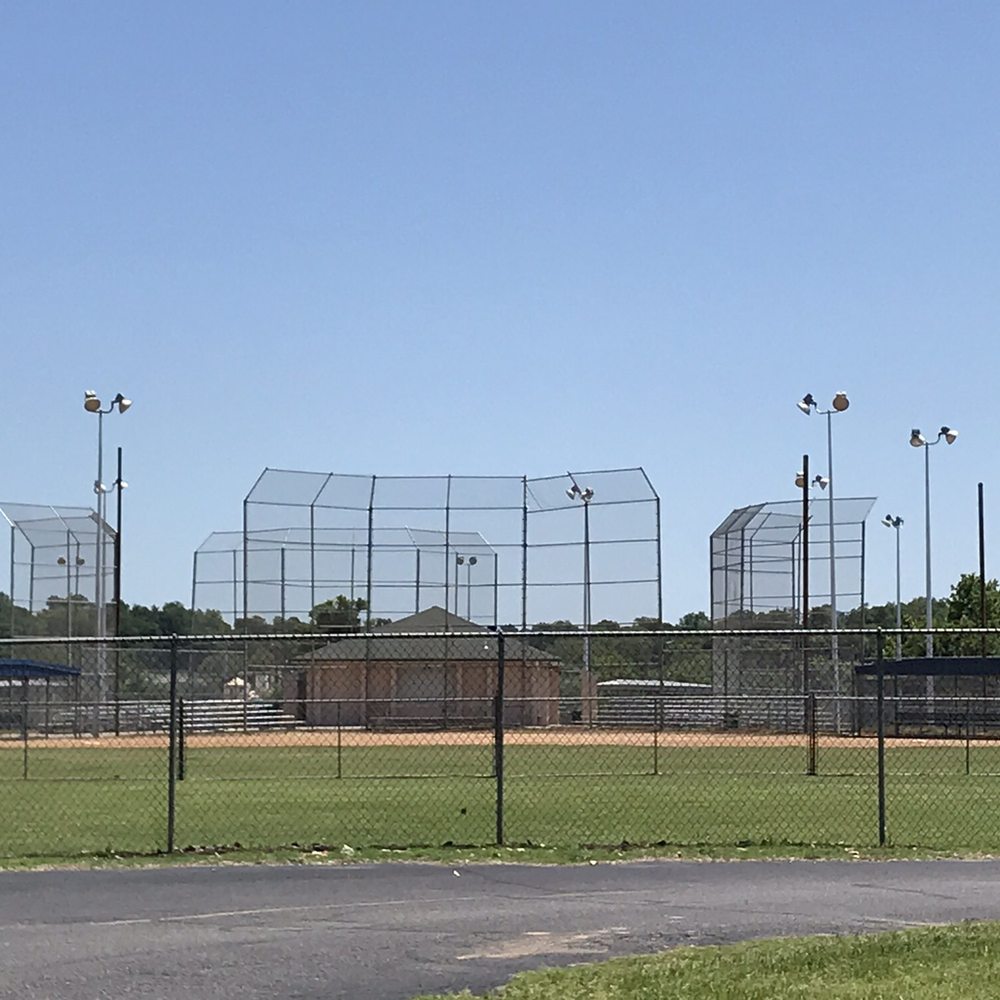
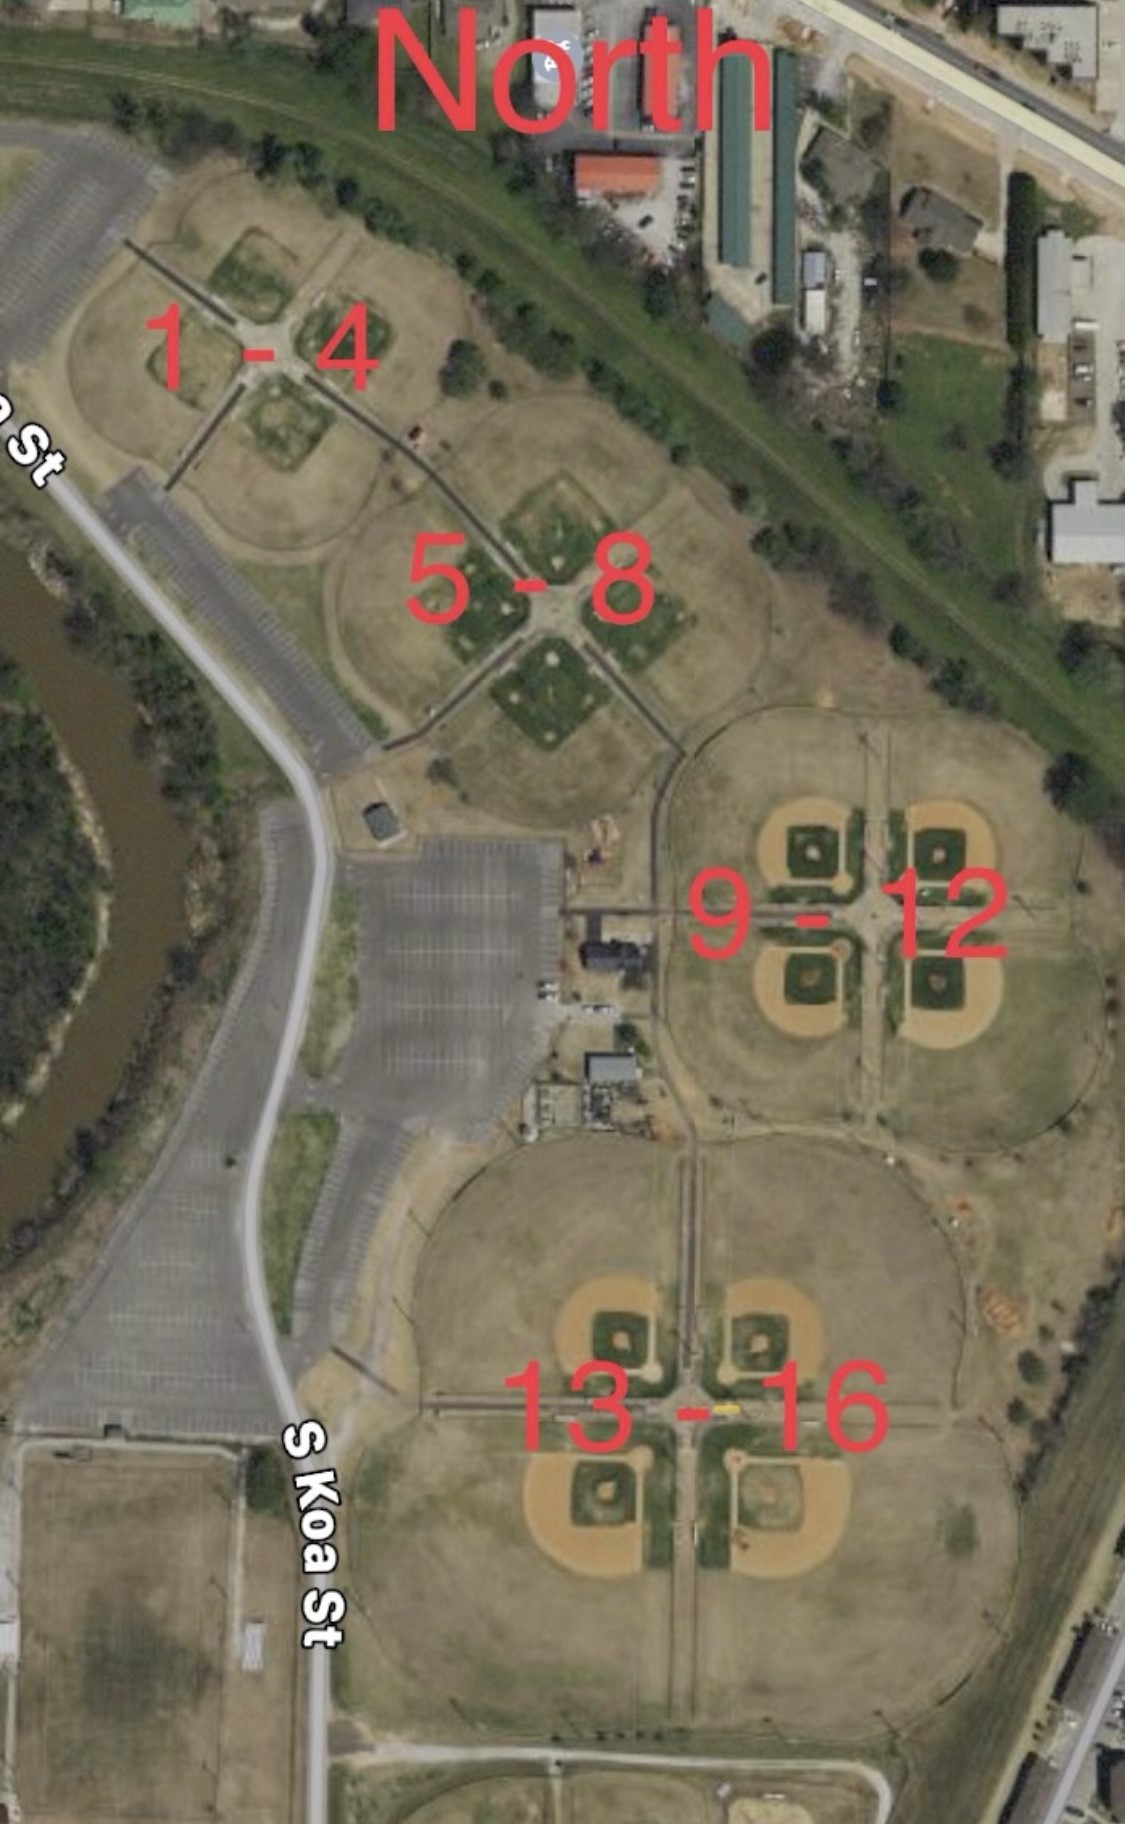
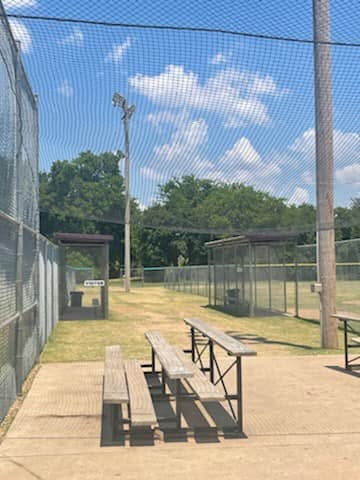
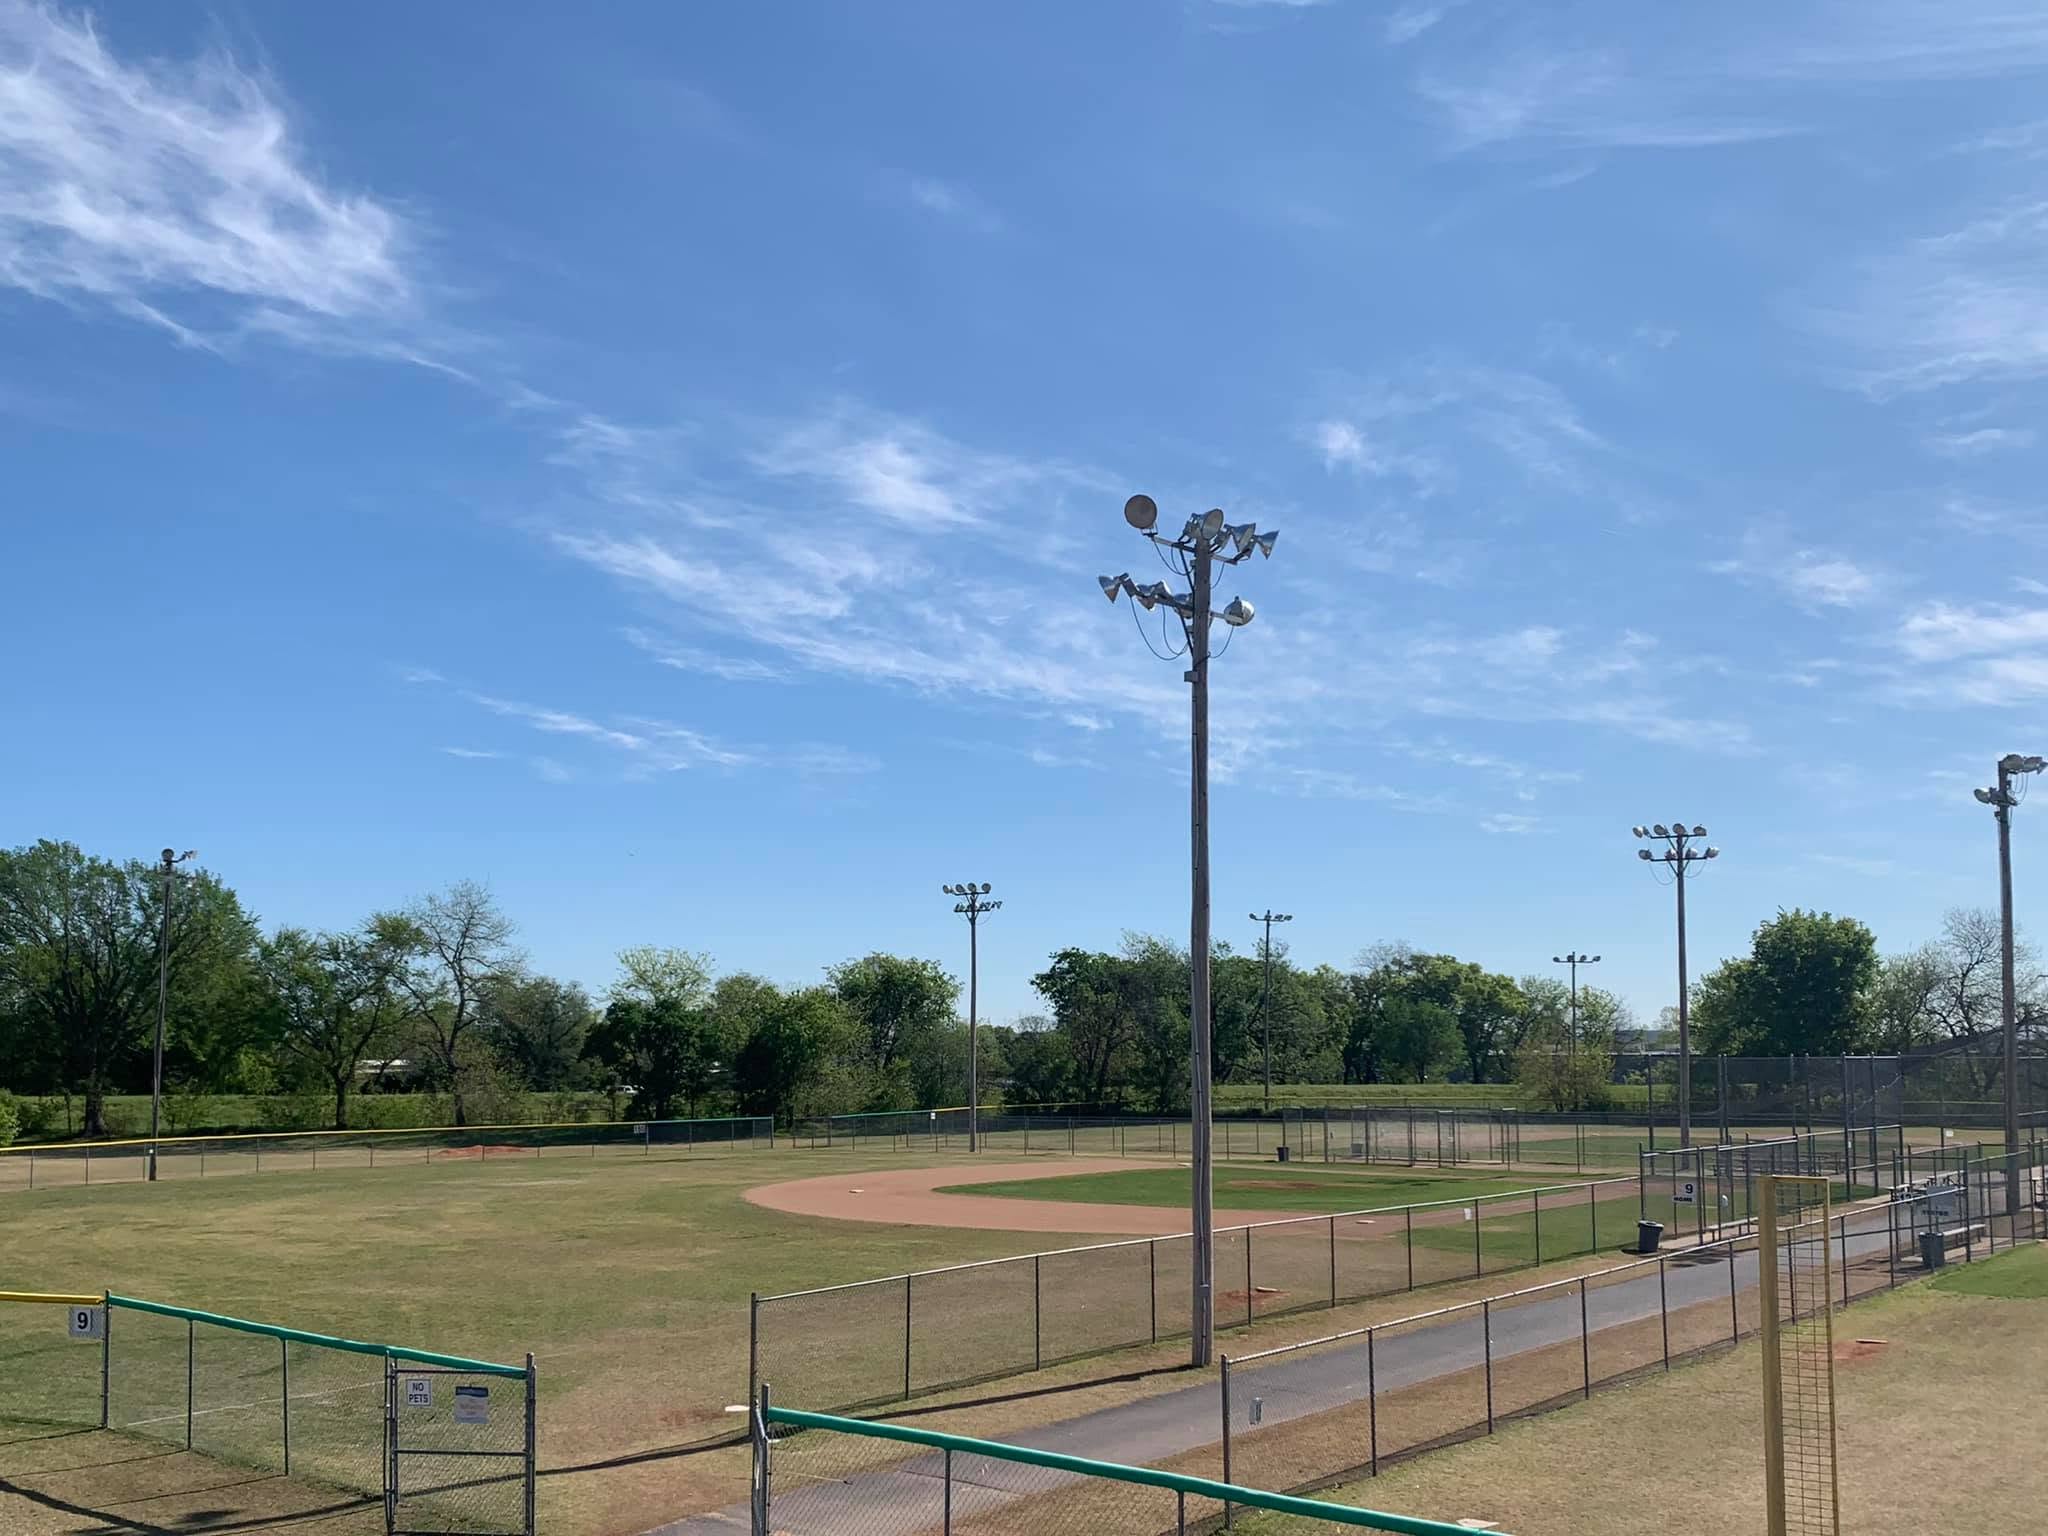
Supplied facility photographs are presented as documentary visuals and are not used to infer ownership, operating agreements, lease terms, or financial allocation.
Direct Facility, Municipality & Director Concentrations
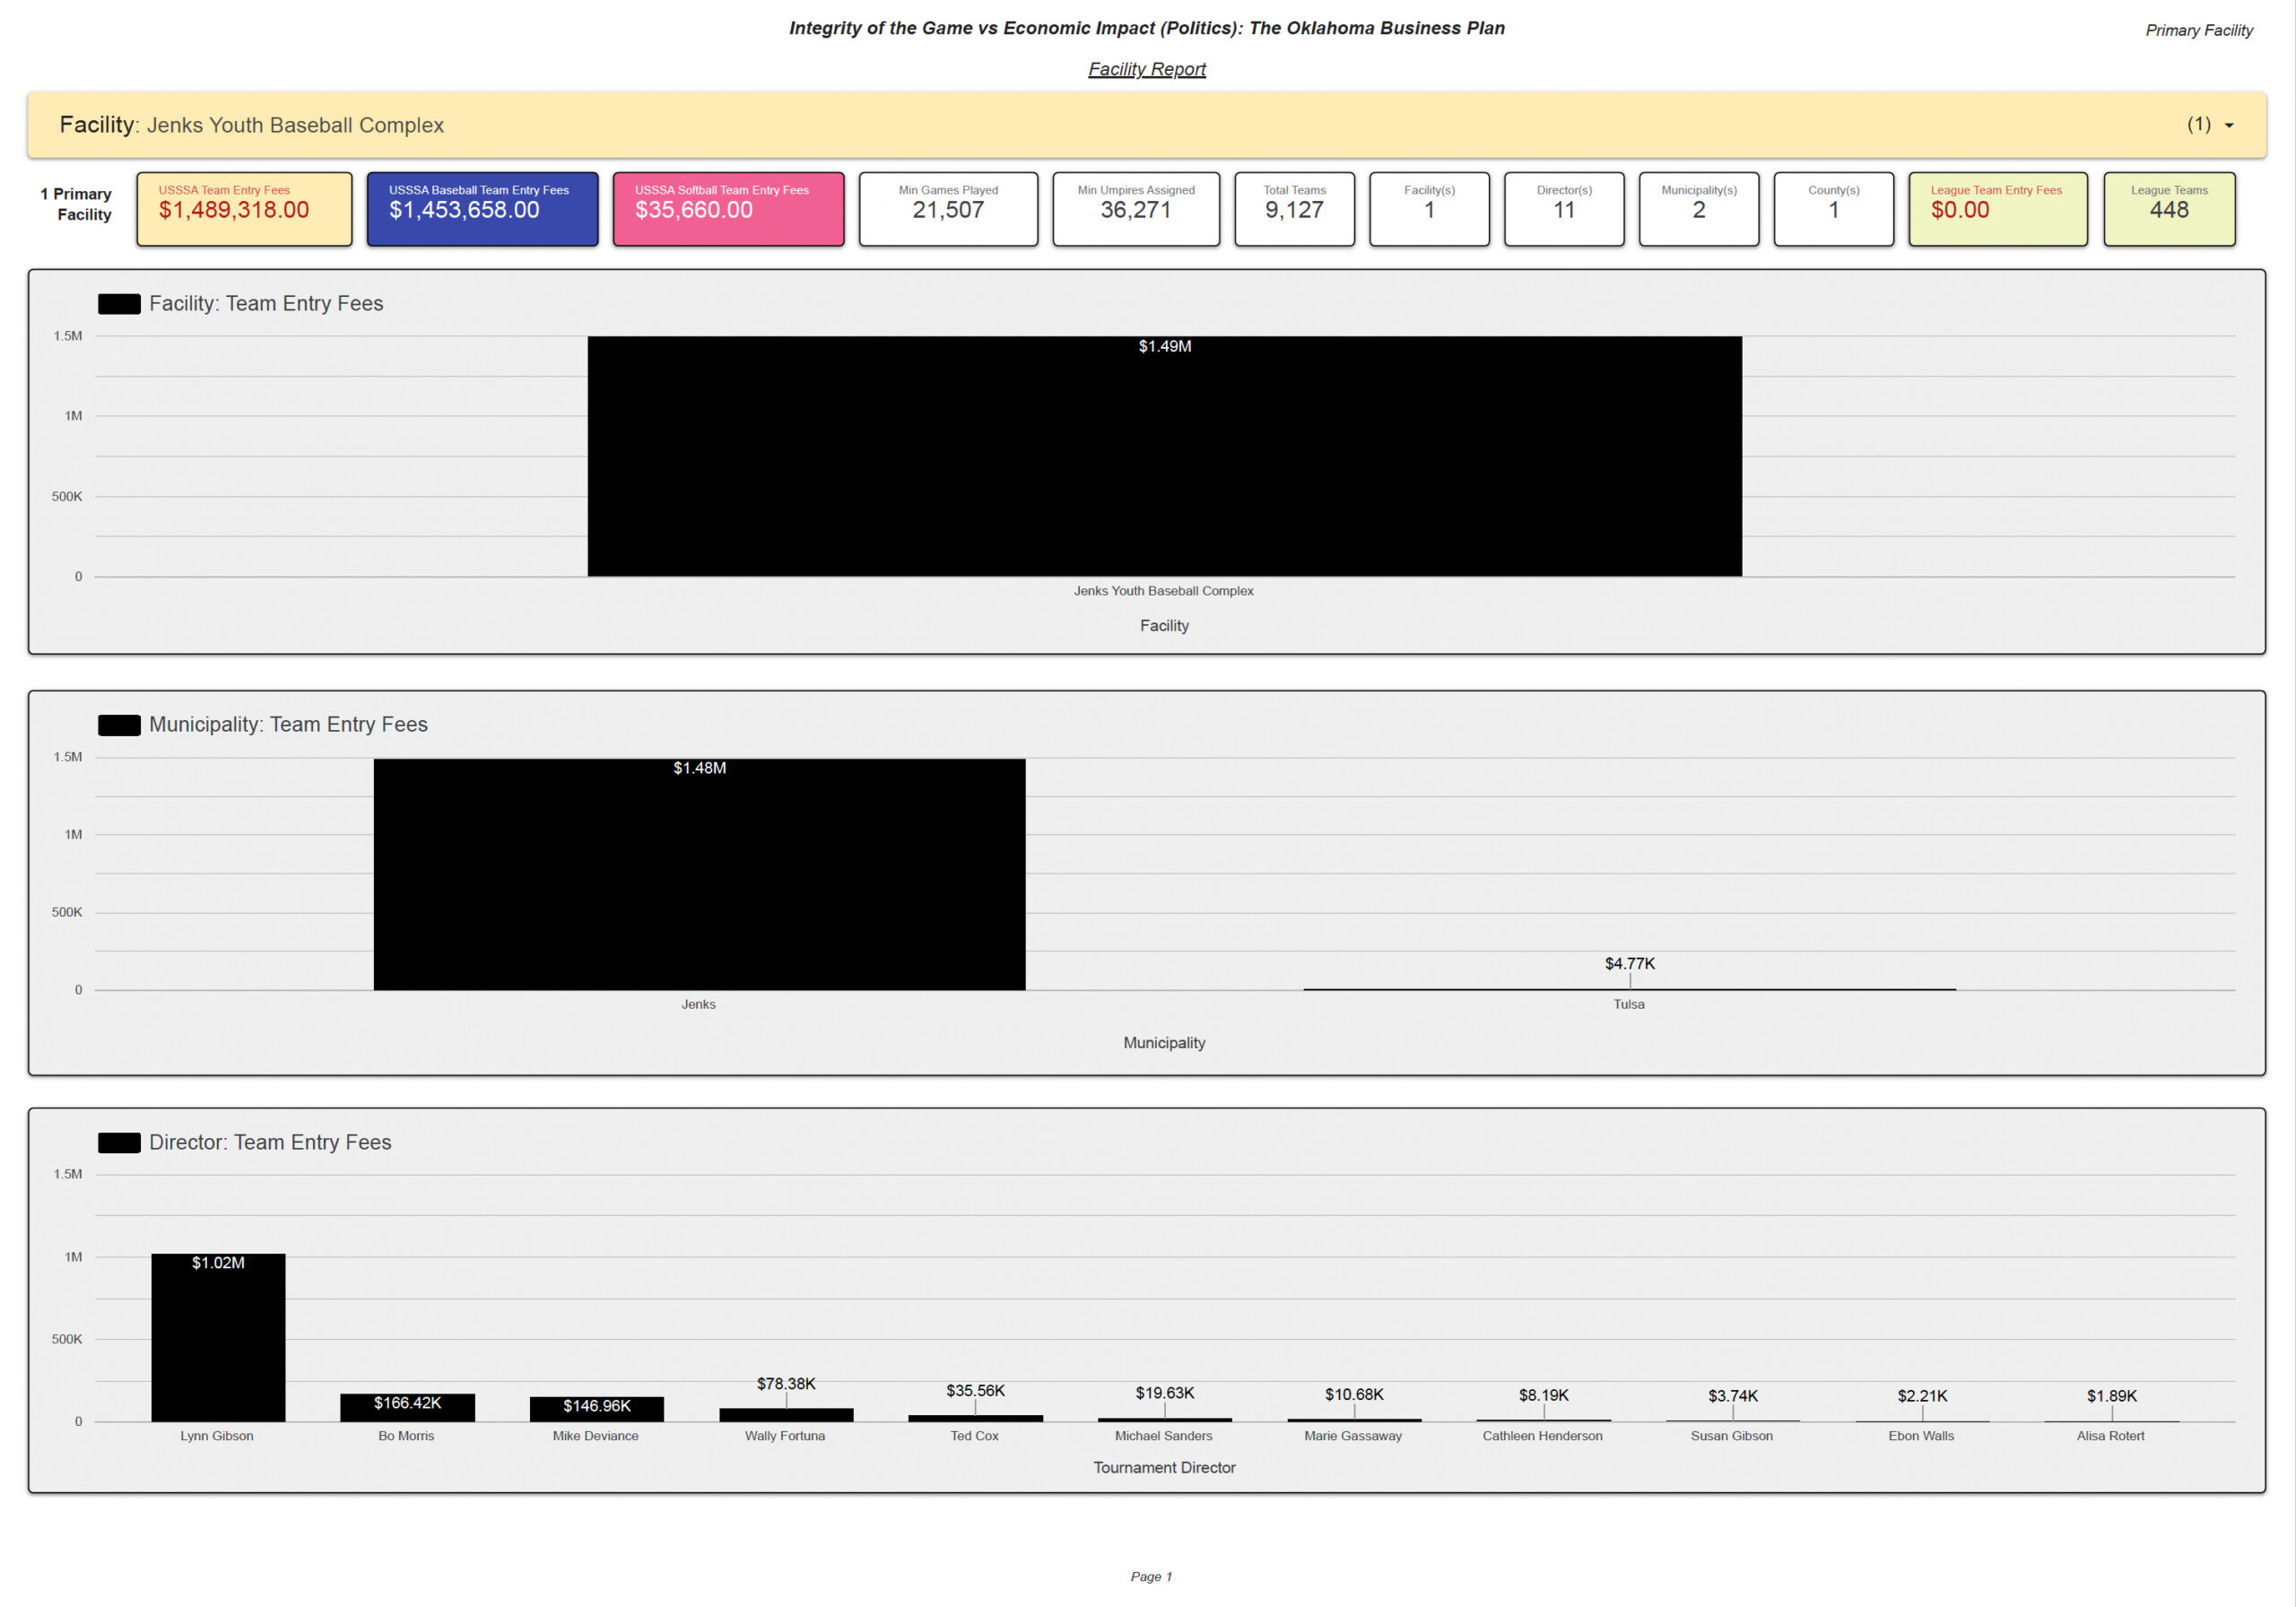
Direct Activity Findings
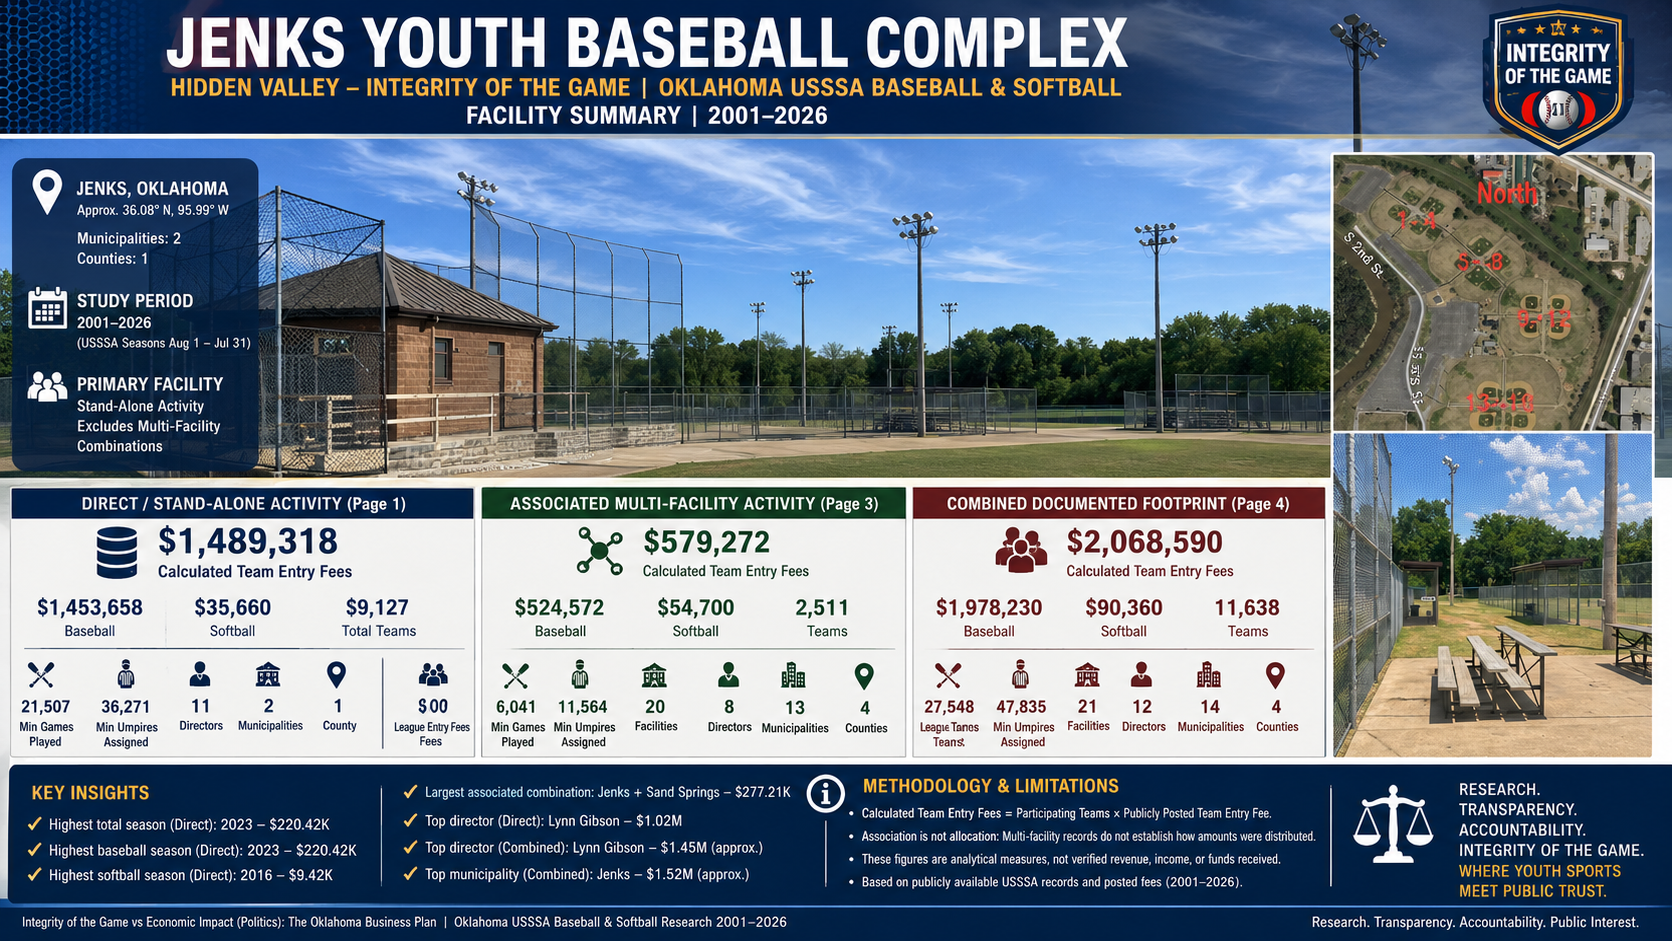
The direct stand-alone population identifies $1,489,318 in Calculated Team Entry Fees. Baseball accounts for $1,453,658 and softball accounts for $35,660.
The municipality chart is concentrated in Jenks at approximately $1.48 million, with Tulsa at approximately $4.77K. These values describe calculated activity associated with records categorized under those municipality fields and do not establish municipal receipt.
The director chart identifies Lynn Gibson at approximately $1.02 million as the largest direct concentration, followed by Bo Morris at approximately $166.42K and Mike Deviance at approximately $146.96K. The chart measures activity associated with director records; it is not a statement of director income or compensation.
Annual & Sport Trends
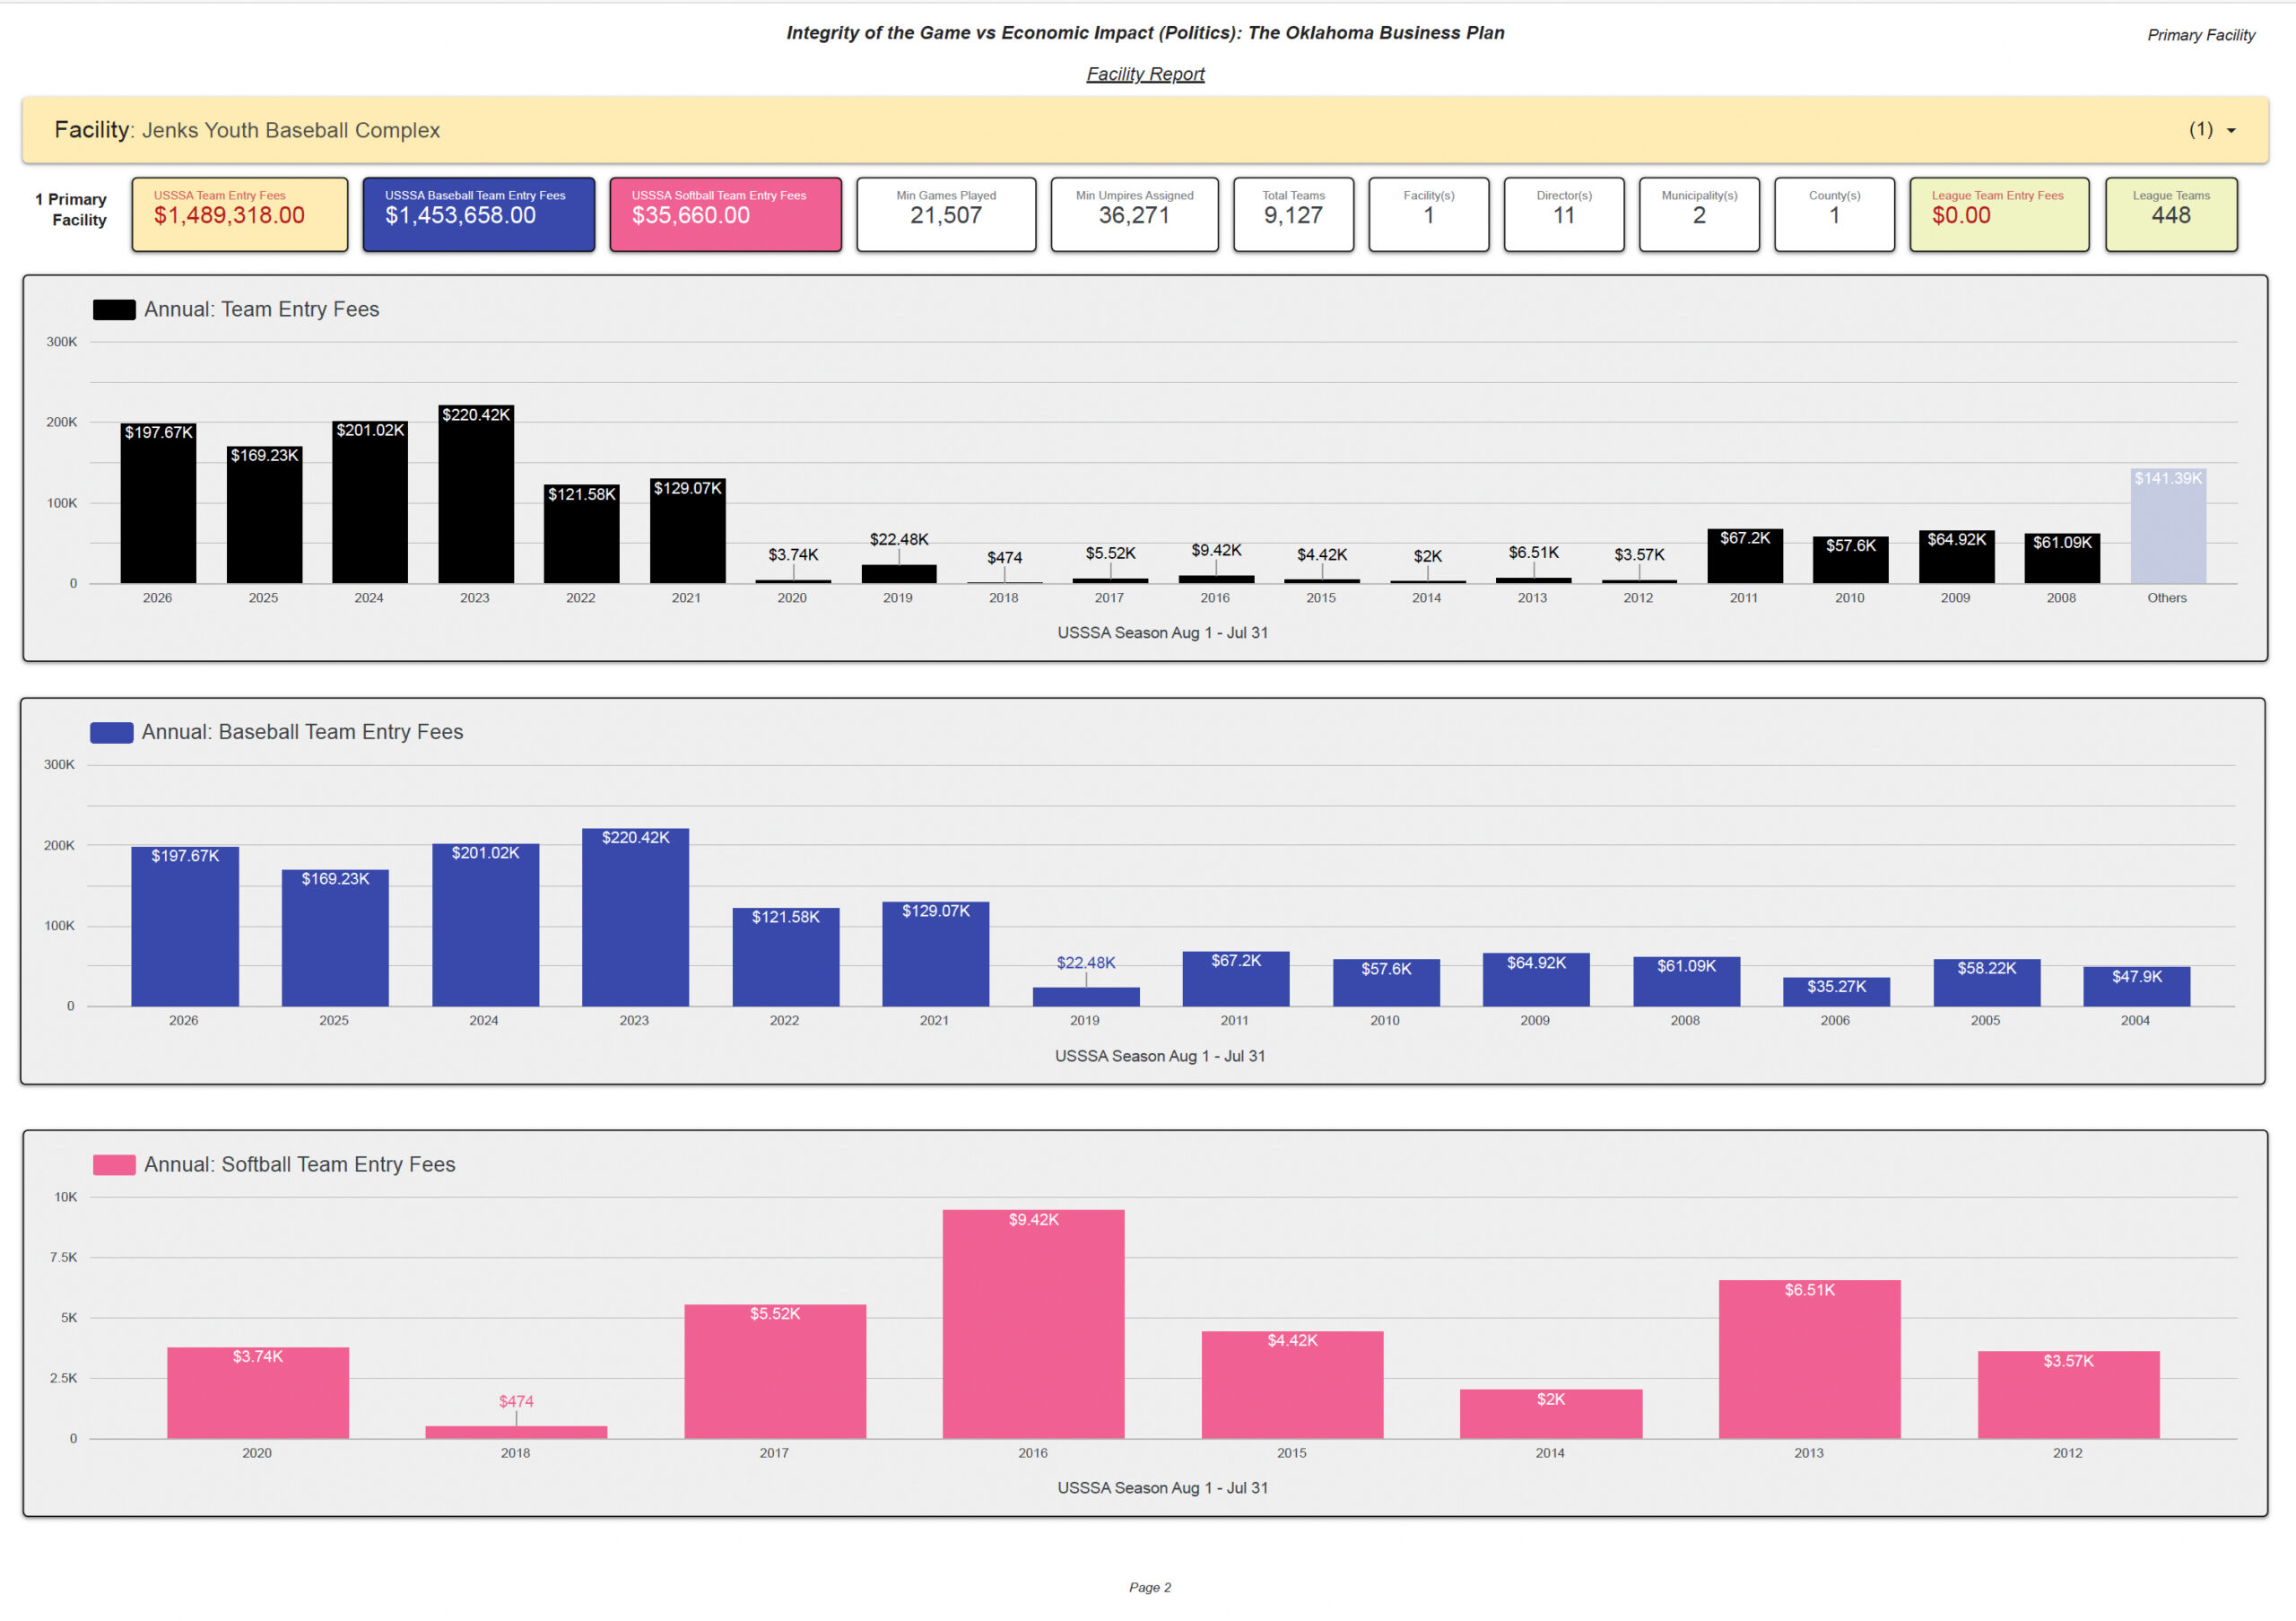
Peak Seasons
Highest displayed total season: 2023 - $220.42K.
Highest displayed baseball season: 2023 - $220.42K.
Highest displayed softball season: 2016 - $9.42K.
Baseball is the dominant sport in the direct record population. Softball appears in eight displayed seasons. Annual dollar charts measure Calculated Team Entry Fee activity and may not capture operational activity in records displaying a $0.00 Team Entry Fee.
Displayed Annual Total Calculated Team Entry Fees
| Sport Series | Displayed Seasons / Values | Highest Displayed Season |
|---|---|---|
| Baseball | 2026 $197.67K; 2025 $169.23K; 2024 $201.02K; 2023 $220.42K; 2022 $121.58K; 2021 $129.07K; 2019 $22.48K; 2011 $67.20K; 2010 $57.60K; 2009 $64.92K; 2008 $61.09K; 2006 $35.27K; 2005 $58.22K; 2004 $47.90K | 2023 - $220.42K |
| Softball | 2020 $3.74K; 2018 $474; 2017 $5.52K; 2016 $9.42K; 2015 $4.42K; 2014 $2.00K; 2013 $6.51K; 2012 $3.57K | 2016 - $9.42K |
Associated Multi-Facility / Satellite Activity
This population excludes the stand-alone Primary Facility records and examines events where Jenks Youth Baseball Complex appears with one or more additional facilities.

Largest Displayed Facility Combinations
Jenks Youth Baseball Complex + Sand Springs Youth Baseball - $277.21K
Glenpool Sports Complex + Jenks Youth Baseball Complex - $93.90K
Berryhill High School + Hilldale High School + Indian Springs Sports Complex + Jenks Youth Baseball Complex + Owasso Park South + Prue High School - $27.71K
Bentley Sports Complex + Indian Springs Sports Complex + Jenks Youth Baseball Complex + Owasso Park South + Sand Springs Youth Baseball - $26.56K
Each amount is one pool of calculated activity associated with the listed multi-facility configuration. It is not allocated among the component facilities by this dataset.
Associated Director Concentrations
Lynn Gibson - $436.49K
Rick Glasser - $54.27K
Wally Fortuna - $33.81K
Combined Documented Facility Activity Footprint
Pages 1-2 Direct / Stand-Alone Primary Facility Activity + Page 3 Associated Multi-Facility Activity = Page 4 Combined Documented Facility Activity Footprint. This is the broadest documented view involving Jenks Youth Baseball Complex.
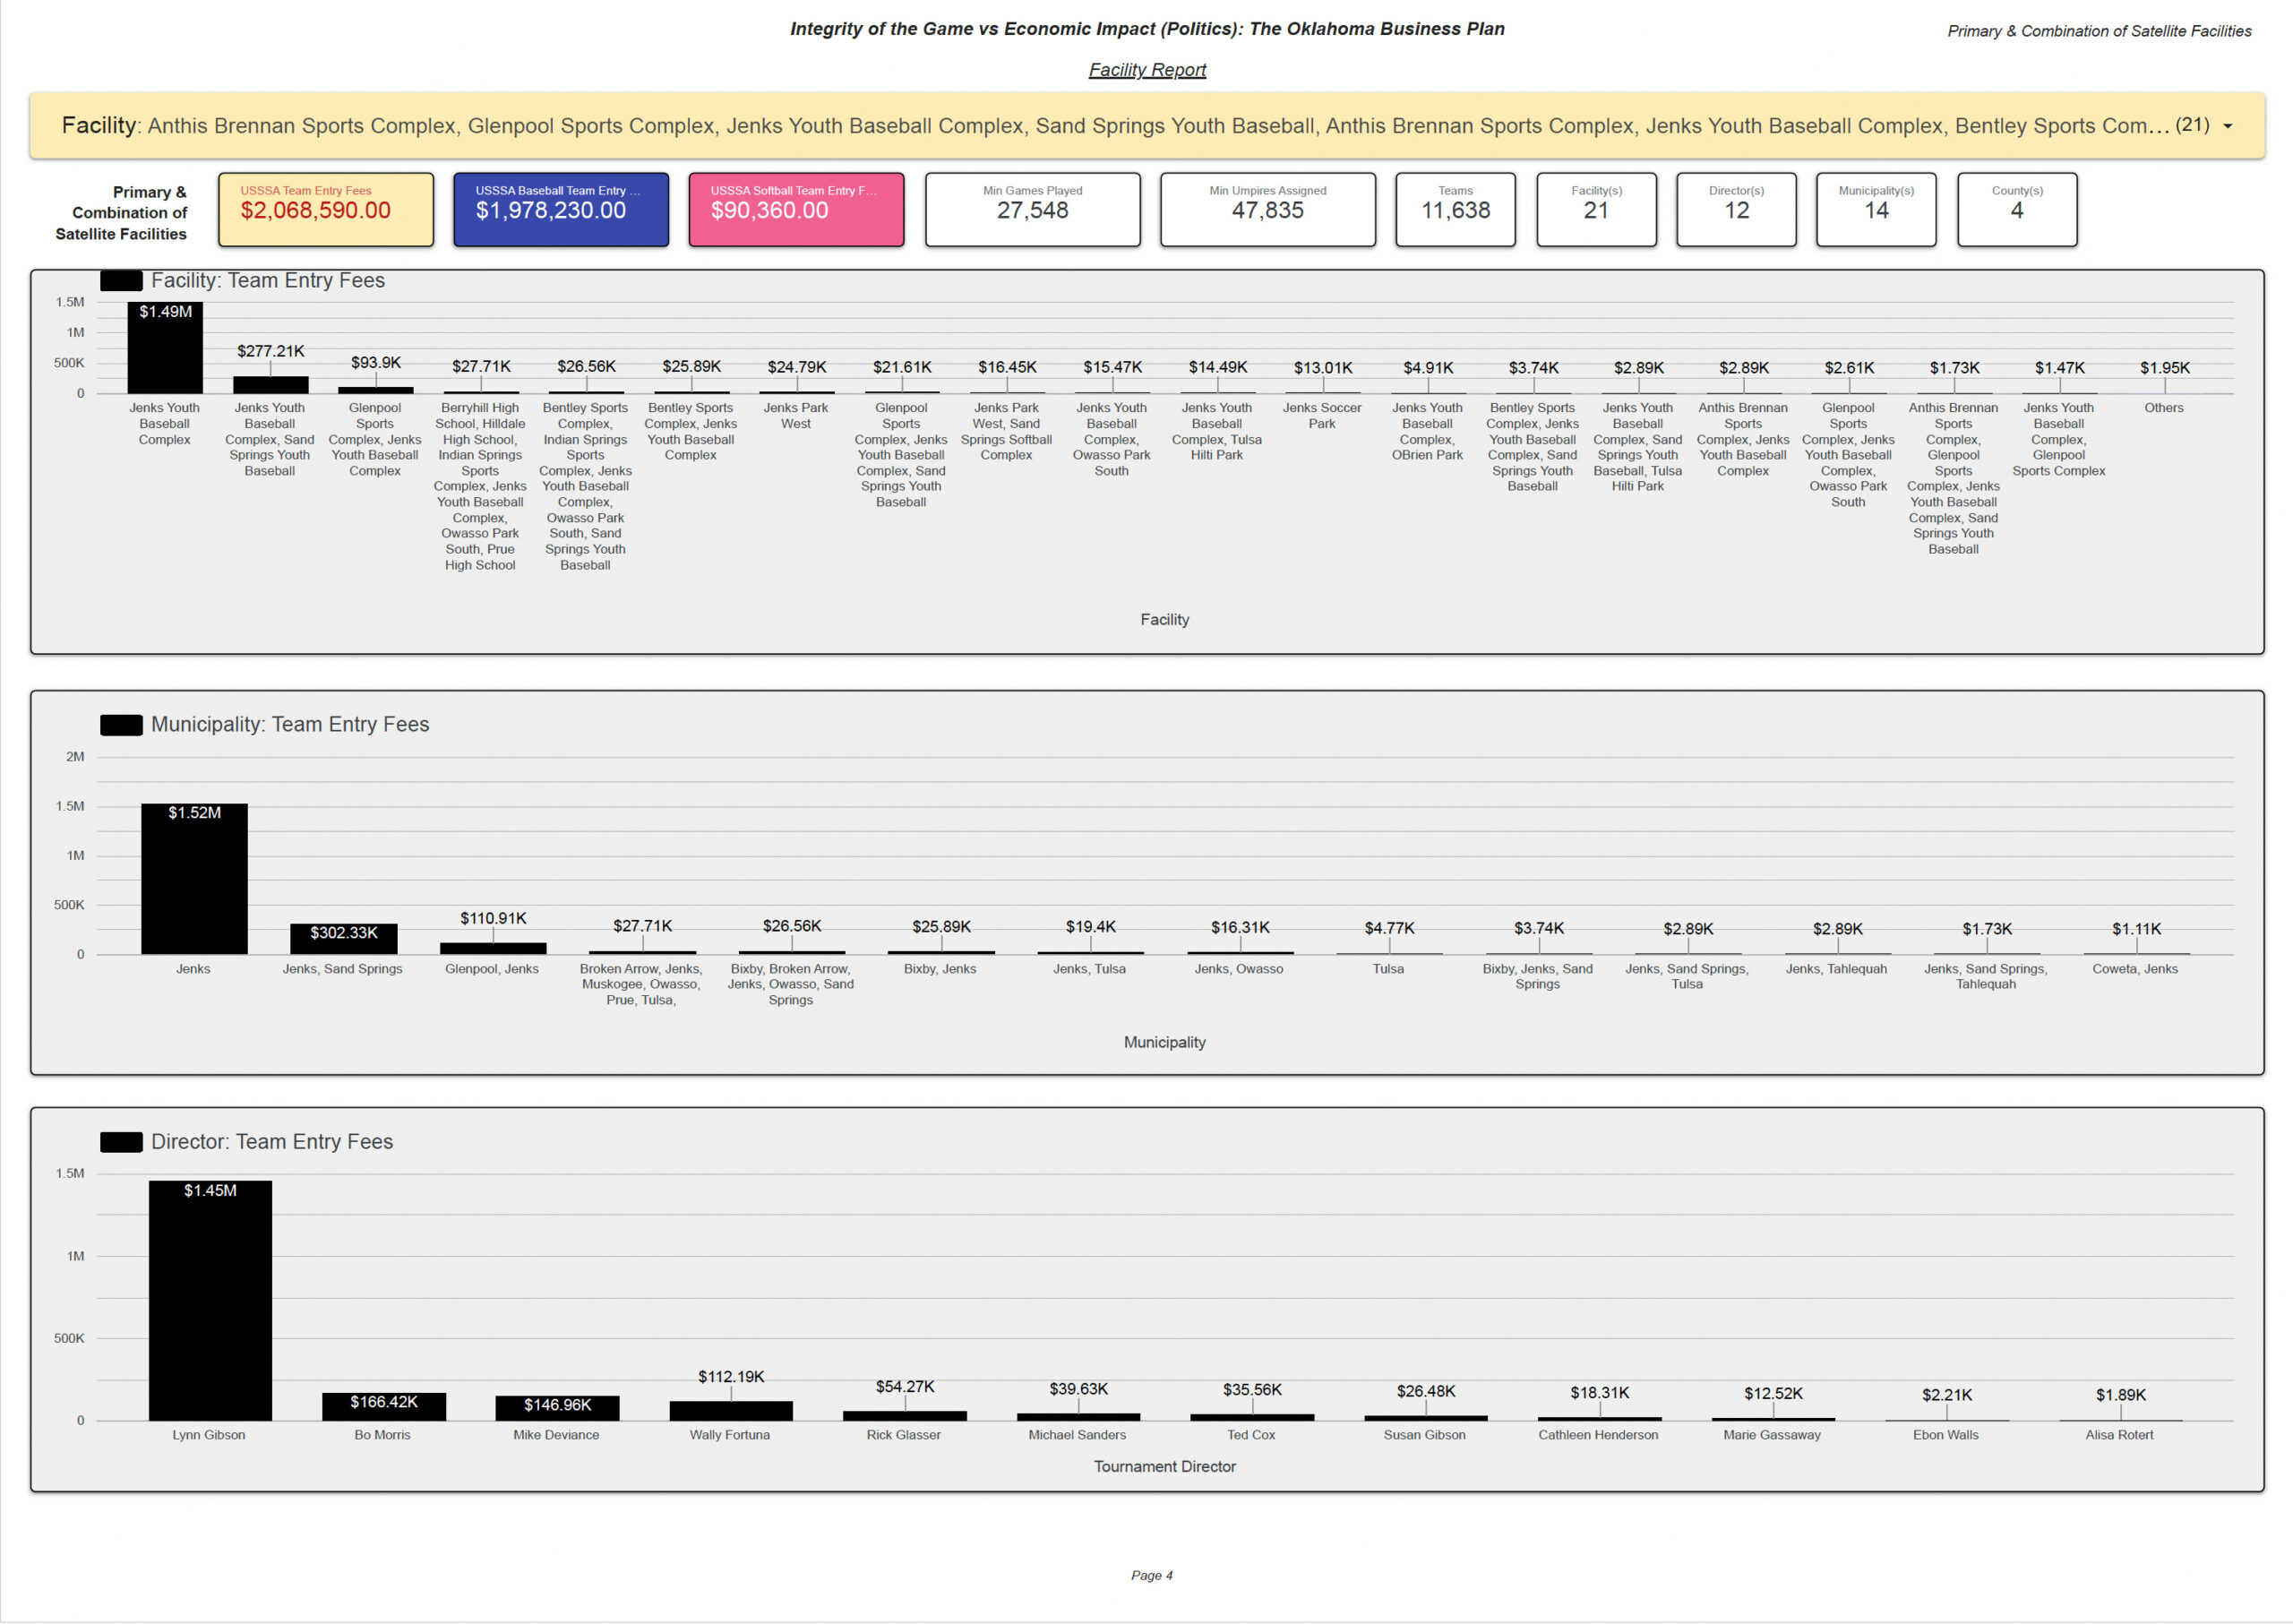
Combined Concentrations
Jenks municipality: approximately $1.52M.
Largest combined director concentration: Lynn Gibson at approximately $1.45M.
Largest associated facility configuration: Jenks Youth Baseball Complex + Sand Springs Youth Baseball at approximately $277.21K.
Direct, Associated & Combined
DIRECT
Records listing Jenks Youth Baseball Complex independently as the event facility. Multi-facility combinations are excluded.
ASSOCIATED
Records where Jenks Youth Baseball Complex appears with one or more additional facilities in the same event record.
COMBINED
Direct Primary Facility activity plus associated multi-facility activity, producing the broadest documented footprint involving the complex.
Calculated Team Entry Fees
Participating Teams × Publicly Posted Team Entry Fee = Calculated Team Entry Fees
Calculated Team Entry Fees are an analytical measure developed from publicly documented participation and publicly posted pricing at the applicable event-record level. They are useful for measuring documented scale and concentration.
Unless independently established by additional documentation, these figures are not verified actual collections, gross receipts, facility income, municipal income, tournament-director compensation, profit, taxable income, bank deposits, gate revenue, concession revenue, net proceeds, or audited financial statements.
League Records & $0.00-Fee Activity
League Teams
448
The report identifies 448 league teams in the direct Primary Facility population.
League Team Entry Fees
$0.00
A publicly reported $0.00 Team Entry Fee does not necessarily mean no operational activity occurred. The research does not impute an unsupported fee and does not assert that local fees were collected unless independent evidence establishes that fact.
Operational Reach Identified by the Dataset
Geographic Reach
The direct population identifies 2 municipalities and 1 county. The associated multi-facility population identifies 13 municipality configurations across 4 counties. The combined population identifies 14 municipality configurations and 4 counties.
The report's municipality charts include Jenks, Tulsa, and multiple combinations involving Sand Springs, Glenpool, Broken Arrow, Muskogee, Owasso, Prue, Bixby, Tahlequah, and Coweta.
Director Network
The direct population includes 11 directors, the associated population includes 8 directors, and the combined footprint includes 12 directors.
Lynn Gibson is the largest director concentration shown in the direct, associated, and combined views. Director-associated calculated amounts are analytical groupings from the event records and should not be characterized as verified income or compensation.
What This Profile Establishes - and What It Does Not
THE DATASET ESTABLISHES / CALCULATES
- Facility associations shown in public event records
- Teams, sports, seasons and tournament/league classifications
- Minimum games and minimum officials where displayed
- Tournament directors associated with applicable records
- Municipality and county fields in the dataset
- Publicly posted Team Entry Fees where available
- Calculated Team Entry Fees using the stated methodology
- Direct, associated multi-facility, and combined analytical populations
THE DATASET ALONE DOES NOT ESTABLISH
- Actual amounts collected or received
- Facility or municipal revenue
- Director compensation or profit
- Taxable income or tax liability
- Bank-account ownership or bank deposits
- Rental payments, lease consideration, or revenue-sharing arrangements
- Allocation of multi-facility event proceeds among locations
- Locally collected fees or ultimate disposition of funds
Jenks Youth Baseball Complex - 2001-2026
Jenks Youth Baseball Complex shows a substantial long-term documented USSSA activity footprint in the report. The conservative direct view identifies $1,489,318 in Calculated Team Entry Fees, including $1,453,658 in baseball and $35,660 in softball activity. The direct population includes 9,127 teams, at least 21,507 games, and at least 36,271 officials across 11 directors, 2 municipalities, and 1 county.
The report identifies 448 league teams with $0.00 in publicly displayed league Team Entry Fees. The highest displayed direct season is 2023 at $220.42K. Baseball is the dominant sport in the direct population; softball's highest displayed season is 2016 at $9.42K.
Page 3 identifies $579,272 in associated multi-facility Calculated Team Entry Fee activity across 20 facility configurations, 2,511 teams, 6,041 minimum games, 11,564 minimum officials, 8 directors, 13 municipality configurations, and 4 counties. The largest displayed associated facility combination is Jenks Youth Baseball Complex + Sand Springs Youth Baseball at $277.21K.
Page 4 combines the direct and associated populations into a $2,068,590 documented activity footprint, including $1,978,230 in baseball and $90,360 in softball activity, with 11,638 teams, at least 27,548 games, at least 47,835 officials, 21 facilities, 12 directors, 14 municipality configurations, and 4 counties.
These figures are best used to evaluate documented scale, sport mix, concentration, geographic reach, director associations, league activity, and operational relationships. They do not establish how multi-facility activity was allocated among individual locations and should not be interpreted as verified financial receipt by the facility, municipalities, directors, USSSA, or other entities.
Research, Education, Transparency & Public-Interest Analysis
This landing page and the Hidden Valley - Integrity of the Game dataset are independent research and analytical products created for research, education, transparency, public-interest, and comparative analytical purposes. This is not an official USSSA report and is not represented as prepared, sponsored, endorsed, verified, or approved by USSSA, its directors or affiliates, any governmental entity, municipality, tribe, school district, facility owner, tournament director, or other organization appearing in the research.
Calculated financial figures are research estimates derived from publicly available information and the stated methodology. They are not audits, tax determinations, forensic-accounting conclusions, legal findings, or allegations that any person or organization received, retained, concealed, misreported, or improperly used any calculated amount. Identification in the dataset does not itself imply wrongdoing, misconduct, tax noncompliance, criminal activity, civil liability, ownership, employment, or a contractual relationship.
Historical public information may include incomplete records, naming variations, reused or inconsistent identifiers, facility-name changes, missing fields, zero-dollar listings, and records that may later be modified, corrected, removed, or become unavailable. Preserve the distinction between documented fact, calculated activity, analytical inference, and conclusions requiring independent verification.