
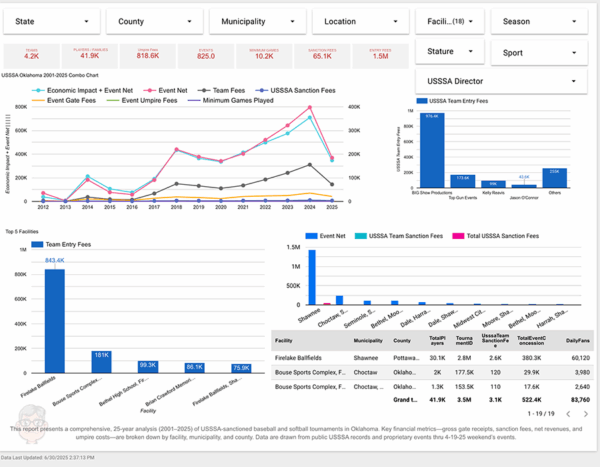
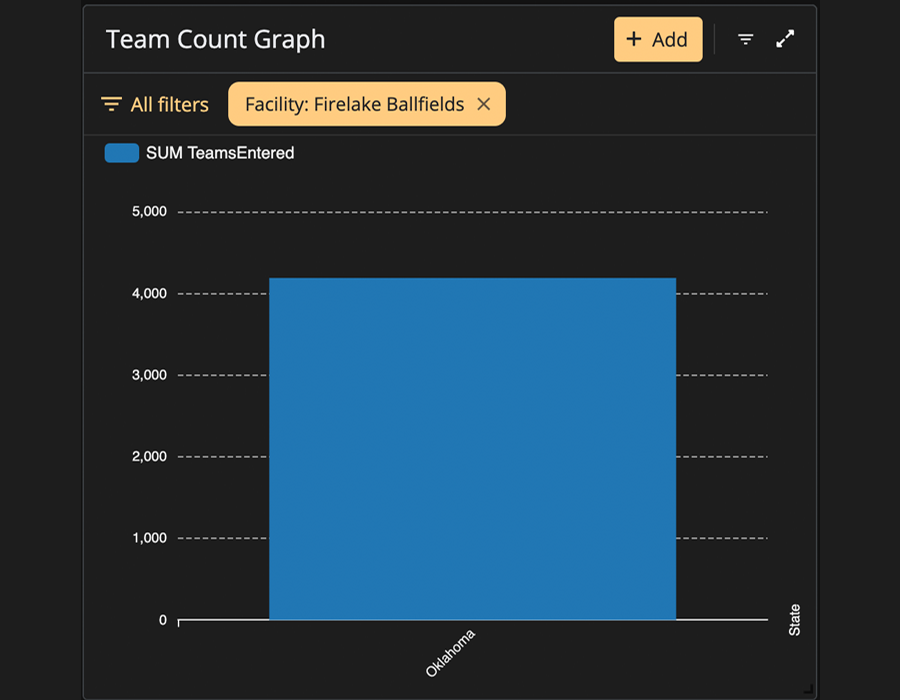
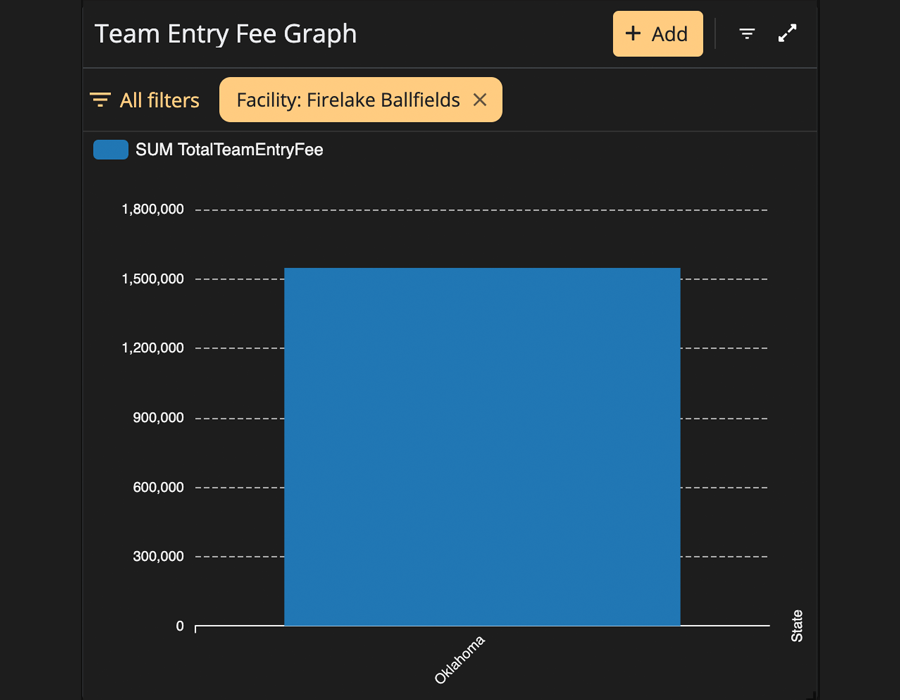
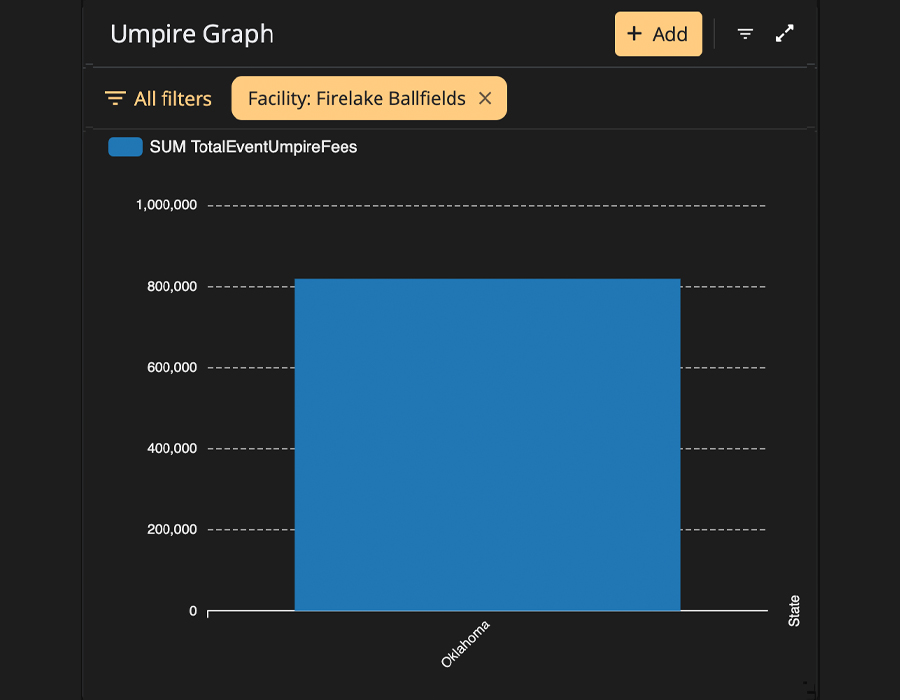
Overview Metrics for Firelake Ballfields (Facility)
| Total Events | 12 |
| Total Teams Entered | 4,551 |
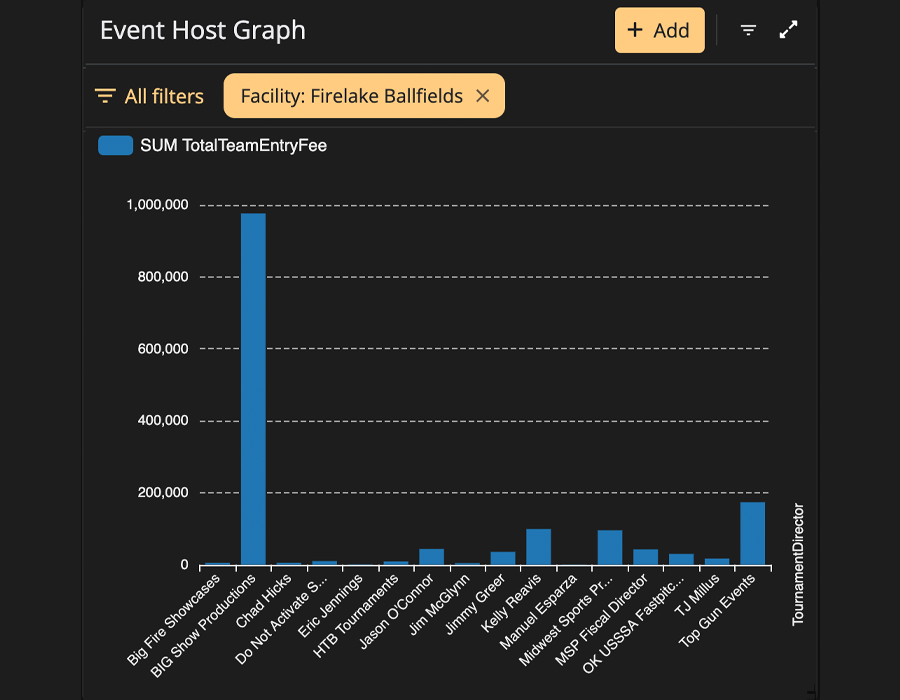
| Sum of Team Entry Fees | $1,569,861 |
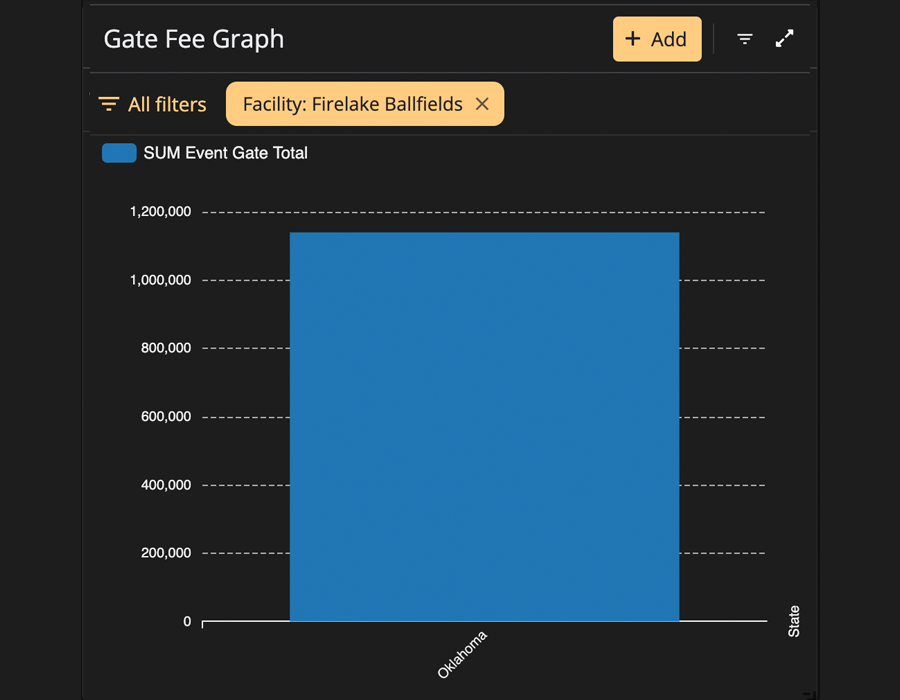
| Sum of Gate Revenue | $1,139,727 |
| Total Umpire Pay | $855,880 |
| Total USSSA Sanction Fees | $54,235 |
| Unique Facilities Count | 1 |
Venues
- Firelake Ballfields (12 events)
Event Stature Breakdown
| Stature | Count |
|---|---|
| State Qualifier | 225 |
| National Invitational | 36 |
| State Tournament | 34 |
| One Day Event | 26 |
| League | 21 |
| USA ES WFC Qualifier | 12 |
| Showcase | 4 |
| USA ES WFC-Futures WFC Qualifier | 4 |
| USA ES Invitational | 4 |
| USA ES Futures Qualifier | 2 |
| USA ES Non Qualifier Invitational | 2 |
| Qualifier | 2 |
| World Series | 1 |
| USA ES Showcase | 1 |
Economic Impact
| Direct Revenue (Entry Fees + Gate Revenue + Sanction Fees) |
$2,763,823 |
| Estimated Indirect Spend (20% of Gate Revenue) |
$227,945 |
| Total Economic Impact (Direct + Indirect, ×1.5) |
$4,487,653 |
Disclaimer
The content and data presented on this page are compiled from publicly available sources and our proprietary analyses. While every effort has been made to ensure accuracy, inadvertent errors may occur due to human oversight or limitations of AI-driven tools. This research is descriptive in nature and does not imply any predetermined conclusions or endorsements.
The author and publisher assume no liability for any loss or damage arising from the use of this information. If you believe any data is incorrect or incomplete, please contact us so that we may review and, if necessary, correct the record.
This page is provided for informational and scholarly purposes only and should not be construed as legal, financial, or professional advice.